Reversal Point MT5
- Indicateurs
- Ziheng Zhuang
- Version: 4.0
- Mise à jour: 1 décembre 2022
- Activations: 20
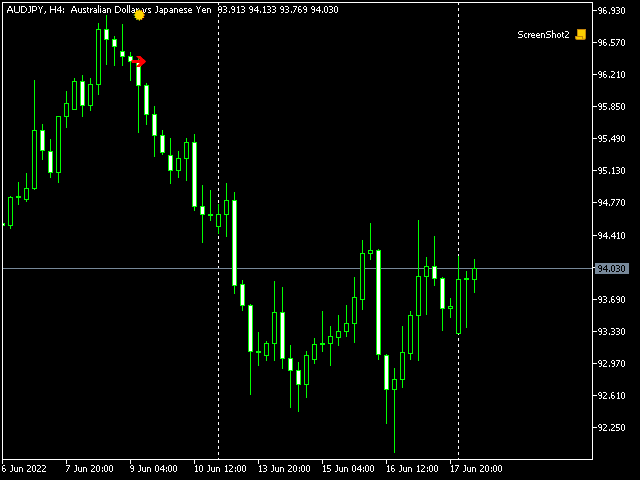
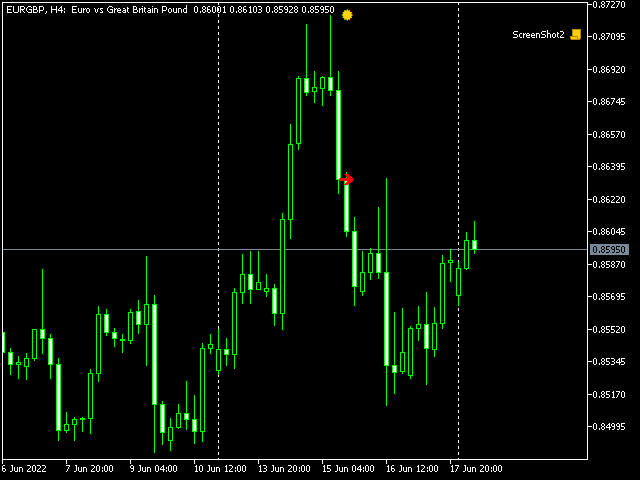
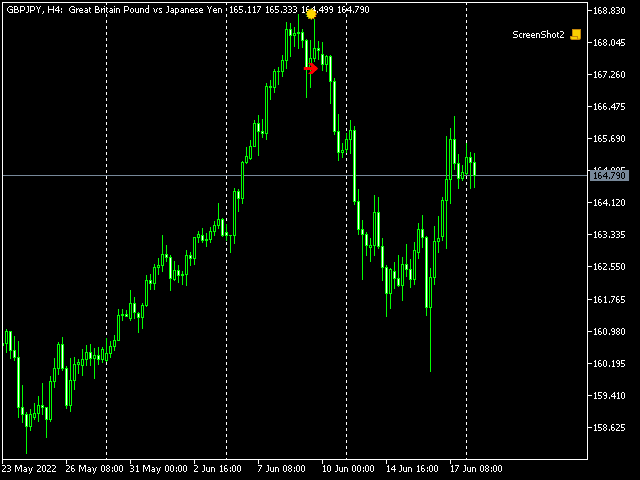
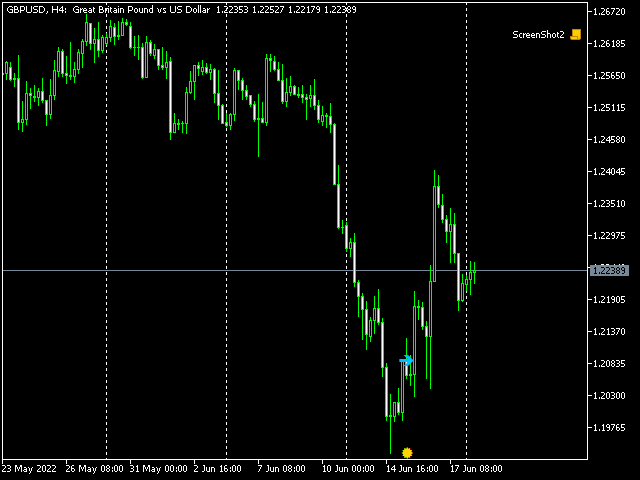
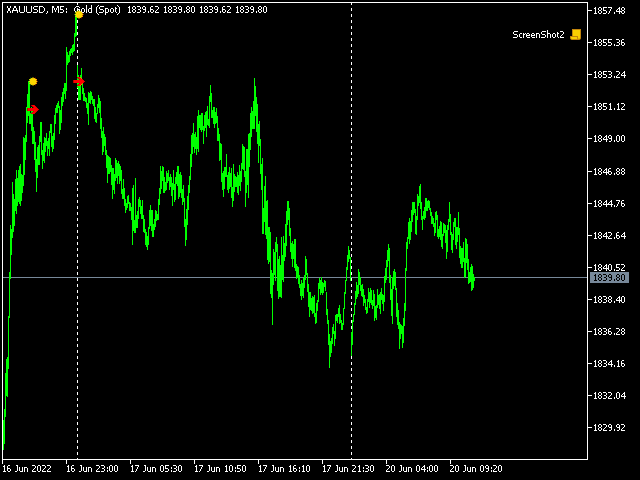
The purpose of the inidcator is to identify the reversal point.
The blue arrow is buy signal and the yellow star is its stop loss.
The red arrow is sell signal and the yellow star is its stop loss.
Please note that the singal is against trend,it could be continual fail.
Alert feature: if there is a signal, the indicator will send alerts of popup window,email or mobile push.
Inputs:
- Popup Window Alert: it is false in default
- Email Alert : it is false in default
- Mobile Push Alert: it is false in default.


L'utilisateur n'a laissé aucun commentaire sur la note