Levels of resistance and support
- Indicateurs
- Wiktor Keller
- Version: 1.2
- Mise à jour: 11 juin 2022
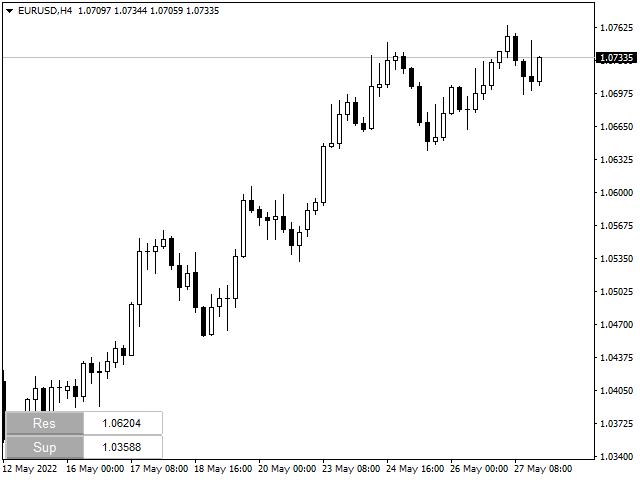
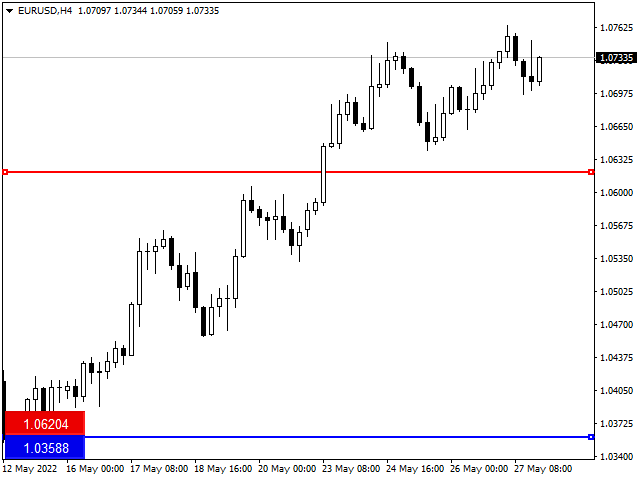
Resistance and Support is an easy to use indicator to apply horizontal lines of resistance and support.
There are two windows for adding levels. When you press the button, a line appears on the price chart.
It is possible to double-click this line with the mouse to activate and move it,
thereby changing the indicator readings.
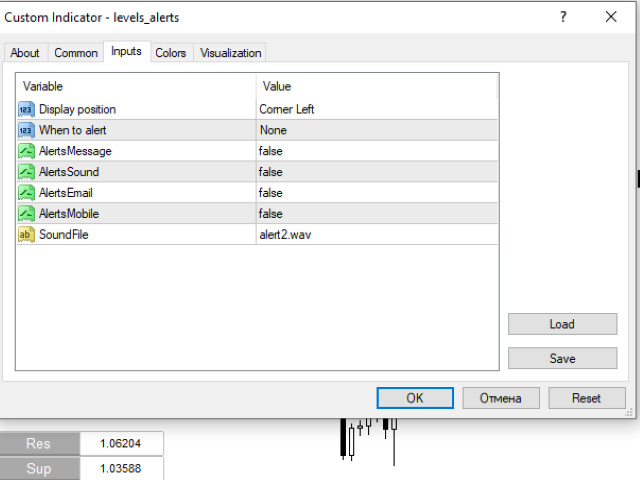
In the indicator menu there is a choice of possible alerts -
no alert,
alert on touching the level
an alert for closing the candle after the level.

Thanks for the freebie... Just what I have been looking for. Works perfectly for my needs. Appreciate you.