• Aperçu
  • Avis
  • Commentaires (13)
  • Nouveautés

M1 Scalper Mt4

This indicator is excellent for scalping on the M1 or M5 chart.

Uses a special algorithm for the lines.

No need to set up the indicator.

Does not feature any alerts and is best used manually after visually confirming the line displays.

NB: Make sure to download M1 history before testing and use.


How to use:

  • Simply attach to M1 or M5 chart.
  • Zoom chart out completely.
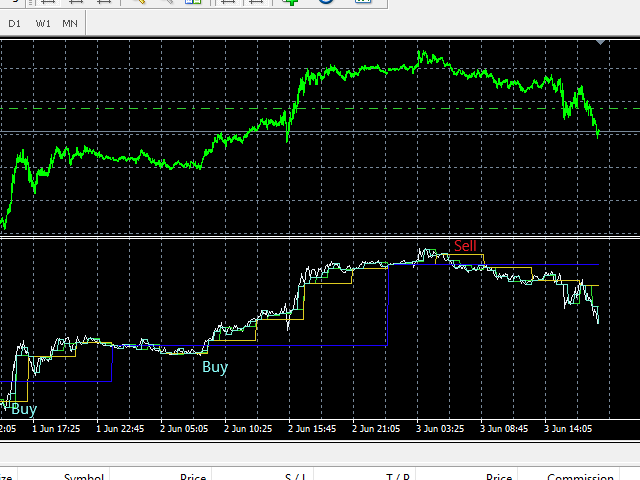
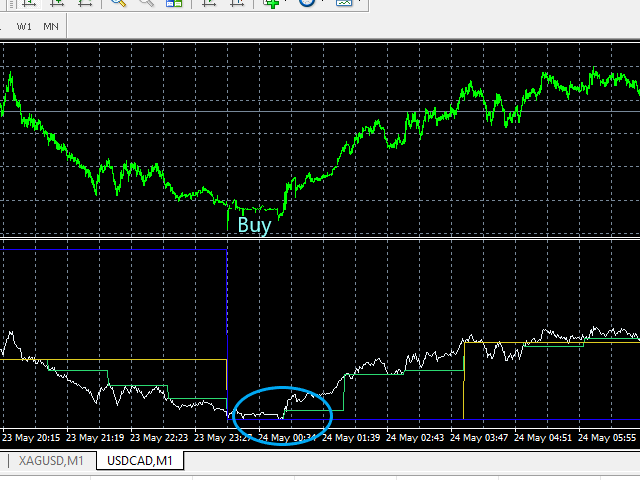
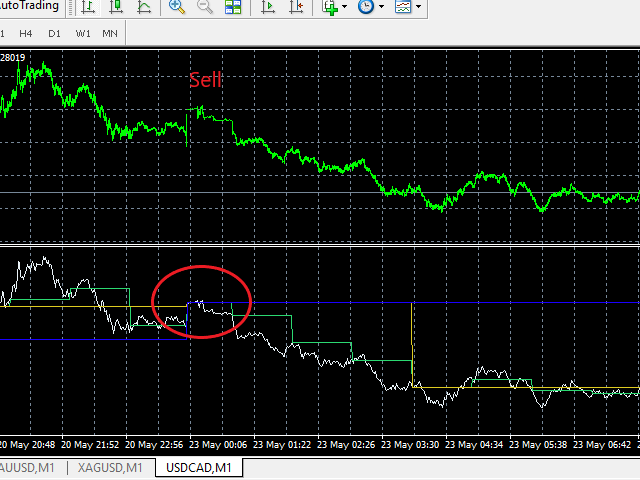
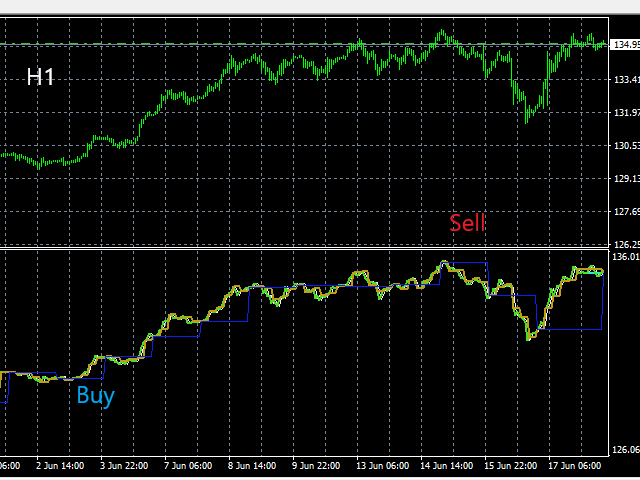
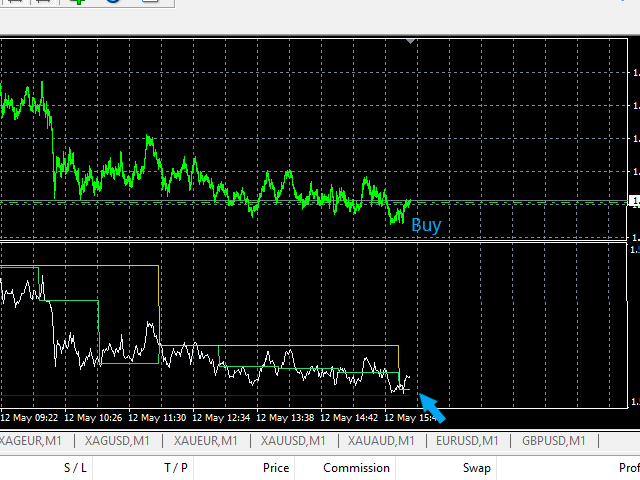
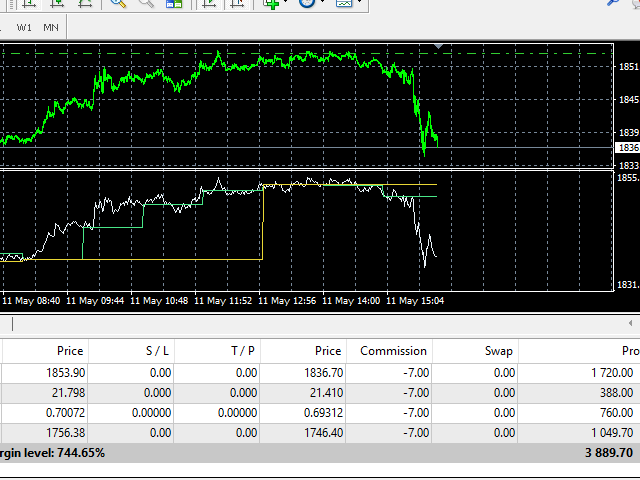
  • Sell when all lines above the white line (PriceLine). Sniper line crosses above white line.
  • Buy when all lines below the white line (PriceLine). Sniper line crosses below white line.
  • See example screens below.
  • Or use as you see fit for your strategy.
  • Best results on Major pairs, but can also be used on other pairs.


Important to note:

  • Please combine this indicator with your other tools for best results.
  • Always test your strategy on a demo account before using a new indicator on a live account.
  • You use this indicator at your own risk.
  • Do not risk money you cannot afford to lose.
Produits recommandés
VR Cub
Vladimir Pastushak
VR Cub est un indicateur permettant d'obtenir des points d'entrée de haute qualité. L'indicateur a été développé pour faciliter les calculs mathématiques et simplifier la recherche de points d'entrée dans un poste. La stratégie de trading pour laquelle l'indicateur a été rédigé prouve son efficacité depuis de nombreuses années. La simplicité de la stratégie de trading est son grand avantage, qui permet même aux traders débutants de négocier avec succès avec elle. VR Cub calcule les points d'ouve
Infinity Trend Pro
Yaroslav Varankin
1 (1)
This is a trend indicator without redrawing Developed instead of the binary options strategy (by the color of the Martingale candlestick) Also works well in forex trading When to open trades (binary options) A signal will appear in the place with a candle signaling the current candle It is recommended to open a deal for one candle of the current timeframe M1 and M5 When a blue dot appears, open a deal up When a red dot appears, open a trade down. How to open trades on Forex. When a signal is rec
Master Scalping M1 est un indicateur innovant qui utilise un algorithme pour déterminer rapidement et avec précision la tendance. L'indicateur calcule le temps d'ouverture et de fermeture des positions, les algorithmes de l'indicateur vous permettent de trouver les moments idéaux pour entrer dans une transaction (acheter ou vendre un actif), ce qui augmente le succès des transactions pour la plupart des commerçants. Avantages de l'indicateur : Facile à utiliser, ne surcharge pas le graphique ave
Owl smart levels
Sergey Ermolov
4.63 (54)
Version MT5  |  FAQ L' indicateur Owl Smart Levels   est un système de trading complet au sein d'un seul indicateur qui comprend des outils d'analyse de marché populaires tels que   les fractales avancées de Bill Williams , Valable ZigZag qui construit   la structure d'onde correcte   du marché et   les niveaux de Fibonacci   qui marquent les niveaux exacts d'entrée. sur le marché et les endroits où prendre des bénéfices. Description détaillée de la stratégie Mode d'emploi de l'indicateur Conse
Sto Signal AM
Andriy Matviyevs'kyy
This indicator displays Stochastic osc signals on the price chart and allows the user to receive notifications of such signals. The Stochastic indicator is a classic and proven indicator of the technical analysis of the markets. Despite its age, it is still relevant today. Depending on the settings, the indicator allows you to work effectively on various TFs and any markets. Signals are given on fully formed bars and are not redrawn. Custom Parameters: Stochastic_Price (0-1) - The applied pric
FREE
Cosmic Diviner X Planet
Olena Kondratenko
4 (2)
This unique multi-currency strategy simultaneously determines the strength of trends and market entry points, visualizing this using histograms on the chart. The indicator is optimally adapted for trading on the timeframes М5, М15, М30, Н1. For the convenience of users, the indicator renders the entry point (in the form of an arrow), recommended take profit levels (TP1, TP2 with text labels) and the recommended Stop Loss level. The take profit levels (TP1, TP2) are automatically calculated for
Stepping Trend
Mpendulo Chiliza
The Stepping Trend Indicator     The Steppi ng Trend indicator uses the  average true range  (ATR indicator) in its calculation. This gives you control to set your own average true range period, I set the Default as 10.   Indicator Details. Green Arrow Up: This means you are at the starting point of a new bullish trend, it’s time to buy.   Red  Arrow  Down : This means you are at the starting point of a new  bearish  trend, it’ s time to sell .   What if you miss the Arrow Signal?   No
Nouvelle version plus précise de l'indicateur Xmaster. Plus de 200 commerçants du monde entier ont effectué plus de 15 000 tests de différentes combinaisons de cet indicateur sur leurs PC afin d'obtenir la formule la plus efficace et la plus précise. Et ici, nous vous présentons l'indicateur « Indicateur de formule Xmaster forex sans repeindre », qui affiche des signaux précis et ne repeint pas. Cet indicateur envoie également des signaux au commerçant par e-mail et push. Avec l'arrivée de chaq
Laser Trend
Nicolas Zouein
The trend is your friend! This is what this indicator is all about. Follow this famous saying and be safe. Characteristics: Buy/Sell signals fixed on the close of a bar. Works on all symbols and all timeframes. Clear visual market trend laser line, Buy/Sell signal arrows, market strength meter, TP1 & TP2 boxes. Visual signals when to enter, when to exit the market. No repainting. Compatible with Flexible EA for trading automation. (Ask for a free set file optimized to perform 2010-2018) Para
ZhiBiCCI MT4
Qiuyang Zheng
5 (1)
[ZhiBiCCI] indicators are suitable for all cycle use, and are also suitable for all market varieties. [ZhiBiCCI] Green solid line is a reversal of bullish divergence. The green dotted line is a classic bullish divergence. [ZhiBiCCI] The solid line to the red is a reverse bearish divergence. The red dotted line is a classical bearish divergence. [ZhiBiCCI] can be set in the parameters (Alert, Send mail, Send notification), set to (true) to send instant signals to the alarm window, email, in
This indicator is another variant of the famous powerful indicator Fibonacci-SS https://www.mql5.com/en/market/product/10136 but has different behaviour in placing Pending Order and TP Line. Automatically places Fibonacci retracement lines from the last highest and lowest visible bars on the chart with: An auto Pending Order (Buy/Sell). Taking Profit 1, Taking Profit 2 is pivot point and Taking Profit 3 for extended reward opportunity. The best risk and reward ratio. Simple and powerful indica
Super Gator
Agustinus Biotamalo Lumbantoruan
This indi shows the following 1. Supertrend 2. Alligator (Not a regular alligator) 3. ZigZag 4. Moving Average 5. Trend Continuation/Mini correction Signal (plotted in X) (See screenshots in green background color 6. Early Signal Detection (See screenshots in green background color) You may treat Alligator as the lagging indicator The leading indicator is the supertrend. The zig zag is based on the leading indicator where it gets plotted when the leading indicator got broken to the opposite.
Trendiness Index
Libertas LLC
5 (3)
"The trend is your friend" is one of the best known sayings in investing, because capturing large trendy price movements can be extremely profitable. However, trading with the trend is often easier said than done, because many indicators are based on price reversals not trends. These aren't very effective at identifying trendy periods, or predicting whether trends will continue. We developed the Trendiness Index to help address this problem by indicating the strength and direction of price trend
Noize Absorption Index MT4
Ekaterina Saltykova
5 (1)
Noize Absorption Index - is the manual trading system that measures the difference of pressure between bears forces and bulls forces. Green line - is a noize free index that showing curent situation. Zero value of index shows totally choppy/flat market.Values above zero level shows how powerfull bullish wave is and values below zero measures bearish forces.Up arrow appears on bearish market when it's ready to reverse, dn arrow appears on weak bullish market, as a result of reverse expectation. S
Distinctive
Tatiana Savkevych
Distinctive is a forex trending arrow indicator for identifying potential entry points. I like it, first of all, because it has a simple mechanism of work, adaptation to all time periods and trading tactics. Created on the basis of a regression channel with filters. Plotting the Lawrence indicator signals on a price function chart using a mathematical approach. How it works - when the price breaks out in the overbought / oversold zone (channel levels), a buy or sell signal is generated. Every
DYJ Alligator SignalSource   is based on Alligator   indicator. It can be used for any currency pair and timeframe. The blue line (Alligator's Jaw) is the Balance Line for the timeframe that was used to build the chart (13-period Smoothed Moving Average, moved into the future by 8 bars); Red Line (Alligator's Teeth) is the Balance Line for the value timeframe of one level lower (8-period Smoothed Moving Average, moved by 5 bars into the future); Green Line (Alligator's Lips) is the Balance Line
Mirror
Stanislav Korotky
This indicator predicts rate changes based on the chart display principle. It uses the idea that the price fluctuations consist of "action" and "reaction" phases, and the "reaction" is comparable and similar to the "action", so mirroring can be used to predict it. The indicator has three parameters: predict - the number of bars for prediction (24 by default); depth - the number of past bars that will be used as mirror points; for all depth mirroring points an MA is calculated and drawn on the ch
Fibonacci retracement and extension line drawing tool Fibonacci retracement and extended line drawing tool for MT4 platform is suitable for traders who use  golden section trading Advantages: There is no extra line, no too long line, and it is easy to observe and find trading opportunities Trial version: https://www.mql5.com/zh/market/product/35884 Main functions: 1. Multiple groups of Fibonacci turns can be drawn directly, and the relationship between important turning points
The indicator displays the data of the Stochastic oscillator from a higher timeframe on the chart. The main and signal lines are displayed in a separate window. The stepped response is not smoothed. The indicator is useful for practicing "manual" forex trading strategies, which use the data from several screens with different timeframes of a single symbol. The indicator uses the settings that are identical to the standard ones, and a drop-down list for selecting the timeframe. Indicator Parame
RenkoMaStoch
Sergey Deev
1 (1)
The indicator displays renko bars on a chart, uses them to plot the fast and slow moving average and Stochastic, as well as it provides buy/sell signals: a buy signal is generated when the fast moving is above the slow one, and the signal line of Stochastic crosses the lower level from bottom up; a sell signal is generated when the fast moving is below the slow one, and the signal line of Stochastic crosses the upper level from top to bottom; Renko is a non-trivial price display method. Instead
Blahtech Market Profile
Blahtech Limited
4.61 (18)
Was: $249  Now: $99   Market Profile defines a number of day types that can help the trader to determine market behaviour. A key feature is the Value Area, representing the range of price action where 70% of trading took place. Understanding the Value Area can give traders valuable insight into market direction and establish the higher odds trade. It is an excellent addition to any system you may be using. Blahtech Limited presents their Market Profile indicator for the MetaTrader community. Ins
The BuySellAlert arrow indicator is developed based on the use of HMA, Laguerre, CCI, and ATR . The BuySellAlert arrow indicator: generates  entry points  for BUY and SELL  displays current profit ; displays  current spread. The profitability of the indicator is shown in the screenshot on the example of the GBPUSD pair Does not redraw and works on opening bar. Time frames - M1-M30. Recommended Time frames M5-M15. Setting ALARM - enable/disable the alarm; Push    - enable/disable Push notificatio
Fourteen plus nine TD Sequential
MOHAMMED IMAD HUSSEIN BASSEE
Fourteen plus nine What is it for? Applying Tom DeMark’s TD Sequential serves the purpose of identifying a price point where an uptrend or a downtrend exhausts itself and reverses. . What are the main components of TD Sequential? TD Sequential has two parts – TD Setup and TD Countdown. The first phase of TD Sequential starts with a TD Setup and is completed with a 9 count. When the 9 count is completed, it is at that point, a price pause, price pullback, or reversal is likely. It is also at tha
Buy and sell zones
Evgeniy Zhdan
5 (3)
Indicator for determining flat and trend. If the price is below any of the two histograms and two lines (red and blue), this is a sell zone. When purchasing this version of the indicator, MT5 version for one real and one demo account - as a gift (to receive, write me a private message)! If the price is above any of the two histograms and two lines (red and blue), this is a buy zone. MT5 version:  https://www.mql5.com/en/market/product/70409 If the price is between two lines or in the zone
Daily Candle Predictor est un indicateur qui prédit le cours de clôture d'une bougie. L'indicateur est principalement destiné à être utilisé sur les graphiques D1. Cet indicateur convient à la fois au trading forex traditionnel et au trading d'options binaires. L'indicateur peut être utilisé comme un système de trading autonome, ou il peut servir de complément à votre système de trading existant. Cet indicateur analyse la bougie actuelle, calcule certains facteurs de force à l'intérieur du corps
Trend Master Chart MT4
Frederic Jacques Collomb
Trend Master Chart est l'indicateur de tendance qu'il vous faut. Il se superpose au graphique et utilise un code couleur pour définir les différentes tendances/impulsions du marché. Il utilise un algorithme qui combine deux moyennes mobiles et différents oscillateurs. Les périodes de ces trois élément sont modifiables. Il fonctionne sur n'importe quel time-frame et n'importe quelle Pair. D'un coup d’œil vous pourrez identifier une tendance haussière ou baissière et les différents points d'entrée
FREE
Point61 Indicator
Evgeniy Machok
5 (1)
The Point61 indicator is the result of many years of monitoring of price behavior of currency pairs and metals. It is not a secret, that in times of uncertainty, traders are looking for possible levels of support and resistance - the point, where price should stop its movement. There are 2 possible scenarios at these points: 1. Reverse (correction) to the opposite direction; 2. Breakthrough to continue movement. Very often these points are used to set stop orders - TakeProfit or
The Th3Eng PipFinite indicator is based on a very excellent analysis of the right trend direction with perfect custom algorithms. It show the true direction and the best point to start trading. With StopLoss point and Three Take Profit points. Also it show the right pivot of the price and small points to order to replace the dynamic support and resistance channel, Which surrounds the price. And Finally it draws a very helpful Box on the left side on the chart includes (take profits and Stop loss
Fibonacci indicator based on fractal.This software can automatically draw the golden section proportional line of two trend lines, and mark all the recent high and low prices.And the percentage value of volatility is a multi-cycle, multi-currency oscillation indicator.It is very effective for traders to find support and resistance lines and find entry and exit points near them.
HMA Trend Professional MT4
Pavel Zamoshnikov
4.63 (8)
Improved version of the free HMA Trend indicator (for MetaTrader 4) with statistical analysis. HMA Trend is a trend indicator based on the Hull Moving Average (HMA) with two periods. HMA with a slow period identifies the trend, while HMA with a fast period determines the short-term movements and signals in the trend direction. The main differences from the free version: Ability to predict the probability of a trend reversal using analysis of history data. Plotting statistical charts for analyz
Les acheteurs de ce produit ont également acheté
Gann Made Easy
Oleg Rodin
4.96 (46)
Gann Made Easy est un système de trading Forex professionnel et facile à utiliser qui est basé sur les meilleurs principes de trading en utilisant la théorie de mr. WD Gann. L'indicateur fournit des signaux d'ACHAT et de VENTE précis, y compris les niveaux Stop Loss et Take Profit. Vous pouvez échanger même en déplacement en utilisant les notifications PUSH. S'il vous plaît contactez-moi après l'achat! Je partagerai avec vous mes astuces de trading et d'excellents indicateurs bonus gratuitement!
Atomic Analyst
Issam Kassas
5 (1)
Tout d'abord, il convient de souligner que cet indicateur de trading n'est ni repainting, ni redrawing et ne présente aucun délai, ce qui le rend idéal à la fois pour le trading manuel et automatisé. L'Analyste Atomique est un indicateur d'action sur les prix PA qui utilise la force et le momentum du prix pour trouver un meilleur avantage sur le marché. Équipé de filtres avancés qui aident à éliminer les bruits et les faux signaux, et à augmenter le potentiel de trading. En utilisant plusieur
ACTUELLEMENT 26% DE RÉDUCTION La meilleure solution pour tout débutant ou trader expert ! Cet indicateur est un outil de trading unique, de haute qualité et abordable car nous avons incorporé un certain nombre de caractéristiques exclusives et une nouvelle formule. Avec seulement UN graphique, vous pouvez lire la force de la devise pour 28 paires Forex ! Imaginez comment votre trading va s'améliorer parce que vous êtes capable de repérer le point de déclenchement exact d'une nouvelle tendan
Scalper Vault
Oleg Rodin
5 (27)
Scalper Vault est un système de scalpage professionnel qui vous fournit tout ce dont vous avez besoin pour un scalpage réussi. Cet indicateur est un système de trading complet qui peut être utilisé par les traders de forex et d'options binaires. Le délai recommandé est M5. Le système vous fournit des signaux fléchés précis dans le sens de la tendance. Il vous fournit également des signaux supérieurs et inférieurs et des niveaux de marché Gann. Les indicateurs fournissent tous les types d'alertes
Trend Screener
STE S.S.COMPANY
4.83 (86)
Indicateur de tendance, solution unique révolutionnaire pour le trading et le filtrage des tendances avec toutes les fonctionnalités de tendance importantes intégrées dans un seul outil ! Il s'agit d'un indicateur multi-période et multi-devises 100 % non repeint qui peut être utilisé sur tous les symboles/instruments : forex, matières premières, crypto-monnaies, indices et actions. Trend Screener est un indicateur de suivi de tendance efficace qui fournit des signaux de tendance fléchés avec des
TPSproTREND PrO
Roman Podpora
5 (15)
TPSpro TRENDPRO  - is a trend indicator that automatically analyzes the market and provides information about the trend and each of its changes, as well as giving signals for entering trades without redrawing! The indicator uses each candle, analyzing them separately. referring to different impulses - up or down impulse. Exact entry points into transactions for currencies, crypto, metals, stocks, indices!  -  Version MT5               DETAILED DESCRIPTION        /       TRADING SETUPS           
Présentation       Quantum Trend Sniper Indicator   , l'indicateur révolutionnaire MQL5 qui transforme la façon dont vous identifiez et négociez les inversions de tendance ! Développé par une équipe de traders expérimentés avec une expérience commerciale de plus de 13 ans,       Indicateur Quantum Trend Sniper       est conçu pour propulser votre parcours de trading vers de nouveaux sommets grâce à sa manière innovante d'identifier les inversions de tendance avec une précision extrêmement élevée
Tout d'abord, il convient de souligner que cet outil de trading est un indicateur non repeint, non redessiné et non retardé, ce qui le rend idéal pour le trading professionnel. L'indicateur Smart Price Action Concepts est un outil très puissant à la fois pour les nouveaux et les traders expérimentés. Il regroupe plus de 20 indicateurs utiles en un seul, combinant des idées de trading avancées telles que l'analyse du trader Inner Circle et les stratégies de trading Smart Money Concepts. Cet in
Le profit de la structure du marché change à mesure que le prix s'inverse et recule. L'indicateur d'alerte d'inversion de la structure du marché identifie le moment où une tendance ou un mouvement de prix approche de l'épuisement et est prêt à s'inverser. Il vous avertit des changements dans la structure du marché qui se produisent généralement lorsqu'un renversement ou un recul majeur est sur le point de se produire. L'indicateur identifie initialement les cassures et la dynamique des prix,
Scalper Inside PRO
Alexey Minkov
4.75 (55)
SALE NOW! Limited Time Offer! An exclusive indicator that utilizes an innovative algorithm to swiftly and accurately determine the market trend. The indicator automatically calculates opening, closing, and profit levels, providing detailed trading statistics. With these features, you can choose the most appropriate trading instrument for the current market conditions. Additionally, you can easily integrate your own arrow indicators into Scalper Inside Pro to quickly evaluate their statistics and
Advanced Supply Demand
Bernhard Schweigert
4.92 (310)
CURRENTLY 26% OFF !! Best Solution for any Newbie or Expert Trader! This indicator is a unique, high quality and affordable trading tool because we have incorporated a number of proprietary features and a new formula. With this update, you will be able to show double timeframe zones. You will not only be able to show a higher TF but to show both, the chart TF, PLUS the higher TF: SHOWING NESTED ZONES. All Supply Demand traders will love it. :) Important Information Revealed Maximize the potenti
TPSpro RFI Levels
Roman Podpora
5 (13)
A key element in trading is zones or levels from which decisions to buy or sell a trading instrument are made. Despite attempts by major players to conceal their presence in the market, they inevitably leave traces. Our task was to learn how to identify these traces and interpret them correctly. Reversal First Impulse levels (RFI)   -  Version MT5                INSTRUCTIONS                 RUS                 ENG                                       R ecommended to use with an indicator   -  
Découvrez le secret pour réussir le trading Forex avec notre indicateur MT4 personnalisé! Vous êtes-vous déjà demandé comment réussir sur le marché du Forex, gagnant régulièrement des bénéfices tout en minimisant les risques? Voici la réponse que vous avez recherchée! Permettez-nous d'introduire notre indicateur MT4 propriétaire qui révolutionnera votre approche du trading. Polyvalence unique Notre indicateur est spécialement conçu pour les utilisateurs qui préfèrent les formations de bou
TrendMaestro
Stefano Frisetti
5 (2)
note: this indicator is for METATRADER4, if you want the version for METATRADER5 this is the link: TRENDMAESTRO recognizes a new TREND in the bud, he never makes mistakes. The certainty of identifying a new TREND is priceless. DESCRIPTION TRENDMAESTRO identifies a new TREND in the bud, this indicator examines the volatility, volumes and momentum to identify the moment in which there is an explosion of one or more of these data and therefore the moment in which prices have strong probability of f
Actuellement 20% de réduction ! La meilleure solution pour tout débutant ou trader expert ! Ce logiciel de tableau de bord fonctionne sur 28 paires de devises. Il est basé sur 2 de nos principaux indicateurs (Advanced Currency Strength 28 et Advanced Currency Impulse). Il donne un excellent aperçu de l'ensemble du marché Forex. Il montre les valeurs de l'Advanced Currency Strength, la vitesse de mouvement des devises et les signaux pour 28 paires de devises dans tous les (9) délais. Imagine
Présentation de l'indicateur miraculeux Forex : Libérez la puissance du trading précis En avez-vous assez de chercher le meilleur indicateur Forex qui fournisse réellement des résultats exceptionnels sur tous les délais ? Ne cherchez plus ! L'indicateur miraculeux Forex est là pour révolutionner votre expérience de trading et propulser vos gains vers de nouveaux sommets. Basé sur une technologie de pointe et des années de développement minutieux, l'indicateur miraculeux Forex se positionne comme
ALERTE D'ACHAT ET DE VENTE MULTIDEVISES et MULTITIMEFRAME. AUTO TRAILING STOP ET RÉCOMPENSE DE RISQUE TAKEPROFIT ! L'INDICATEUR SCANNE ET ANALISE LE MARCHÉ POUR QUE VOUS N'AVEZ RIEN À FAIRE ! NÉGOCIEZ TOUTES VOS DEVISES SUR UN GRAPHIQUE !   Après l'achat veuillez laisser un commentaire, contactez-moi et je vous enverrai l'assistant commercial EA. L'indicateur utilise plusieurs oscillateurs et filtres associés pour trouver les meilleurs points d'entrée CONFIRMÉS afin que vous n'ayez pas à
Entry Points Pro
Yury Orlov
4.7 (225)
Indicateur supérieur pour MT4 fournissant des signaux précis pour entrer dans un trade sans repeindre ! Il peut être appliqué à tous les actifs financiers : forex, cryptocurrencies, métaux, actions, indices.  La version MT5 est ici Il fournira des signaux de trading assez précis et vous dira quand il est préférable d'ouvrir un trade et de le fermer. Regardez la vidéo (6:22) avec un exemple de traitement d'un seul signal qui a rapporté à l'indicateur ! La plupart des traders améliorent l
Trend Forecasting
Mohamed Hassan
5 (15)
Cet indicateur est très puissant lorsqu'il est combiné avec notre autre indicateur appelé Katana. Après l'achat, envoyez-nous un message et vous pourrez obtenir Katana GRATUITEMENT en BONUS  ! Le prix augmentera bientôt à 149$ ! Ne manquez pas le prix courant à 65$ ! L'indicateur de prévision de tendance est un outil très unique et simple qui est capable de prédire les mouvements futurs des prix en fonction des signaux générés par MACD. Cela vous aide à avoir une estimation des domaines dans
Quantum Breakout Indicator PRO
Bogdan Ion Puscasu
4.96 (26)
Présentation       Quantum Breakout PRO   , l'indicateur révolutionnaire MQL5 qui transforme la façon dont vous négociez les zones d'évasion ! Développé par une équipe de traders expérimentés avec une expérience de trading de plus de 13 ans,   Quantum Breakout PRO   est conçu pour propulser votre parcours de trading vers de nouveaux sommets grâce à sa stratégie de zone de discussion innovante et dynamique. Quantum Breakout Indicator vous donnera des flèches de signalisation sur les zones d
Le système PRO Renko est un système de trading très précis spécialement conçu pour le trading de graphiques RENKO. Il s'agit d'un système universel qui peut être appliqué à divers instruments de négociation. Le système neutralise efficacement ce qu'on appelle le bruit du marché en vous donnant accès à des signaux d'inversion précis. L'indicateur est très facile à utiliser et n'a qu'un seul paramètre responsable de la génération du signal. Vous pouvez facilement adapter l'outil à n'importe q
FX Power MT4 NG
Daniel Stein
5 (8)
Obtenez votre mise à jour quotidienne du marché avec des détails et des captures d'écran via notre Morning Briefing ici sur mql5 et sur Telegram ! FX Power MT4 NG est la nouvelle génération de notre très populaire indicateur de force des devises, FX Power. Et qu'est-ce que ce compteur de force de nouvelle génération offre ? Tout ce que vous avez aimé de l'original FX Power PLUS Analyse de la force de l'OR/XAU Des résultats de calcul encore plus précis Périodes d'analyse configurables individuel
Break and Retest
Mohamed Hassan
5 (2)
Break & Retest is unstoppable when combined with our other divergence indicator. After purchase, send us a message and you could get this  2nd indicator  for  FREE  as a  BONUS! ‍You can visually backtest Break & Retest to see how it behaved in the past!    Manual guide:   Click here $59  for the first 25 copies ( 7  left)! Next price is $120 .  After many months of hard work and dedication, we are extremely proud to present you our  Break and Retest price action indicator crea
ACTUELLEMENT 31% DE RÉDUCTION ! ! La meilleure solution pour tout débutant ou Expert Trader ! Cet indicateur est un outil de trading unique, de haute qualité et abordable car nous avons incorporé un certain nombre de caractéristiques exclusives et une formule secrète. Avec seulement UN graphique, il donne des alertes pour les 28 paires de devises. Imaginez comment votre trading s'améliorera parce que vous serez capable de repérer le point de déclenchement exact d'une nouvelle tendance ou d'
TrendDecoder Premium
Christophe, Pa Trouillas
5 (3)
Identifiez les ranges et les prochaines tendances fortes   |  Obtenez les premiers signaux et la force des tendances   |  Obtenez des TP clairs et RR favorable   |  Repérer les niveaux Fibo que le prix va tester Indicateur qui ne retrace pas, non retardé - idéal pour le trading manuel et automatisé - adapté à tous les actifs et à toutes les unités de temps Pour une durée limitée >>   -50% de réduction Après votre achat,   contactez-moi sur ce canal  pour obtenir les réglages recommandés. Version
L'indicateur d'inversion ADR vous montre en un coup d'œil où le prix se négocie actuellement par rapport à sa fourchette quotidienne moyenne normale. Vous recevrez des alertes instantanées par pop-up, e-mail ou push lorsque le prix dépasse sa fourchette moyenne et les niveaux supérieurs de votre choix afin que vous puissiez sauter rapidement dans les reculs et les inversions. L'indicateur trace des lignes horizontales sur le graphique aux extrêmes de la fourchette quotidienne moyenne ainsi que
Currency Strength Wizard est un indicateur très puissant qui vous offre une solution tout-en-un pour un trading réussi. L'indicateur calcule la puissance de telle ou telle paire de devises en utilisant les données de toutes les devises sur plusieurs périodes. Ces données sont représentées sous la forme d'un indice de devise facile à utiliser et de lignes électriques de devise que vous pouvez utiliser pour voir la puissance de telle ou telle devise. Tout ce dont vous avez besoin est d'attacher l'
Shepherd Harmonic Pattern
Abdullah Alrai
4.68 (59)
Cet indicateur détectera des motifs harmoniques dessinés sur le graphique par des méthodes manuelles et automatiques. Vous pouvez consulter le manuel d'utilisateur à partir de ce lien: Ajoutez votre avis et contactez-nous pour l'obtenir. Il existe une version gratuite pour essayer ce produit sur MT4. Vous pouvez l'utiliser pour détecter les motifs Gartley et Nenstar: https://www.mql5.com/en/market/product/30181 Vous pouvez acheter la version complète de MT4 à partir de: https://www.mql5.com/en/m
FX Volume
Daniel Stein
4.6 (35)
Obtenez votre mise à jour quotidienne du marché avec des détails et des captures d'écran via notre Morning Briefing ici sur mql5 et sur Telegram ! FX Volume est le PREMIER et SEUL indicateur de volume qui fournit un VRAI aperçu du sentiment du marché du point de vue d'un courtier. Il fournit des informations impressionnantes sur la façon dont les acteurs institutionnels du marché, comme les courtiers, sont positionnés sur le marché des changes, bien plus rapidement que les rapports COT. Voir c
Tout d'abord, il convient de souligner que ce système de trading est un indicateur non repainting, non redrawing et non lagging, ce qui le rend idéal pour le trading professionnel. Le "Système de Trading de Support et Résistance Intelligent" est un indicateur avancé conçu pour les traders novices et expérimentés. Il permet aux traders de bénéficier de précision et de confiance sur le marché du forex. Ce système complet combine plus de 7 stratégies, 10 indicateurs et diverses approches de trad
Plus de l'auteur
Trend Radar Chart Tracker
Natasha Diedericks
4 (1)
Easily track and trade with the trend using this indicator. Uses a circle and line to indicate the trend direction. Excellent for channels. Features alert function. Parameter TrendPeriod can be changed to your preference. How to use: Simply attach to any chart. Blue circle plus blue line cross below price = Buy. Red circle plus red line  cross above price = Sell. Best results when taking higher time frames into consideration before entering a trade. (Hint: Wait for the radar/circle to appear on
FREE
ZigZag Bullets
Natasha Diedericks
5 (1)
This indicator takes input from the ZigZag and ADX indicators, combined with a special trend algorithm. You also get a Moving Average on the chart to determine trend direction. Great for scalping. Perfect for channels. Features alert functions. BulletPeriod. Parameter TrendLinePeriod for the MA line. Change to your preference. Try 200. How to use: Simply attach to any chart. Sell on red bullets, with red MA line above price. Enter on bullets closest to this line. Buy on blue bullets, with blue
Trend Alligator
Natasha Diedericks
5 (1)
This indicator takes input from the Alligator indicator. Great for scalping. Great for identifying new trends. This indicator can be used on all time frames and pairs. Features alert functions. Parameters: Alerts JawsPeriod JawsShift TeethPeriod TeethShift LipsPeriod LipsShift How to use: Simply attach to any chart with default settings. Sell when all 3 red lines cross above white line. Buy when all 3 blue lines cross below white line. Best results when checking the higher time frames (3 or
Trend SR
Natasha Diedericks
This indicator takes input from Support and Resistance levels, combined with a special trend filter. Easily spot tops and bottoms, and trade with more confidence. Great for scalping or long-term trading. This indicator can be used on all time frames and pairs. Features alert function. No need to set up the indicator. How to use: Simply attach to any chart. Red histogram line color = Selling opportunities. Blue histogram line color = Buying opportunities. See pictures below. To spot highs/tops
SR Arrows
Natasha Diedericks
This indicator gives you arrows, two SR lines and a white trend line. Uses a special trend algorithm to plot the arrows, combined with support and resistance inputs. Perfect for channel trading. Features alert functions. Parameter TrendArrowPeriod. Parameter TrendLinePeriod. (Change to your preference) How to use: Simply attach to any chart with default settings. Zoom in the chart, to see the two blue SR lines and arrows more clearly. It is very important to wait for a new blue SR line to appea
This indicator gives you a modified version of three Moving Averages. Great for scalping. Does not feature any alerts, and is best used manually after confirming multi line displays. Settings: Period1  Period2 Period3 Period4 How to use: Simply attach to any chart with default settings. Buy when the 4 lines converge below the price. Sell when the 4 lines converge above the price. Take note of the slope of Period4. See example pictures below. Best results when looking at three or more time frame
This indicator displays a modified version of Moving Averages for multiple time frames: Current (TF indicator is attached to), M5, M15, M30, H1, H4, Daily, Weekly and Monthly. NB: Make sure to download currency history before testing and use. No need to set up the indicator. Features an audible alert function for the current chart's line. How to use: Simply attach to M5 chart. Hover over the lines to see the line's time frame. Buy when more than two MTF lines cross closely together below the pri
ZigZag Sniper
Natasha Diedericks
This indicator gives you a modified ZigZag, combined with a special algorithm. Great for scalping. Perfect for channel trading. Parameter TrendPeriod. Features alert functions.  How to use: Simply attach to any chart with default settings. Buy when the line crosses below the price, and blue arrow. Sell when the line crosses above the price, and red arrow. It helps to keep the audible alert set to true. Best results when checking two or more timeframes before entering trades. (See comment #1 for
This indicator gives you PSar crossings in the form of blue and yellow dots on the chart, as well as a Moving Average. Parameters: MAPeriod (Change to your preference) Alerts PSarStep PSarShift PSarMaximum How to use: Simply attach to any chart with default settings. Sell on yellow dots, with white MA line above price.  Buy on blue dots, with white MA line below price. Best results when checking the higher time frames before entering trades. Best results on Major Pairs, but can also be used on o
MTF PSar Trender
Natasha Diedericks
This indicator gives you the PSars for multiple time frames: M1, M5, M15, M30, H1, H4, Daily, Weekly, Monthly. Features Alert function for current Psar. Good results on M5. How to use: Download M1 history for testing. Hover over the different colors to see different timeframes. Simply attach to any chart. Take note of higher time frames before entering trades on lower time frames. (Zoom the H1/H4/Daily chart out completely) Sell when Multiple PSars cross above the price. Example: M1-M5-M15-M30-H
Mountains
Natasha Diedericks
Visual helper for spotting peaks and troughs. Alerts. PSar settings for trend direction determination. Great for scalping. How to use: Simply attach to any chart. To spot peaks and troughs, zoom chart out completely. Sell on red dots. Best results when red dot appears on 3 or more time frames. Buy on blue dots. Best results when blue dot appears on 3 or more time frames. If used on lower timeframes (M1, M5, M15, M30), please make sure to check higher timeframes. Or backtest and use as you see fi
Easily track how the price moves in a separate indicator window with this trend indicator. Great for scalping or long-term trading. Helps you find best entry points for your trades after reaching a certain level, and easily identify where you can exit your trades. This indicator can be used on all time frames and pairs. Features alert function. No need to set up the indicator. How to use: Simply attach to any chart. NB : Look to the extreme zones (oversold/overbought) when looking for new tra
Multi RSI Pro mt4
Natasha Diedericks
5 (1)
This indicator takes input from the RSI from multiple time frames (M/W/D/H4/H1), and presents the output on the main chart. Great for scalping. Features alerts for the current chart's TrendLine above or below price. TrendLine period setting. Multi RSI period settings. How to use: Simply attach to M5 (Scalping - zoom chart out completely on M5) or use on higher time frames' charts. Zoom chart out completely to get a better view of the chart. Hover over the lines to see the time frame applicable.
This indicator takes input from the ADX from multiple time frames (M/W/D/H4/H1), and presents the output on the main chart. Great for scalping. Features alert for current chart's ADX. TrendLine period setting. How to use: Simply attach to any chart. User can set the period for ADX(Monthly, Weekly, Daily, H4, H1,Current chart) Zoom chart out completely. Hover over the lines to see the time frame applicable. Buy when Multi ADX below price; also blue dots and white line below price. Sell when Mul
Price Trender mt4
Natasha Diedericks
This indicator uses a special algorithm to plot the 4 lines for trading. Great for scalping. Features alerts. Settings for trend filters. How to use: Simply attach to any chart with default settings. Buy when the three pink lines converge below the green line. Sell when the three pink lines converge above the green line. Best results when looking at three or more time frames, and the three blue lines have just converged below or above the green line. Use as you see fit for your strategy. Best r
This indicator takes input from the RSI, combined with a trend filter. Great for scalping. Does not feature any alerts and is best used manually. Settings: TrendFilterPeriod RSIPeriod Set these parameters to your preference. How to use: Attach to any chart with default settings. Can be used on any time frame. If used on lower time frames, check higher time frames too. Buy : - Wait for blue histo color to cross above level 50, then open buys. **Best results when checking the higher time frames to
Trend Histo mt4
Natasha Diedericks
This indicator uses 2 trend filters. Great for scalping. Features alerts Settings: TrendFilterPeriod1 TrendFilterPeriod2 How to use: Attach to any chart with default settings, or set to your preference. Can be used on any time frame. If used on lower time frames, check higher time frames too. Buy : - Blue histo color. Sell : - Red histo color. Or backtest and use as you see fit for your strategy. Best results on Major Pairs, but can also be used on other pairs (Metals, Minors). Important to no
Trend Chart mt4
Natasha Diedericks
Displays multiple trend indicators on the main chart. Great for scalping. Settings: LWMA SMA SSMA EMA ADX (red and blue dots), and PSar Alerts for ADX crosses. How to use: Can be used on any time frame.  Buy : - Blue dot first. - Then PSar and 3 MAs cross below price. **Best results when confirming the higher time frames too. Sell : - Red dot first. - Then PSar and 3 MAs cross above price. **Best results when confirming the higher time frames too. Or backtest and use as you see fit for your str
This indicator takes input from the RSI from multiple time frames (M/W/D/H4/H1/M30), and presents the output as lines above or below the price, on the main chart. Great for scalping. Features alerts for the current time frame's RSI (the Arrows). Settings: RSI period settings for M/W/D/H4/H1/M30/Current. (Set to your preference) PSar settings for trend determination; for current chart's time frame. How to use: Simply attach to M5 (Scalping - zoom chart out completely on M5) or use on higher time
Uses a trend filter to plot the lines and arrows. Great for scalping. Settings: TrendPeriod: change to your preference. Alerts. How to use: Can be used on any time frame. Attached to chart, and wait for arrow to appear on multiple timeframes. Buy : -  Blue arrow and blue line cross below price on multiple time frames; e.g., on D,W,M or H1,H4,Daily or M30,H1,H4 Sell : -  Yellow arrow and red line cross above price on multiple time frames; e.g., on D,W,M   or H1, H4, Daily or  M30,H1,H4 **Best r
Pro Trader mt4
Natasha Diedericks
This indicator takes input from the RSI and a trend filter, and presents the output in a separate indicator window as a histogram. Great for scalping. Settings: No need to set up the indicator. Features Alerts. How to use: Simply attach to any chart Zoom chart in to get a better view of the histo color. Buy:  Blue histo color on multiple timeframes. (e.g,. M30-H1-H4) Sell: Red histo color  across on multiple timeframes. Or backtest and use as you see fit for your strategy. Best results on Majo
PTT mt4
Natasha Diedericks
This indicator takes input from the RSI and a trend filter, and presents the output in a separate indicator window as a histogram. Great for scalping. Settings: TrendPeriod RSIPeriod Features Alerts. How to use: Simply attach to any chart Zoom chart in to get a better view of the histo color. Buy:  Blue histo color on multiple timeframes. (e.g,. M30-H1-H4) Sell: Red histo color  across on multiple timeframes. Or backtest and use as you see fit for your strategy. Best results on Major Pairs, bu
SLT mt4
Natasha Diedericks
This indicator takes input from a trend filter and 2 oscillators, and presents the output in a separate indicator window as 2 lines and arrows. Great for scalping. Settings: No need to set up the indicator. Features Alerts. How to use: Simply attach to any chart Zoom chart in to get a better view of the lines. Buy:  Blue arrow. Best results when entering buys above the 0.00 level, and confirming on higher timeframes too. Sell: Red arrow. Best results when entering sells below the 0.00 level,   a
ADT mt4
Natasha Diedericks
This indicator takes input from Accumulation/Distribution and a trend filter, and presents the output in a separate indicator window as a histogram. Great for scalping. Settings: TrendPeriod Features Alerts. How to use: Simply attach to any chart with default setting, or set the TrendPeriod to your preference. Zoom chart in to get a better view of the histo color. Buy:  Blue histo color on multiple timeframes. (e.g., M30-H1-H4-D) Sell: Red histo color  on multiple timeframes. Or backtest and u
ADX Trend mt4
Natasha Diedericks
This indicator takes input from the ADX, and presents the output in a separate indicator window as a histogram. Great for scalping. Settings: ADXPeriod Features Alerts. How to use: Simply attach to any chart with default setting, or set the ADXPeriod to your preference. Zoom chart in to get a better view of the histo color. Buy:  Blue histo color on multiple timeframes. (e.g., M30-H1-H4-D) Sell: Red histo color  on multiple timeframes. Or backtest and use as you see fit for your strategy. Best
OBV Trend mt4
Natasha Diedericks
This indicator takes input from the OBV and a trend filter, and presents the output in a separate indicator window as a histogram. Great for scalping. Settings: TrendPeriod Features Alerts. How to use: Simply attach to any chart with default setting, or set the TrendPeriod to your preference. Zoom chart in to get a better view of the histo color. Buy:  Blue histo color on multiple timeframes. (e.g., M15-M30-H1-H4) Sell: Red histo color  on multiple timeframes. Or backtest and use as you see fi
Use this indicator to help determine when to open buys or sells based on the slope and direction of the channel. Excellent for scalping. Settings: TrendPeriod. Deviation. ChannelPeriod. Features Alerts. How to use: Simply attach to any chart. To use on lower timeframes (M1,M5,M30), you'll need to start setting the Deviation from 0.01 and increase it if needed. If used on lower timeframes  ( M1,M5,M30,H1), confirm on higher timeframes (H4,D,W) before entering trades. H1: Set Deviation to 0.5. H4:
Only Line mt4
Natasha Diedericks
Use this indicator to help determine when to open buys or sells based on the color of the line. Excellent for scalping. Settings: Deviation. TrendPeriod. Features Alerts. How to use: Simply attach to any chart with default settings. When used on lower timeframes (M1,M5,M30,H1), confirm on higher timeframes.  Buy:  Blue line below price. Best results when line is blue on multiple timeframes. Sell: Red line above price. Best results when line is red on multiple timeframes. Or change settin
This indicator uses a special algorithm to plot the 4 lines for trading. Great for scalping. Does not feature any alerts and is best used manually after confirming the line displays. No need to set up the indicator. How to use: Attach to any chart. Can be used on any time frame. If used on lower time frames, check higher time frames for confirmation. Buy : - Wait for green and white lines to be above the level 50 dotted line, then open buys. - Buy when the green line crosses below the white line
Trend Sniper mt4
Natasha Diedericks
This indicator takes input from a trend filter to determine best entries for trades, on the crossings of the two lines. Excellent for scalping. A simple indicator that doesn't need setting up. Does not feature any alerts. How to use: Simply attach to any chart. When used on lower timeframes, also confirm on higher timeframes.  Buy:  Blue line moves to Level-0 yellow dotted line. Best results when confirming this on multiple timeframes, e.g., Daily-Weekly-Monthly. Sell: Red line moves to Level-0
Filtrer:
Aucun avis
Répondre à l'avis
Version 1.8 2022.09.01
Buffer update.
PriceLine update.
Version 1.7 2022.06.15
Issue with line display updated.
Live performance review and update.
Version 1.6 2022.06.14
PriceLine input signal update.
Performance update.
Version 1.5 2022.06.07
Buffer update.
Golden line becomes prominent on converge of aqua, green and golden line, when blue trend line above or below.
Version 1.4 2022.05.30
Added aqua Sniper line to detect earlier opportunities.
Version 1.3 2022.05.25
Line color update.
Input signal update.
Version 1.2 2022.05.12
Added Trend line.
Version 1.1 2022.05.12
File name change.
Labels' name change.
Color update.