• Aperçu
  • Avis (1)
  • Commentaires (2)
  • Nouveautés

Beginning

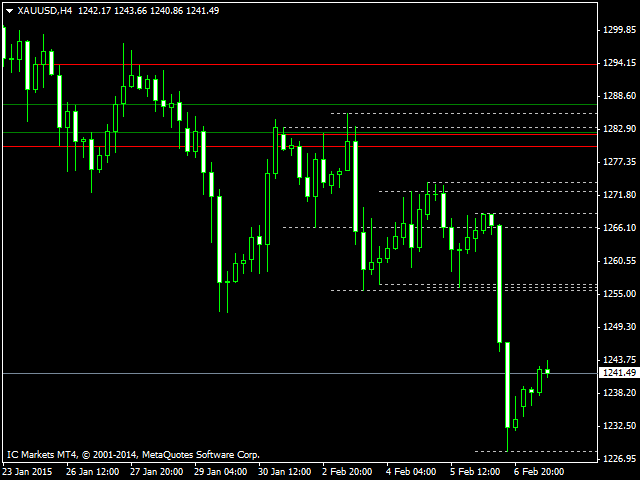
The indicator builds levels from beginning of a week or a month, or according to local Highs and Lows.

These levels are meant for detection of strong support and resistance levels on a chart.

Most big players of the market are guided by particularly these data: opening of the week or opening of the month.

Breakout of one or several Highs and price consolidation on these levels suggest that market intends to grow.

Breakout of Lows and price consolidation bears evidence of market's intention to move down.

The idea of this indicator belongs to Ilgiz Kamaev.

Parameters:

  • Day number - Number of days for displaying local Highs and Lows.
  • Day level color - Color of day levels
  • Width Day line - Width of day lines
  • Style Day line - Style of day lines
  • Week number - Number of weeks for week levels building
  • Week level color - Color of week levels
  • Width Week line - Width of week lines
  • Style Week line - Style of week lines
  • Month number - Number of months for month levels building
  • Month level color - Color of month levels
  • Width Month line - Width of moth lines
  • Style Month line - Style of month lines
Produits recommandés
VR Cub
Vladimir Pastushak
VR Cub est un indicateur permettant d'obtenir des points d'entrée de haute qualité. L'indicateur a été développé pour faciliter les calculs mathématiques et simplifier la recherche de points d'entrée dans un poste. La stratégie de trading pour laquelle l'indicateur a été rédigé prouve son efficacité depuis de nombreuses années. La simplicité de la stratégie de trading est son grand avantage, qui permet même aux traders débutants de négocier avec succès avec elle. VR Cub calcule les points d'ouve
Infinity Trend Pro
Yaroslav Varankin
1 (1)
This is a trend indicator without redrawing Developed instead of the binary options strategy (by the color of the Martingale candlestick) Also works well in forex trading When to open trades (binary options) A signal will appear in the place with a candle signaling the current candle It is recommended to open a deal for one candle of the current timeframe M1 and M5 When a blue dot appears, open a deal up When a red dot appears, open a trade down. How to open trades on Forex. When a signal is rec
Owl smart levels
Sergey Ermolov
4.63 (54)
Version MT5  |  FAQ L' indicateur Owl Smart Levels   est un système de trading complet au sein d'un seul indicateur qui comprend des outils d'analyse de marché populaires tels que   les fractales avancées de Bill Williams , Valable ZigZag qui construit   la structure d'onde correcte   du marché et   les niveaux de Fibonacci   qui marquent les niveaux exacts d'entrée. sur le marché et les endroits où prendre des bénéfices. Description détaillée de la stratégie Mode d'emploi de l'indicateur Conse
ZhiBiCCI MT4
Qiuyang Zheng
5 (1)
[ZhiBiCCI] indicators are suitable for all cycle use, and are also suitable for all market varieties. [ZhiBiCCI] Green solid line is a reversal of bullish divergence. The green dotted line is a classic bullish divergence. [ZhiBiCCI] The solid line to the red is a reverse bearish divergence. The red dotted line is a classical bearish divergence. [ZhiBiCCI] can be set in the parameters (Alert, Send mail, Send notification), set to (true) to send instant signals to the alarm window, email, in
Trend Master Chart MT4
Frederic Jacques Collomb
Trend Master Chart est l'indicateur de tendance qu'il vous faut. Il se superpose au graphique et utilise un code couleur pour définir les différentes tendances/impulsions du marché. Il utilise un algorithme qui combine deux moyennes mobiles et différents oscillateurs. Les périodes de ces trois élément sont modifiables. Il fonctionne sur n'importe quel time-frame et n'importe quelle Pair. D'un coup d’œil vous pourrez identifier une tendance haussière ou baissière et les différents points d'entrée
FREE
Sto Signal AM
Andriy Matviyevs'kyy
This indicator displays Stochastic osc signals on the price chart and allows the user to receive notifications of such signals. The Stochastic indicator is a classic and proven indicator of the technical analysis of the markets. Despite its age, it is still relevant today. Depending on the settings, the indicator allows you to work effectively on various TFs and any markets. Signals are given on fully formed bars and are not redrawn. Custom Parameters: Stochastic_Price (0-1) - The applied pric
FREE
Trend Ray
Andriy Sydoruk
The indicator shows the potential trend direction by cyclical-wave dependence. Thus, all the rays of the intersection will be optimal rays, in the direction of which the price is expected to move, taking into account the indicator period. Rays can be used as a direction for potential market movement. But we must not forget that the approach must be comprehensive, the indicator signals require additional information to enter the market.
PABT Pattern Indicator - it's classical system one of the signal patterns. Indicator logic - the Hi & Lo of the bar is fully within the range of the preceding bar, look to trade them as pullback in trend. In the way if indicator found PABT pattern it's drawing two lines and arrow what showing trend way.  - First line - it's entry point and drawing at: 1. On the high of signal bar or on middle of the signal bar (depending from indicator mode) for buy; 2. On the low of signal bar or on middle of t
L'indicateur "Two Moving Average Crossover" pour MetaTrader 4 (MT4) est un outil d'analyse technique qui affiche deux moyennes mobiles et notifie lorsque les moyennes mobiles se croisent. L'indicateur calcule et trace deux moyennes mobiles, dont l'une est plus rapide et l'autre plus lente. Lorsque la moyenne mobile la plus rapide passe au-dessus de la moyenne mobile la plus lente, cela est considéré comme un signal haussier, indiquant un renversement de tendance potentiel ou le début d'une nouv
L'indicateur calcule et trace automatiquement les niveaux de support et de résistance de Fibonacci - l'un des outils les plus efficaces pour l'analyse de marché. Le calcul utilise les données de prix moyennes pour la période et la période sélectionnées. Le minimum et le maximum pour cette période sont considérés comme le début et la fin du mouvement. Les niveaux de Fibonacci vous permettent de voir des points de référence potentiels, autour desquels le mouvement des prix peut ralentir ou s'inver
Lyne
Maksim Kalachev
About the Lyne indicator Lyne is a Metatrader 4 (MT4) indicator, the essence of which is to transform the accumulated historical data. The Lyne indicator makes it possible to detect various features and patterns in price dynamics that are invisible to the naked eye. Based on this information, traders can anticipate further price movement and adjust their strategy accordingly. This indicator has proven itself in the scalping strategy. The indicator works without repainting.
Trendiness Index
Libertas LLC
5 (3)
"The trend is your friend" is one of the best known sayings in investing, because capturing large trendy price movements can be extremely profitable. However, trading with the trend is often easier said than done, because many indicators are based on price reversals not trends. These aren't very effective at identifying trendy periods, or predicting whether trends will continue. We developed the Trendiness Index to help address this problem by indicating the strength and direction of price trend
Laser Trend
Nicolas Zouein
The trend is your friend! This is what this indicator is all about. Follow this famous saying and be safe. Characteristics: Buy/Sell signals fixed on the close of a bar. Works on all symbols and all timeframes. Clear visual market trend laser line, Buy/Sell signal arrows, market strength meter, TP1 & TP2 boxes. Visual signals when to enter, when to exit the market. No repainting. Compatible with Flexible EA for trading automation. (Ask for a free set file optimized to perform 2010-2018) Para
Super Gator
Agustinus Biotamalo Lumbantoruan
This indi shows the following 1. Supertrend 2. Alligator (Not a regular alligator) 3. ZigZag 4. Moving Average 5. Trend Continuation/Mini correction Signal (plotted in X) (See screenshots in green background color 6. Early Signal Detection (See screenshots in green background color) You may treat Alligator as the lagging indicator The leading indicator is the supertrend. The zig zag is based on the leading indicator where it gets plotted when the leading indicator got broken to the opposite.
The indicator displays the data of the Stochastic oscillator from a higher timeframe on the chart. The main and signal lines are displayed in a separate window. The stepped response is not smoothed. The indicator is useful for practicing "manual" forex trading strategies, which use the data from several screens with different timeframes of a single symbol. The indicator uses the settings that are identical to the standard ones, and a drop-down list for selecting the timeframe. Indicator Parame
Alpha Trend
Evgeny Belyaev
3.33 (3)
Alpha Trend is a trend indicator for the MetaTrader 4 platform; it has been developed by a group of professional traders. The Alpha Trend indicator finds the most probable tendency reversal points, which allows making trades at the very beginning of a trend. This indicator features notifications, which are generated whenever a new signal appears (alert, email, push-notification). This allows you to open a position in a timely manner. Alpha Trend does not redraw, which makes it possible to evalua
Noize Absorption Index MT4
Ekaterina Saltykova
5 (1)
Noize Absorption Index - is the manual trading system that measures the difference of pressure between bears forces and bulls forces. Green line - is a noize free index that showing curent situation. Zero value of index shows totally choppy/flat market.Values above zero level shows how powerfull bullish wave is and values below zero measures bearish forces.Up arrow appears on bearish market when it's ready to reverse, dn arrow appears on weak bullish market, as a result of reverse expectation. S
The indicator detects and displays 3 Drives harmonic pattern (see the screenshot). The pattern is plotted by the extreme values of the ZigZag indicator (included in the resources, no need to install). After detecting the pattern, the indicator notifies of that by a pop-up window, a mobile notification and an email. The indicator highlights the process of the pattern formation and not just the complete pattern. In the former case, it is displayed in the contour triangles. After the pattern is com
Gvs Undefeated Trend   indicator is designed for trend and signal trading. This indicator generates trend signals.  It uses many algorithms and indicators to generate this signal. It tries to generate a signal from the points with the highest trend potential. This indicator is a complete trading product. This indicator does not need any additional indicators.  You can only trade with this indicator. The generated signals are displayed on the graphical screen.  Thanks to the alert features you ca
Support and Resistance is a very important reference for trading.  This indicator provides customized support and resistance levels, automatic draw line and play music functions.  In addition to the custom RS, the default RS includes Pivot Point, Fibonacci, integer Price, MA, Bollinger Bands. Pivot Point is a resistance and support system. It has been widely used at froex,stocks, futures, treasury bonds and indexes. It is an effective support resistance analysis system. Fibonacci also known as t
Title : UT_Bot - ATR-Based Trading Indicator Introduction : Discover the power of "UT_Bot," the ultimate trading indicator that leverages the Average True Range (ATR) to provide unparalleled accuracy in your trading decisions. If you're seeking a more reliable alternative to the Super Trend indicator, look no further. UT_Bot is your key to precision trading. Key Features : ATR-Powered Precision: UT_Bot uses the ATR to deliver accurate signals that adapt to market volatility. Enhanced Trend Detec
Bermaui Bands
Muhammad Elbermawi
4.94 (89)
Bermaui Bands (BB) est un outil d'analyse technique qui permet de filtrer entre les variations de prix et les tendances. L'idée derrière cet indicateur peut être expliquée dans les étapes suivantes : Calculez la déviation standard comme un oscillateur qui se déplace entre 0 et 100. Je l'appellerai pour cent de déviation de Bermaui (BD %). Si « % BD » est proche de zéro, la volatilité est à son extrême. De plus, si "BD %" est proche de 100 alors la volatilité est très faible. Une volatilité élevé
The Sextet Scalper Pro  is an MT4 indicator that gives signals when new waves are starting in a trend. The trends are calculated using the original " The Sextet " indicator method. You get a free EA to trade with The Sextet Scalper Pro: Free EA . Default settings were optimized on GBPUSD H1 from 2017. EA could be tested on free demo version of The Sextet Scalper Pro, before purchase. Key Features: Uses The Sextet Trend Detection Method which is already a good strategy in itself for detecting l
Strong Retracement Points Pro demo edition! SRP (Strong Retracement/Reversal Points) is a powerful and unique support and resistance indicator. It displays the closest important levels which we expect the price retracement/reversal! If all level are broken from one side, it recalculates and draws new support and resistance levels, so the levels might be valid for several days depending on the market! If you are still hesitating to start using this wonderful tool, you can check this link to see h
Daily Candle Predictor est un indicateur qui prédit le cours de clôture d'une bougie. L'indicateur est principalement destiné à être utilisé sur les graphiques D1. Cet indicateur convient à la fois au trading forex traditionnel et au trading d'options binaires. L'indicateur peut être utilisé comme un système de trading autonome, ou il peut servir de complément à votre système de trading existant. Cet indicateur analyse la bougie actuelle, calcule certains facteurs de force à l'intérieur du corps
Master Scalping M1 est un indicateur innovant qui utilise un algorithme pour déterminer rapidement et avec précision la tendance. L'indicateur calcule le temps d'ouverture et de fermeture des positions, les algorithmes de l'indicateur vous permettent de trouver les moments idéaux pour entrer dans une transaction (acheter ou vendre un actif), ce qui augmente le succès des transactions pour la plupart des commerçants. Avantages de l'indicateur : Facile à utiliser, ne surcharge pas le graphique ave
Fourteen plus nine TD Sequential
MOHAMMED IMAD HUSSEIN BASSEE
Fourteen plus nine What is it for? Applying Tom DeMark’s TD Sequential serves the purpose of identifying a price point where an uptrend or a downtrend exhausts itself and reverses. . What are the main components of TD Sequential? TD Sequential has two parts – TD Setup and TD Countdown. The first phase of TD Sequential starts with a TD Setup and is completed with a 9 count. When the 9 count is completed, it is at that point, a price pause, price pullback, or reversal is likely. It is also at tha
For sure, this indicator has become very popular amongst traders. Through coding this indicator will give you the most accurate levels possible for your trading analysis. We have also added in the ability for you to receive alerts when the price breaks above or below a Support or Resistance lines! HOW TO USE The red rectangles represent your resistance/supply zone. The green rectangles represent your support/demand zone.  BONUS FEATURES We coded this indicator with the ability to switch between
The indicator allows you to trade binary options. The recommended time frame is М1 and the expiration time is 1,2,3 minutes. The indicator suitable for auto and manual trading. A possible signal is specified as a arrows above/under a candle. You should wait until the candle closes! Arrows are not re-painted Trade sessions: TOKYO section (Half-end) Currency pairs: USD/JPY Working time frame: M1 Expiration time: 1,2,3 minutes. The indicator also shows good results when using the martingale strateg
FREE
If you are good at trading at levels This indicator is all you need levels to manage your trades Market is usually follow current trend when break out some levels or reverse Trade at the Institutional traders level with the best supply and demand zone indicator available in MT4 and MT5 The Secret Profit Levels Signals indicator for MT4 is a complete trading system that provides traders with the entry price and 2 take profit levels. Technical analysts use support and resistance levels to iden
Les acheteurs de ce produit ont également acheté
Gann Made Easy
Oleg Rodin
4.96 (47)
Gann Made Easy est un système de trading Forex professionnel et facile à utiliser qui est basé sur les meilleurs principes de trading en utilisant la théorie de mr. WD Gann. L'indicateur fournit des signaux d'ACHAT et de VENTE précis, y compris les niveaux Stop Loss et Take Profit. Vous pouvez échanger même en déplacement en utilisant les notifications PUSH. S'il vous plaît contactez-moi après l'achat! Je partagerai avec vous mes astuces de trading et d'excellents indicateurs bonus gratuitement!
Atomic Analyst
Issam Kassas
5 (1)
Tout d'abord, il convient de souligner que cet indicateur de trading n'est ni repainting, ni redrawing et ne présente aucun délai, ce qui le rend idéal à la fois pour le trading manuel et automatisé. L'Analyste Atomique est un indicateur d'action sur les prix PA qui utilise la force et le momentum du prix pour trouver un meilleur avantage sur le marché. Équipé de filtres avancés qui aident à éliminer les bruits et les faux signaux, et à augmenter le potentiel de trading. En utilisant plusieur
ACTUELLEMENT 26% DE RÉDUCTION La meilleure solution pour tout débutant ou trader expert ! Cet indicateur est un outil de trading unique, de haute qualité et abordable car nous avons incorporé un certain nombre de caractéristiques exclusives et une nouvelle formule. Avec seulement UN graphique, vous pouvez lire la force de la devise pour 28 paires Forex ! Imaginez comment votre trading va s'améliorer parce que vous êtes capable de repérer le point de déclenchement exact d'une nouvelle tendan
Tout d'abord, il convient de souligner que cet outil de trading est un indicateur non repeint, non redessiné et non retardé, ce qui le rend idéal pour le trading professionnel. L'indicateur Smart Price Action Concepts est un outil très puissant à la fois pour les nouveaux et les traders expérimentés. Il regroupe plus de 20 indicateurs utiles en un seul, combinant des idées de trading avancées telles que l'analyse du trader Inner Circle et les stratégies de trading Smart Money Concepts. Cet in
Scalper Vault
Oleg Rodin
5 (27)
Scalper Vault est un système de scalpage professionnel qui vous fournit tout ce dont vous avez besoin pour un scalpage réussi. Cet indicateur est un système de trading complet qui peut être utilisé par les traders de forex et d'options binaires. Le délai recommandé est M5. Le système vous fournit des signaux fléchés précis dans le sens de la tendance. Il vous fournit également des signaux supérieurs et inférieurs et des niveaux de marché Gann. Les indicateurs fournissent tous les types d'alertes
TPSproTREND PrO
Roman Podpora
5 (15)
TPSpro TRENDPRO  - is a trend indicator that automatically analyzes the market and provides information about the trend and each of its changes, as well as giving signals for entering trades without redrawing! The indicator uses each candle, analyzing them separately. referring to different impulses - up or down impulse. Exact entry points into transactions for currencies, crypto, metals, stocks, indices!  -  Version MT5               DETAILED DESCRIPTION        /       TRADING SETUPS           
Trend Screener
STE S.S.COMPANY
4.83 (86)
Indicateur de tendance, solution unique révolutionnaire pour le trading et le filtrage des tendances avec toutes les fonctionnalités de tendance importantes intégrées dans un seul outil ! Il s'agit d'un indicateur multi-période et multi-devises 100 % non repeint qui peut être utilisé sur tous les symboles/instruments : forex, matières premières, crypto-monnaies, indices et actions. Trend Screener est un indicateur de suivi de tendance efficace qui fournit des signaux de tendance fléchés avec des
Actuellement 20% de réduction ! La meilleure solution pour tout débutant ou trader expert ! Ce logiciel de tableau de bord fonctionne sur 28 paires de devises. Il est basé sur 2 de nos principaux indicateurs (Advanced Currency Strength 28 et Advanced Currency Impulse). Il donne un excellent aperçu de l'ensemble du marché Forex. Il montre les valeurs de l'Advanced Currency Strength, la vitesse de mouvement des devises et les signaux pour 28 paires de devises dans tous les (9) délais. Imagine
Scalper Inside PRO
Alexey Minkov
4.75 (55)
SALE NOW! Limited Time Offer! An exclusive indicator that utilizes an innovative algorithm to swiftly and accurately determine the market trend. The indicator automatically calculates opening, closing, and profit levels, providing detailed trading statistics. With these features, you can choose the most appropriate trading instrument for the current market conditions. Additionally, you can easily integrate your own arrow indicators into Scalper Inside Pro to quickly evaluate their statistics and
Le profit de la structure du marché change à mesure que le prix s'inverse et recule. L'indicateur d'alerte d'inversion de la structure du marché identifie le moment où une tendance ou un mouvement de prix approche de l'épuisement et est prêt à s'inverser. Il vous avertit des changements dans la structure du marché qui se produisent généralement lorsqu'un renversement ou un recul majeur est sur le point de se produire. L'indicateur identifie initialement les cassures et la dynamique des prix,
TPSpro RFI Levels
Roman Podpora
5 (13)
A key element in trading is zones or levels from which decisions to buy or sell a trading instrument are made. Despite attempts by major players to conceal their presence in the market, they inevitably leave traces. Our task was to learn how to identify these traces and interpret them correctly. Reversal First Impulse levels (RFI)   -  Version MT5                INSTRUCTIONS                 RUS                 ENG                                       R ecommended to use with an indicator   -  
Présentation       Quantum Trend Sniper Indicator   , l'indicateur révolutionnaire MQL5 qui transforme la façon dont vous identifiez et négociez les inversions de tendance ! Développé par une équipe de traders expérimentés avec une expérience commerciale de plus de 13 ans,       Indicateur Quantum Trend Sniper       est conçu pour propulser votre parcours de trading vers de nouveaux sommets grâce à sa manière innovante d'identifier les inversions de tendance avec une précision extrêmement élevée
Quantum Breakout Indicator PRO
Bogdan Ion Puscasu
4.96 (26)
Présentation       Quantum Breakout PRO   , l'indicateur révolutionnaire MQL5 qui transforme la façon dont vous négociez les zones d'évasion ! Développé par une équipe de traders expérimentés avec une expérience de trading de plus de 13 ans,   Quantum Breakout PRO   est conçu pour propulser votre parcours de trading vers de nouveaux sommets grâce à sa stratégie de zone de discussion innovante et dynamique. Quantum Breakout Indicator vous donnera des flèches de signalisation sur les zones d
Advanced Supply Demand
Bernhard Schweigert
4.92 (310)
CURRENTLY 26% OFF !! Best Solution for any Newbie or Expert Trader! This indicator is a unique, high quality and affordable trading tool because we have incorporated a number of proprietary features and a new formula. With this update, you will be able to show double timeframe zones. You will not only be able to show a higher TF but to show both, the chart TF, PLUS the higher TF: SHOWING NESTED ZONES. All Supply Demand traders will love it. :) Important Information Revealed Maximize the potenti
Découvrez le secret pour réussir le trading Forex avec notre indicateur MT4 personnalisé! Vous êtes-vous déjà demandé comment réussir sur le marché du Forex, gagnant régulièrement des bénéfices tout en minimisant les risques? Voici la réponse que vous avez recherchée! Permettez-nous d'introduire notre indicateur MT4 propriétaire qui révolutionnera votre approche du trading. Polyvalence unique Notre indicateur est spécialement conçu pour les utilisateurs qui préfèrent les formations de bou
Présentation de l'indicateur miraculeux Forex : Libérez la puissance du trading précis En avez-vous assez de chercher le meilleur indicateur Forex qui fournisse réellement des résultats exceptionnels sur tous les délais ? Ne cherchez plus ! L'indicateur miraculeux Forex est là pour révolutionner votre expérience de trading et propulser vos gains vers de nouveaux sommets. Basé sur une technologie de pointe et des années de développement minutieux, l'indicateur miraculeux Forex se positionne comme
Break and Retest
Mohamed Hassan
5 (2)
Break & Retest is unstoppable when combined with our other divergence indicator. After purchase, send us a message and you could get this  2nd indicator  for  FREE  as a  BONUS! ‍You can visually backtest Break & Retest to see how it behaved in the past!    Manual guide:   Click here $59  for the first 25 copies ( 4  left)! Next price is $120 .  After many months of hard work and dedication, we are extremely proud to present you our  Break and Retest price action indicator crea
Entry Points Pro
Yury Orlov
4.7 (225)
Indicateur supérieur pour MT4 fournissant des signaux précis pour entrer dans un trade sans repeindre ! Il peut être appliqué à tous les actifs financiers : forex, cryptocurrencies, métaux, actions, indices.  La version MT5 est ici Il fournira des signaux de trading assez précis et vous dira quand il est préférable d'ouvrir un trade et de le fermer. Regardez la vidéo (6:22) avec un exemple de traitement d'un seul signal qui a rapporté à l'indicateur ! La plupart des traders améliorent l
Currency Strength Wizard est un indicateur très puissant qui vous offre une solution tout-en-un pour un trading réussi. L'indicateur calcule la puissance de telle ou telle paire de devises en utilisant les données de toutes les devises sur plusieurs périodes. Ces données sont représentées sous la forme d'un indice de devise facile à utiliser et de lignes électriques de devise que vous pouvez utiliser pour voir la puissance de telle ou telle devise. Tout ce dont vous avez besoin est d'attacher l'
TrendMaestro
Stefano Frisetti
5 (2)
note: this indicator is for METATRADER4, if you want the version for METATRADER5 this is the link: TRENDMAESTRO recognizes a new TREND in the bud, he never makes mistakes. The certainty of identifying a new TREND is priceless. DESCRIPTION TRENDMAESTRO identifies a new TREND in the bud, this indicator examines the volatility, volumes and momentum to identify the moment in which there is an explosion of one or more of these data and therefore the moment in which prices have strong probability of f
TrendDecoder Premium
Christophe, Pa Trouillas
5 (3)
Identifiez les ranges et les prochaines tendances fortes   |  Obtenez les premiers signaux et la force des tendances   |  Obtenez des TP clairs et RR favorable   |  Repérer les niveaux Fibo que le prix va tester Indicateur qui ne retrace pas, non retardé - idéal pour le trading manuel et automatisé - adapté à tous les actifs et à toutes les unités de temps Pour une durée limitée >>   -50% de réduction Après votre achat,   contactez-moi sur ce canal  pour obtenir les réglages recommandés. Version
ALERTE D'ACHAT ET DE VENTE MULTIDEVISES et MULTITIMEFRAME. AUTO TRAILING STOP ET RÉCOMPENSE DE RISQUE TAKEPROFIT ! L'INDICATEUR SCANNE ET ANALISE LE MARCHÉ POUR QUE VOUS N'AVEZ RIEN À FAIRE ! NÉGOCIEZ TOUTES VOS DEVISES SUR UN GRAPHIQUE !   Après l'achat veuillez laisser un commentaire, contactez-moi et je vous enverrai l'assistant commercial EA. L'indicateur utilise plusieurs oscillateurs et filtres associés pour trouver les meilleurs points d'entrée CONFIRMÉS afin que vous n'ayez pas à
FX Power MT4 NG
Daniel Stein
5 (8)
Obtenez votre mise à jour quotidienne du marché avec des détails et des captures d'écran via notre Morning Briefing ici sur mql5 et sur Telegram ! FX Power MT4 NG est la nouvelle génération de notre très populaire indicateur de force des devises, FX Power. Et qu'est-ce que ce compteur de force de nouvelle génération offre ? Tout ce que vous avez aimé de l'original FX Power PLUS Analyse de la force de l'OR/XAU Des résultats de calcul encore plus précis Périodes d'analyse configurables individuel
Trend Forecasting
Mohamed Hassan
5 (15)
Cet indicateur est très puissant lorsqu'il est combiné avec notre autre indicateur appelé Katana. Après l'achat, envoyez-nous un message et vous pourrez obtenir Katana GRATUITEMENT en BONUS  ! Le prix augmentera bientôt à 149$ ! Ne manquez pas le prix courant à 65$ ! L'indicateur de prévision de tendance est un outil très unique et simple qui est capable de prédire les mouvements futurs des prix en fonction des signaux générés par MACD. Cela vous aide à avoir une estimation des domaines dans
Price Action Entry Alerts
Stephen Sanjeeve Sahayam
5 (3)
Cet indicateur examine chaque barre pour la pression d'achat ou de vente et identifie 4 types de modèles de bougies avec le volume le plus élevé. Ces bougies sont ensuite filtrées à l'aide de plusieurs filtres linéaires pour afficher les signaux d'achat ou de vente. Les signaux fonctionnent mieux, en conjonction avec une direction temporelle plus élevée et lorsqu'ils sont négociés pendant les heures de volume élevé. Tous les filtres sont personnalisables et fonctionnent indépendamment. Peut aff
ACTUELLEMENT 31% DE RÉDUCTION ! ! La meilleure solution pour tout débutant ou Expert Trader ! Cet indicateur est un outil de trading unique, de haute qualité et abordable car nous avons incorporé un certain nombre de caractéristiques exclusives et une formule secrète. Avec seulement UN graphique, il donne des alertes pour les 28 paires de devises. Imaginez comment votre trading s'améliorera parce que vous serez capable de repérer le point de déclenchement exact d'une nouvelle tendance ou d'
FX Volume
Daniel Stein
4.6 (35)
Obtenez votre mise à jour quotidienne du marché avec des détails et des captures d'écran via notre Morning Briefing ici sur mql5 et sur Telegram ! FX Volume est le PREMIER et SEUL indicateur de volume qui fournit un VRAI aperçu du sentiment du marché du point de vue d'un courtier. Il fournit des informations impressionnantes sur la façon dont les acteurs institutionnels du marché, comme les courtiers, sont positionnés sur le marché des changes, bien plus rapidement que les rapports COT. Voir c
Up down v6T
Guner Koca
5 (1)
Thise indicator is up down v6  comes with tradingwiev version. purchased people, after installed on terminal ,contact me on mql5  to get BONUS  TradingView version. up-down indicator is no repaint and works all pairs and lower than weekly time frames charts. it is suitable also 1 m charts for all pairs. and hold long way to signal. dont gives too many signals. when red histogram cross trigger line that is up signal.and price probably will down when blue histogram cross trigger line that is dow
Dessine automatiquement les niveaux de support et de résistance PLUS les écarts des bougies de propulsion sur votre graphique, afin que vous puissiez voir où le prix est susceptible de se diriger ensuite et/ou de s'inverser potentiellement. Cet indicateur est conçu pour être utilisé dans le cadre de la méthodologie de trading de position enseignée sur mon site web (The Market Structure Trader) et affiche des informations clés pour le ciblage et les entrées potentielles. L'indicateur comport
How to use Pair Trading Station Pair Trading Station is recommended for H1 time frame and you can use it for any currency pairs. To generate buy and sell signal, follow few steps below to apply Pair Trading Station to your MetaTrader terminal. When you load Pair Trading Station on your chart, Pair Trading station will assess available historical data in your MetaTrader platforms for each currency pair. On your chart, the amount of historical data available will be displayed for each currency pai
Plus de l'auteur
OsMA Arrow MTF
Pavel Shutovskiy
3.92 (12)
The indicator displays crossing zero level by Moving Average of Oscillator (OsMA) in the form of arrows. The this is a multi-timeframe indicator, and it displays signals from other timeframes. The indicator notifies about a signal by means of a pop-up Alert window, or sending notification to e-mail. Parameters Time-frame - select timeframe to show indicator signals. Fast EMA Period - fast EMA. This is an exponential moving average from a price with a short period. Slow EMA Period - slow EMA. T
FREE
ADX arrow
Pavel Shutovskiy
5 (2)
ADX arrow The indicator displays crossings of the ADX indicator (Average Directional Movement Index) lines as dots simplifying detection of signals. The indicator also features pop-up and email alerts. Parameters Period - averaging period. Apply to - applied price: Open, Close, High, Low, Median, (high+low)/2, typical, (high+low+close)/3, weighted Close, (high+low+close+close)/4. Alert - enable/disable pop-up alerts. EMail - enable/disable email alerts.
OsMA Arrow
Pavel Shutovskiy
4.36 (11)
The indicator displays crossing zero level by Moving Average of Oscillator (OsMA) in the form of arrows. The indicator notifies about a signal by means of a pop-up Alert window, or sending notification to e-mail. Parameters Fast EMA Period - fast EMA. This is an exponential moving average from a price with a short period. Slow EMA Period - slow EMA. This is also an exponential moving average of a market price but with a longer period. Signal SMA Period - MACD SMA. This is a signal line which i
FREE
AD Trend line
Pavel Shutovskiy
5 (4)
AD Trend line draws trend lines on the basis of A/D indicator (Accumulation/Distribution). When A/D indicator breaks a trend line, the probability of the trend reversal is very high. This is a multitimeframe indicator which can display values from higher timeframes. Parameters Time-frame — Select a timeframe; zero is the current timeframe of the chart; Trend Line — Display lines on the chart; Apply to — Apply lines to close the candle's highest/lowest value; Width line — Width of the line; Style
FREE
Beacon
Pavel Shutovskiy
5 (3)
The indicator determines overbought/oversold zones on various timeframes. Arrows show market trend in various time sessions: if the market leaves the overbought zone, the arrow will indicate an ascending trend (arrow up), if the market leaves the oversold zone, the arrow will indicate a descending trend (arrow down). Situation on the timeframe, where the indicator is located, is displayed in the lower right window. Information on the market location (overbought or oversold zone), as well as the
FREE
MA 2 Histogram
Pavel Shutovskiy
4 (1)
The indicator is based on two Moving Averages. Its only difference from traditional indicators is that it is presented as a histogram. The histogram has four colors; each color represents a MA with its own period. In case of a descending trend, if a price is lower than a moving average, the indicator displays a value lower than the red zero level. In case of ascending trend, the indicator value is higher than the green zero level. Parameters: Period MA 1 - Period of the first moving average. MA
FREE
AC Arrow
Pavel Shutovskiy
4 (5)
The indicator displays zero level Accelerator Oscillator (AC) crossover in the form of dots on the chart. In indicator settings one can specify number of bars in the history to display signals, as well as shift of dots with respect to a bar. Parameters Bars — number of bars in the history to display indicator's signals; Shift — shift of dots with respect to bars.
FREE
Maps
Pavel Shutovskiy
4.75 (4)
The indicator displays on the chart a map, on which markers show the current trading session, as well as shows a text. The indicator provides two types of background display: white and black. The indicator is displayed as the background and does not hinder tracking the current market situation. Parameters: GMT -  the time difference of the terminal and GMT. Background - selection of background - black or white.
FREE
The indicator displays trend reversal in the form of arrows. The indicator does not change its values (is not redrawn) after a signal. The program notifies about arrows by means of a pop-up window, or sending notification to e-mail. This is a multitimeframe instrument. Values of the indicator may be displayed from higher timeframes. Parameters Time-frame - select time session; zero is the current timeframe (Time-frame cannot be lower than the current time interval). Bars - number of bars on th
Trend following
Pavel Shutovskiy
4.5 (2)
The EA in the form of histogram displays up and down trends. This tool is recommended to be used as a filter. Its readings will help to detect beginning, end, and continuation of a trend. This additional tool will suit any trading system. Parameters Period — indicator period; Bars — number of bars on the history.
FREE
Fibo
Pavel Shutovskiy
4.25 (4)
The script sets Fibonacci levels on the chart using maximums and minimums visible on the chart. The script names Fibo with such timeframe on which it has been launched (Fibo D1 or Fibo M30, etc.), therefore preserving previously constructed levels on different time charts. This instrument will be useful for those who start studying Fibonacci levels and those who need to form these levels in a speedy fashion. The script does not have additional settings. Fibonacci lines can be amended in standard
FREE
Any chart has patterns of consolidation which are also called accumulation patterns. These are sections where the market has been on the same price level during significant amount of time, and thus it was accumulating positions. After such accumulation, positions are distributing, and the market passes from flat into trend. The Consolidation Levels indicator is a professional tool which identifies these sections and builds levels according to the price of the market at the moment of consolidatio
ATR Pivot
Pavel Shutovskiy
The indicator calculates the levels by ATR daily range using the equations: 1AR = Open + ATR -1AS = Open - ATR AR 1/2 = Open + (ATR / 2) AS -1/2 = Open - (ATR / 2) AR 1/4 = Open + (ATR / 4) AS -1/4 = Open - (ATR / 4) AR 3/4 = Open + ((ATR*3) / 4) AS -3/4 = Open - ((ATR*3) / 4) AR 2 = Open + (ATR*2) AS -2 = Open - (ATR*2) Parameters Period ATR - ATR period Shift time - shift by time for Open Color opening of day - Open line color Color 1AR, -1AS - 1AR, -1AS line color Color AR 1/2, AS -1/2 - A
Max Min Levels
Pavel Shutovskiy
The indicator makes levels according to local maximums and minimums of a week, a month, or a year. Parameters: Week number - number of weeks for lines display Week level color - Week line color Month number - number of months for lines display Month level color - Month line color Year number - number of years for lines display Year level color - Year line color Width line - Width of lines Style line - Style of lines
AO AC Signal
Pavel Shutovskiy
The indicator displays signals of different indicators (which can be selected in parameters) on a chart when zero level is crossed. AO, AC or AO+AC if signals of two indicators coincide. The indicator shows an Alert message (pop-up window) when a signal appears. Parameters: Indicators - Selection of the indicator AO, AC, AO+AC. Bars - Number of bars in history for display of signals. Alert - Pop-up window in case of a signal.
F trend
Pavel Shutovskiy
The indicator is designed for scalping fans, it gives signals of an average of ten pips. The indicator is based on mathematical calculation, it determines the average range of the price channel, which is generally formed at the time of accumulation of positions. Once the price moves beyond its borders, a signal is generated in the form of an arrow. The indicator has a minimum of settings: the period for which you need to calculate, and the frequency of signals (the signal frequency is determined
Woltec
Pavel Shutovskiy
4 (1)
The indicator has been developed for scalping. The indicator is based on a mathematical calculation that determines the percent range of the price channel, which is generally formed at the time of the accumulation of positions. Once the price moves beyond its borders, a signal is generated in the form of dots. The indicator has a minimum of settings - the frequency of signals. Smaller values produce more signals. Parameters: Multiplier - the frequency of signals (with lower values signals are
Jaguar tac
Pavel Shutovskiy
The indicator uses the Envelopes channel in its calculations, which allows working with dynamic support and resistance levels. It also considers the direction and strength of the trend, as well as the mathematical calculation that determines the percent range of the price channel, which is generally formed at the time of the accumulation of positions. It first generates a preliminary signal in the form of a round arrow. Then it is necessary to wait for a normal arrow and enter the market only af
ADX trend
Pavel Shutovskiy
This indicator displays the signals of the ADX indicator (Average Directional Movement Index) as points on the chart. This facilitates the visual identification of signals. The indicator also features alerts (pop-up message boxes) and sending signals to e-mail. Parameters Period - averaging period. Apply to - price used for calculations: Close, Open, High, Low, Median (high+low)/2, Typical (high+low+close)/3, Weighted Close (high+low+close+close)/4. Alert - enable/disable alerts. EMail - enabl
Strategy Builder
Pavel Shutovskiy
5 (1)
Strategy Builder L'indicateur Strategy Builder vous permet de créer des stratégies classiques et individuelles sans charger le graphique avec un grand nombre d'indicateurs et sans suivre de nombreux indicateurs différents pour identifier le vrai signal. Strategy Builder affiche des signaux sous forme de flèches sur 30 indicateurs standard, 23 indicateurs montrant une divergence classique et cachée, recevant des signaux des niveaux de Fibonacci, horizontaux, lignes de tendance et rectangle. À
ADX arrow N
Pavel Shutovskiy
5 (1)
ADX arrow Cet indicateur affiche les signaux de l'indicateur ADX (Indice de Mouvement directionnel Moyen) sous forme de points sur le graphique. Cela facilite l'identification visuelle des signaux. L'indicateur comporte également des alertes (boîtes de messages contextuelles) et l'envoi de signaux par courrier électronique. Paramètre: Period  - période de moyenne. Apply to  - prix utilisé pour les calculs: Close, Open, High, Low, Median (high+low)/2, Typical (high+low+close)/3, Weighted C
ATR Pivots
Pavel Shutovskiy
The indicator calculates intraday levels based on the average daily price range, builds support and resistance levels that may be reversal. Parameters Period ATR - period of the ATR indicator Shift time - time offset for the opening of the day Color opening of day - color of the opening line of the day Color 1AR, -1AS - line color 1AR, -1AS Color AR 1/2, AS -1/2 - line color AR 1/2, AS Color AR 1/4, AS -1/4 - line color AR 1/4, AS -1/4 Color AR 3/4, AS -3/4 - line color AR 3/4, AS -3/4 Colo
Filtrer:
Maksym Mudrakov
29226
Maksym Mudrakov 2016.08.31 12:35 
 

L'utilisateur n'a laissé aucun commentaire sur la note

Répondre à l'avis
Version 2.1 2020.03.25
Обновлено под новый билд MQL4
Version 2.0 2016.01.21
- Added the year start levels.
- Fixed the display of the weekly, monthly levels.