Delta Cumulative Volume
- Indicateurs
- Angelo Capoferri
- Version: 1.1
- Activations: 5
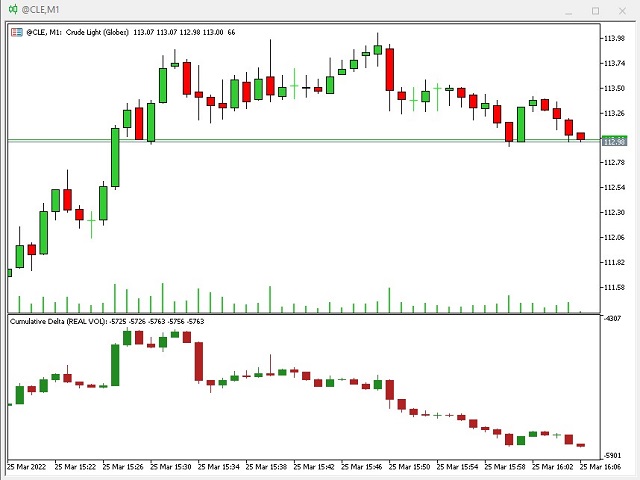
cet indicateur détecte la différence entre les contrats conclus en offre et en demande (agression) pour chaque bougie.
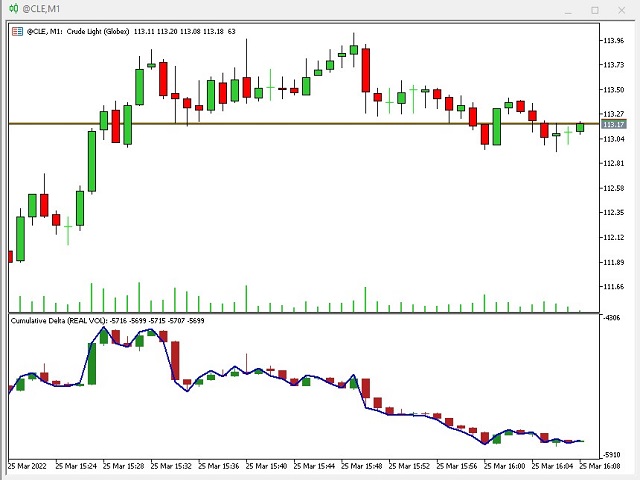
l'indicateur affiche dans la fenêtre dédiée sous le graphique des prix, des bougies données précisément par la différence entre les contrats vendus et achetés, qui génèrent la force volumétrique du marché.
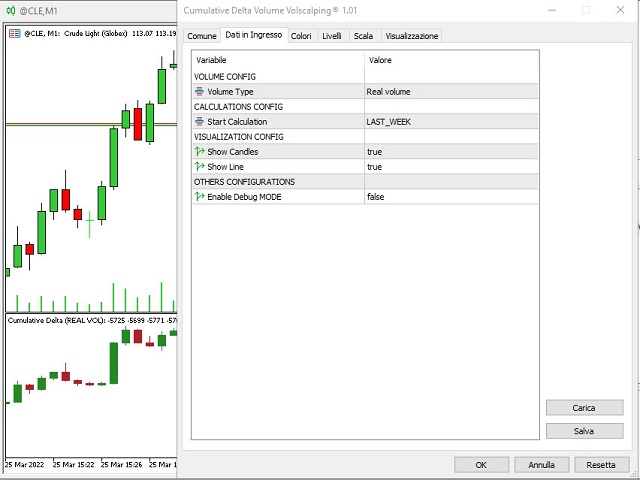
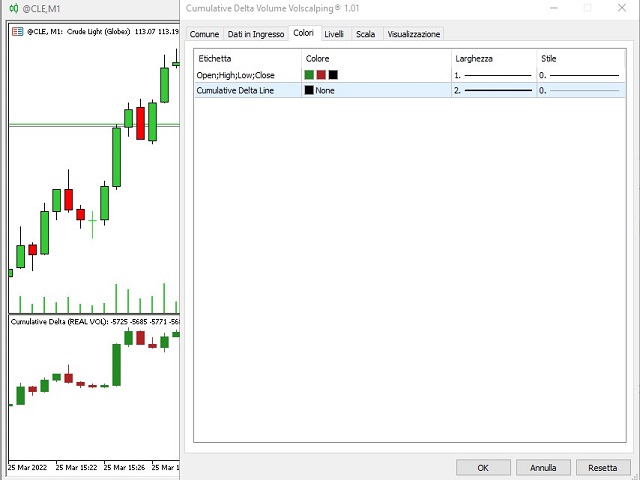
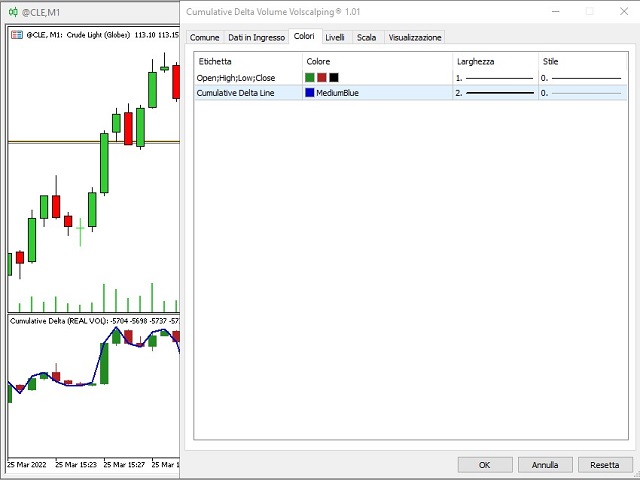
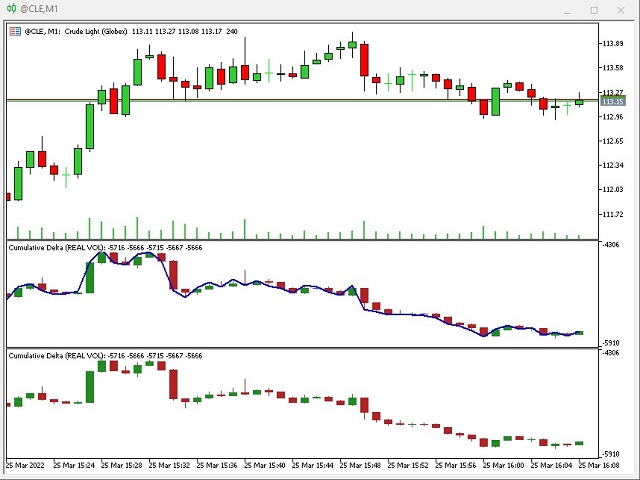
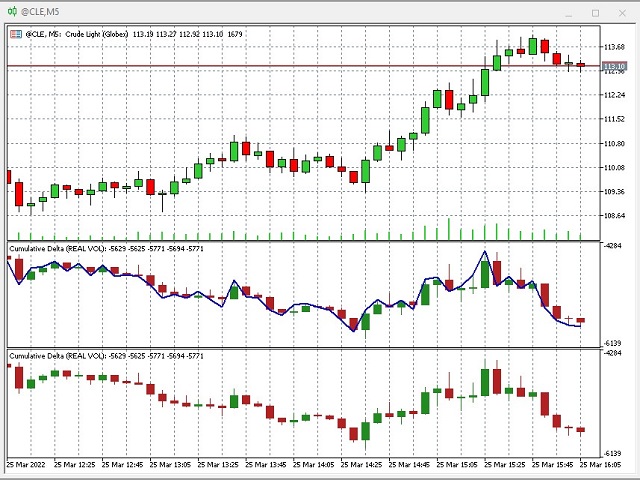
il est possible (voir sur les captures d'écran) comment sélectionner uniquement le graphique delta des chandeliers cumulatifs, ou même avec une ligne de tendance des bougies elles-mêmes : en sélectionnant la deuxième case u "AUCUN" aucune ligne de tendance ne sera dessinée, tandis qu'en sélectionnant une couleur, la ligne de tendance des bougies volumétriques apparaîtra sur le graphique avec elles.
A QUOI SERT CET INDICATEUR ? en comparant le graphique des prix avec le graphique delta volumétrique, vous pouvez voir la force réelle du marché, la convergence des deux graphiques déterminera une hausse / baisse correcte des prix, tandis qu'une divergence entre les prix et le delta volumétrique doit être un signal d'alerte pour le commerçant, car le prix devrait s'inverser. cet indicateur doit être utilisé avec une stratégie de trading, pour filtrer les faux signaux, en éliminant ceux qui se produisent dans une phase de divergence entre prix et volume.
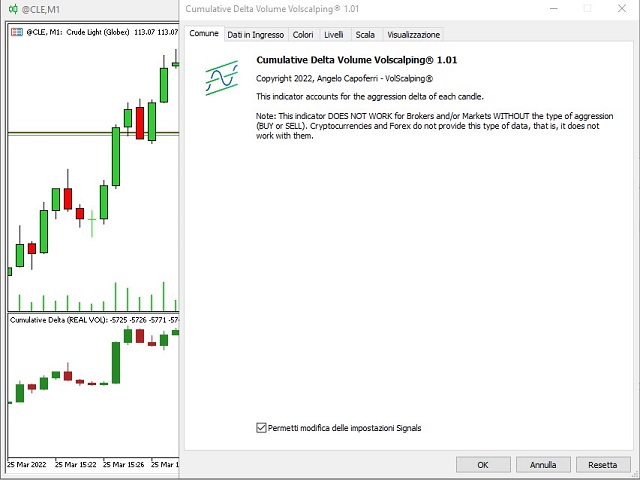
ATTENTION : l'indicateur fonctionne UNIQUEMENT avec des courtiers qui offrent le flux de données du marché réel, et qui divisent les contrats vendus/achetés (BID/ASK). CFD, FOREX ET CRYPTOCURRENCIES appartiennent au marché synthétique, ils n'ont pas de flux de données réel et donc l'indicateur NE FONCTIONNE PAS avec ces outils-
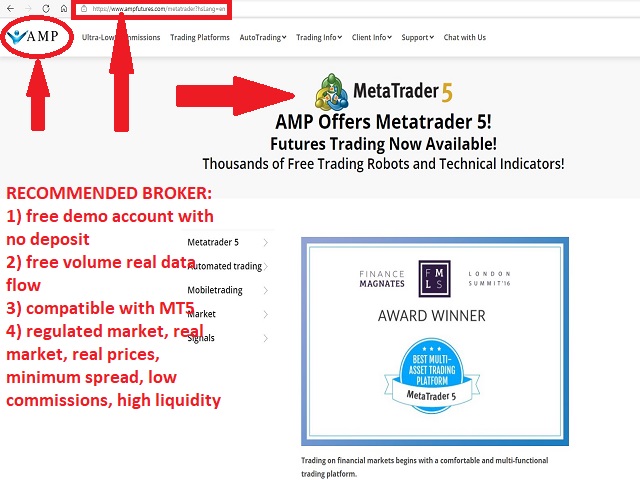
un courtier qui offre le compte de démonstration gratuit sans dépôt et avec un flux de données réel, sur lequel l'indicateur fonctionne, est AMP FUTURE.