• Aperçu
  • Avis (4)
  • Commentaires (3)
  • Nouveautés

Flosoft Supply Demand MT5

5

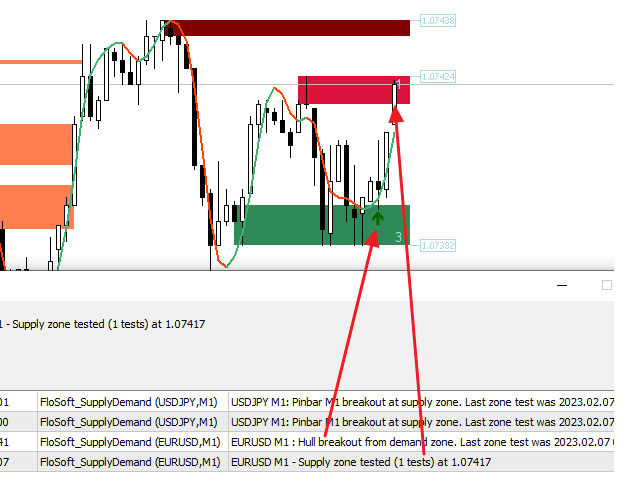
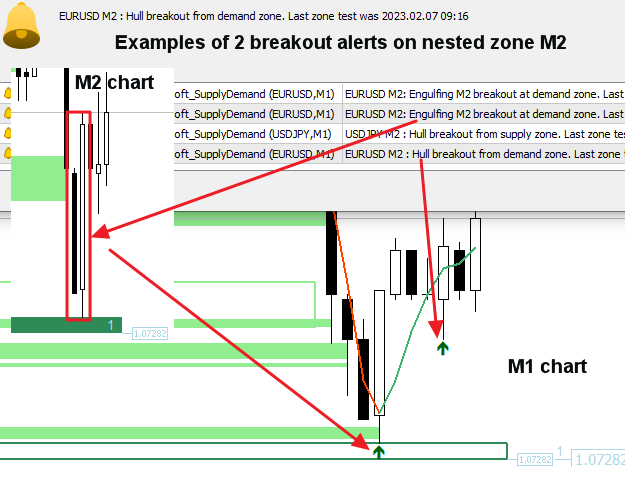
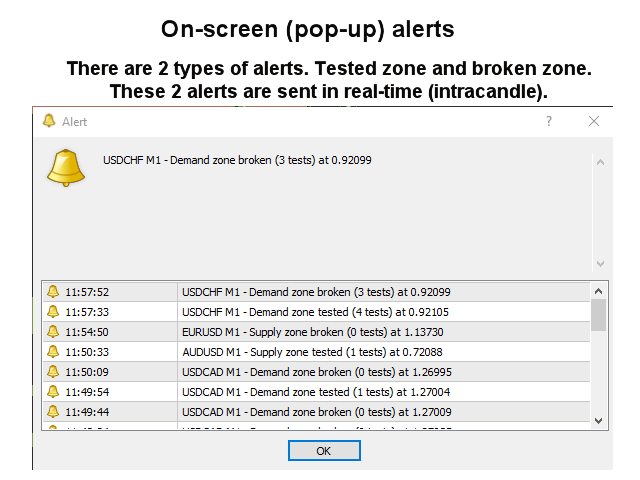
Cet indicateur de zone d'offre et de demande dessine les zones sur le graphique et envoie des alertes lorsque le prix a atteint ou cassé une zone. Il est également possible de l'utiliser pour être alerté des doubles hauts/bas réguliers au lieu des zones. Il est possible d'utiliser des filtres RSI, de volume et de divergence pour filtrer uniquement les configurations les plus fortes. Combiné avec vos propres règles et techniques, cet indicateur vous permettra de créer (ou d'améliorer) votre propre système puissant. Cet indicateur est destiné au trader plus expérimenté déjà familiarisé avec l'offre et la demande et comment il peut être utilisé lorsqu'il décide de fermer ou d'ouvrir une transaction.

Caractéristiques

  • Les divergences suivantes sont prises en charge :   MACD, OsMA, RSI, CCI, Stochastique et Impressionnant.
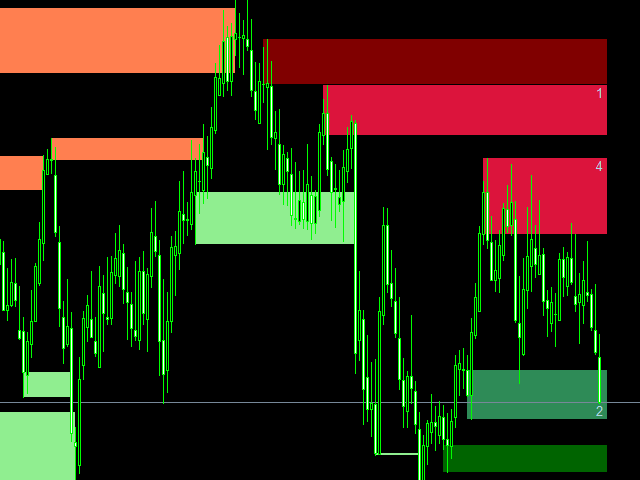
  • Les zones ont 3 couleurs (réglables par entrée). Couleur foncée pour la zone non testée, moyenne pour la zone testée et claire pour la zone brisée.
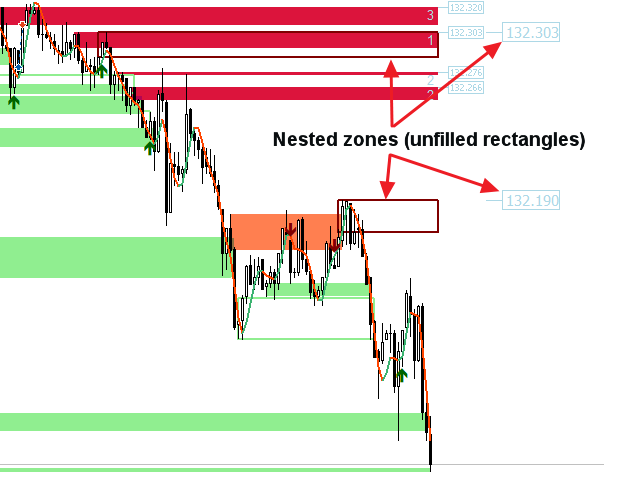
  • Le prix de la bordure extérieure de la zone ainsi que le montant du test de zone sont inscrits à chaque zone.
  • L'indicateur peut écrire les signaux dans des variables globales qui peuvent être utilisées par un Expert Advisor pour le trading automatique.

Paramètres d'entrée

Veuillez trouver la description et l'explication des paramètres d'entrée ici .


Avis 4
Poller 54
524
Poller 54 2023.12.03 02:26 
 

Very useful indicator. Easy to spot supply and demand zones in the main window. Using it for scalping. Well working, even in the 1M Timeframe. Highly recommended, for that price!

Johan Julien Aubry
855
Johan Julien Aubry 2023.02.12 11:39 
 

Powerfull indicator, very cheap and with a lot of possibilities to customise settings. Can be used for entry points or to confirm other entries. Well documented and EA compatible. Jan is really helpful and very reactive. I totally recommend this product!

cubetrader33
618
cubetrader33 2022.11.08 02:28 
 

Best demand and supply indicator, recommended 100 %. For what it does the price is too low.

Produits recommandés
Hot Zones MT5
Innovicient Limited
This indicator simplifies your entry zones by displaying the areas where you can plan your entry that potentially could give you high risk/reward ratios. Other than picking the most optimal entry points, the Hot Zone indicator can act as your typical support/resistance indicator for pullbacks for all timeframes. You can use this indicator as the only trading indicator or use it with another indicator for reentry purposes.  Besides, when using Hot Zones, the risk/reward ratio should be well abov
Volume Trade Levels
Mahmoud Sabry Mohamed Youssef
The idea behind this indicator is very simple , First it contains 2 mechanisms to place your trades: 1- Enter the Pips you want to duplicate to price levels. 2- Automatically let the indicator specify the largest Buy / Sell Volume Candle and place duplicated levels based on the candle itself. How it works: 1- Enter the Pips you want to duplicate to price levels:    1- once the indicator is loaded you will need first to Specify the number of pips in the indicator Configuration window ,you can
Supply and Demand Monster
Tsog Erdene Borjigon Enkhkhudulmur
Supply and demand zones are at the heart of   supply and demand trading . These zones are areas that show  liquidity at a specific price.  The supply zone is also called the distribution zone, while the demand zone is called the accumulation zone.   Our indicator automatically draw supply and demand zones in Metatrader 5. It give opportunity to understand trading zone and avoiding risk.
Order Blocks are supply or demand zones in which big traders can find the comfort of placing large buy and sell orders and completing a big, very big transaction. Order blocks are a unique trading strategy that helps traders find a direction in the market. Usually, it allows traders to find out what financial institutions are planning to do in a particular market and better indicate the next price movement.
Marca Dagua
Erison Francisco De Sales
3 (1)
Adiciona marca d'água com nome do ativo em negociação. Pode ser ajustado definindo tamanho da fonte e coloração do texto. Testado com vários ativos do mercado B3 e Forex  Adione ao gráfico e configure de acordo com a necessidade. Caso tenha problemas sinta-se a-vontade para nos avisar e providenciaremos a correção logo que possível. ______________________________
FREE
Smart Drawing Assist PRO MT5. Buttons will appears next to the selected object. The buttons are straightforward and amazingly easy to use. Features are as follow: Draw zigzag . Enabling you to draw patterns, draw zigzag, and draw shapes. All you have to do is click the button and start clicking point to point and it will draw automatically. Change object color . Rectangle/Trendline/HLine/Vline/Text/Price Arrow/Arrowed Line/ and your suggestion please. Flatten trendline . make a perfect flat line
Indicator LTS for MT5 (Level + Trends + Speed) The LTS indicator was specially created for quick analysis of consolidations on the chart , which greatly facilitates decision-making when trading. LTS marks resistance and gives information about the forces affecting it, as well as the current speed and average travel. The indicator is easily customizable and can analyze any timeframe.    LTS uses a unique trend analysis algorithm based on 4 parameters from global to local.
PAM Scalper PRO FX
Jesper Christensen
4.71 (17)
PAM SCALPER (Price action momentum scalper) analyses historical price data to identify supply and demand zones where liquidity is high and enters with momentum of the institutional money flow. The EA extrapolates areas to either buy or sell from historical price action and volume data.  If you want to backtest this EA or any other scalper EA, you must use high quality tick data. The historical data your broker provides through MT5 will give inacurate test results. You can follow my guide how to
Standard Deviation Pivot Point will enhance your trading and highlight great trade opportunities with the Support and Resistance levels that professionals use based on volatility of market. Standard Deviation Pivot trading is a simple effective method for entry and finding targets that are statistically on your side, highlighting market key levels has been used by professionals for decades and is effective on all symbols: Forex, Crypto, Stocks, Indices. Standard deviation is a measurement if vol
Quarterly Cycles
Barend Paul Stander
Quarterly Cycles Quarterly Cycles is based on the Quarterly Theory developed by Daye (  traderdaye on X / Twitter).     This is an aid to the user to find Cycles and it is NOT automatic detected, user can select AMDX or XAMD  in each Cycle and it will be visually draw on the chart.   Quarterly Cycles:   Yearly, Monthly, Weekly, Daily, 6 Hour (90 minutes) – Yearly Cycle: The year is divided in four sections of three months each Q1 - January, February, March Q2 - April, May, June Q3 - Jul
Fully-adjustable multi-layer Fibonacci strategies to suit any risk-appetite and trading styles| Built by a grid trader >> for grid traders.  This is MT5 version, click  here  for  Blue Onyx Pi MT4  (settings and logics are same in both versions)     Real monitoring signal   -->  (Coming soon) Intro BlueOnyx Pi EA   ('Onyx') is a next-gen   multi-currency    multi-timeframe  EA base on   multi-layer / cross-timeframe Fibonacci   indicator. There are options for both grid & no-grid trading to
The default input values are already optimized for EURUSD at time frame M1, spread at 14 and hedged account mode with leverage 1:100 and initial deposit of US$ 10,000, if you don't have this balance, I suggest you to use a CENT account. Always use the strategy tester optimization to set the best values for your assets, time frame, spread and account mode. It is very important and strongly recommended for successful trading. Optimize the input values as your needs.The EA's Strategy The Strategy T
Ultimate Supply Demand MT5
Ramon Sobrevals Arce
5 (4)
After working during many months, with the help of Neural Networks, we have perfected the ultimate tool you are going to need for identifying key price levels (Supports and Resistances) and Supply and Demand zones. Perfectly suitable to trigger your trades, set up your future actions, decide your Take Profit and Stop Loss levels, and confirm the market direction. Price will always move between those levels, bouncing or breaking; from one zone to another, all the remaining movements are just mark
L'indicateur calcule et trace automatiquement les niveaux de support et de résistance de Fibonacci - l'un des outils les plus efficaces pour l'analyse de marché. Le calcul utilise les données de prix moyennes pour la période et la période sélectionnées. Le minimum et le maximum pour cette période sont considérés comme le début et la fin du mouvement. Les niveaux de Fibonacci vous permettent de voir des points de référence potentiels, autour desquels le mouvement des prix peut ralentir ou s'inver
Horizontal Level indicator - reflects, using a histogram, the horizontal volumes of transactions at a certain price without reference to time. At the same time, the histogram appears directly in the terminal window, and each column of the volume is easily correlated with the quote value of the currency pair. The volume of transactions is of great importance in exchange trading, usually an increase in the number of concluded contracts confirms the trend, and their reduction indicates an imminent
This multi symbol indicator has been designed to automatically identify when price reaches major psychological levels. Also known as round numbers, whole numbers or key levels. As a bonus it can also scan for pivot point level on one selected time frame. Combined with your own rules and techniques, this indicator will allow you to create (or enhance) your own powerful system. Features Can write the signals to a file which can be used by an Expert Advisor for auto trading. Can monitor all symbols
XCalper CandleTimer
Aecio de Feo Flora Neto
4.45 (20)
This auxiliary indicator displays time left before closing on the current timeframe with continuous update . It also shows the last trade price and variation from a previous day close in percentage and points. This indicator is pretty handy for daytraders and scalpers who want to precisely monitor closing and opening of candles. Indicator parameters Show in shifted end - Default: False. Display time and values on screen. If True, Displays only time to close aside last candle. Distance from the
FREE
The Inversion Fair Value Gaps (IFVG) indicator is based on the inversion FVG concept by ICT and provides support and resistance zones based on mitigated Fair Value Gaps (FVGs). Image 1   USAGE Once mitigation of an FVG occurs, we detect the zone as an "Inverted FVG". This would now be looked upon for potential support or resistance. Mitigation occurs when the price closes above or below the FVG area in the opposite direction of its bias. (Image 2) Inverted Bullish FVGs Turn into P
This is a tool to estimate your probability of bankruptcy. features. estimate a probability of bankruptcy (Nauzer J. Balsara) from your trade history usually, it is small print and never interfere with trades alert in large prints and color when it exceed the alert level you can set parameters(i.e. winning ratio) fixed and simulate freely *1: this value is for reference only and is not guaranteed to occur.
FREE
--- StudentK Ict Smc Structure --- 1. Inner Circle Trading 2. Smart Money Concept 3. Structure --- What are included in tool --- 1. Market Session Box 2. Kill Zone 3. High/Low 4. Imbalance 5. FU Candle 6. Thicker Wick + Doji Candlestick 7. StudentK's Structure Line 8. Pivot Point --- Context --- StudentK is not indicated as a master or K Sir for knowledgeable person who claims for winning all the time. (But lots of traders should know the fact that it is rarely truth, especially
Fibonacci theft is an ultrascalping system that uses Fibonacci levels to launch a scalping system that allows theft   a few pips from the market. This system allows the use of fibonacci levels, predetermined levels or a level chosen by the user. It also presents the option of using or not volume and impulse filters. Being a very aggressive scalping system, it should only be used in pairs with a low spread and low commissions. This system is suitable for small accounts and can be used with onl
The Martinware Market Sides' Strength indicator shows the candlestick chart in a different manner allowing for a clearer view of which side, bullish or bearish is dominating the asset in the current period. As a bonus, it can also show an internal area that can be used to visualize two levels of Fibonacci retracements inside the bars. The default configuration shows the MSS bars with 4 main colors, two representing the bullish force, and two representing the bearish one. The primary colors a
Somewhere over the rainbow It is a system that tries to operate the market from the exhaustion of the trend with a correction algorithm that tries to cut losses at the cost of increasing the margin This system makes all the adjustments automatically, analyzing the pair and the market to decide which is the most efficient step to reach your destination. Somewhere over the rainbow is a multiple trade and multi lot system(The maximum batch can be up to 5 times the initial batch distributed in mul
TrendLine PRO MT5
Evgenii Aksenov
4.78 (49)
The Trend Line PRO indicator is an independent trading strategy. It shows the trend change, the entry point to the transaction, as well as automatically calculates three levels of Take Profit and Stop Loss protection Trend Line PRO is perfect for all Meta Trader symbols: currencies, metals, cryptocurrencies, stocks and indices Advantages of Trend Line PRO Never redraws its signals The possibility of using it as an independent strategy It has three automatic levels Take Profit and Stop Loss lev
Ratio
Radim Kucera
3.67 (3)
This indicator shows ratios between extremes on the chart. You can specify your own ratios (e.g. Fibonacci). Parameters Most important Density - how much in details to search ratios in extremes. Bigger number means less details, smaller number means more details. Base unit is 1 bar on the chart. History - how far to go in history while searching. When you set -1, the indicator processes all bars from history. Base unit is 1 bar on the chart. Range - how far search ratios from given extreme. Ba
FREE
MovingAveragePRO
Volkan Mustafaoglu
An invention that will turn your working principles upside down. Especially in horizontal and stagnant markets, annoying losses can occur. Besides, following trend lines, support and resistance can be tiring. To put an end to all this, I decided to create a professional "moving average" indicator. All you have to do is follow the colors. If you need additional support, I recommend the "Heiken-Ashi" candle indicator in my profile. I wish you lots of profit..
Trend ML
Andriy Sydoruk
Trend ML entry points should be used as potential market reversal points. The indicator works using the cyclic-wave dependence function. Thus, all entry points will be optimal points where the movement changes. The simplest way to use the indicator is to open a trade in the direction of an existing trend. The best result is obtained by combining the indicator with fundamental news, it can act as a news filter, that is, it can show how the market reacts to this or that news. A simple and con
Legend Moving
Ignacio Agustin Mene Franco
Pack Dragon, Indicator 2/3 Legend Moving It has the barrier pass strategy as well seen in the photo, where there is a dot on the yellow line, when there is a downtrend, there are red dots when it falls giving perfect entries in short, the same when the market is bullish, it marks another navy blue line, where it gives perfect entries over the green dots for long , It is available for all seasons and for markets of Forex and synthetic indices !
TrendHunt is an indicator focus on higher timeframe (H1 and Above) It using breakout strategy, plus MA for filter. Check for Support, Resistance and News before every entry to increase the success rate. Parameters Moving Average Period - 200 Moving Average Price - Closed Price Entry Period - 20 (Breakthrough 20 High for Long, 20 Low for short) Stop Period - 10 (cross over 10 low for exit long)
Version MT4 : https://www.mql5.com/en/market/product/91169 Version MT5 : https://www.mql5.com/en/market/product/110193 L'Assistant EA "Smart Trader" est un allié indispensable pour exécuter les ordres initiaux et gérer efficacement les transactions dans le monde du trading. Lorsque vous passez une commande pour la première fois, cet outil intervient avec précision et offre des fonctionnalités qui incluent la couverture des commandes en attente et des données pertinentes pour aider à la pris
Les acheteurs de ce produit ont également acheté
Tout d'abord, il convient de souligner que ce système de trading est un indicateur non repeint, non redessiné et non retardé, ce qui le rend idéal pour le trading manuel et automatisé. Le "Système de Trading Smart Trend MT5" est une solution de trading complète conçue pour les traders débutants et expérimentés. Il combine plus de 10 indicateurs premium et propose plus de 7 stratégies de trading robustes, ce qui en fait un choix polyvalent pour différentes conditions de marché. Stratégie de suivi
Atomic Analyst MT5
Issam Kassas
5 (11)
Tout d'abord, il convient de souligner que cet indicateur de trading n'est ni repainting, ni redrawing et ne présente aucun délai, ce qui le rend idéal à la fois pour le trading manuel et automatisé. L'Analyste Atomique est un indicateur d'action sur les prix PA qui utilise la force et le momentum du prix pour trouver un meilleur avantage sur le marché. Équipé de filtres avancés qui aident à éliminer les bruits et les faux signaux, et à augmenter le potentiel de trading. En utilisant plusieur
Quantum Trend Sniper
Bogdan Ion Puscasu
5 (37)
Présentation       Quantum Trend Sniper Indicator   , l'indicateur révolutionnaire MQL5 qui transforme la façon dont vous identifiez et négociez les inversions de tendance ! Développé par une équipe de traders expérimentés avec une expérience commerciale de plus de 13 ans,       Indicateur Quantum Trend Sniper       est conçu pour propulser votre parcours de trading vers de nouveaux sommets grâce à sa manière innovante d'identifier les inversions de tendance avec une précision extrêmement élevée
FX Volume MT5
Daniel Stein
4.94 (17)
Obtenez votre mise à jour quotidienne du marché avec des détails et des captures d'écran via notre Morning Briefing ici sur mql5 et sur Telegram ! FX Volume est le PREMIER et SEUL indicateur de volume qui fournit un VRAI aperçu du sentiment du marché du point de vue d'un courtier. Il fournit des informations impressionnantes sur la façon dont les acteurs institutionnels du marché, comme les courtiers, sont positionnés sur le marché des changes, bien plus rapidement que les rapports COT. Voir c
Trend Screener Pro MT5
STE S.S.COMPANY
4.89 (61)
Indicateur de tendance, solution unique révolutionnaire pour le trading et le filtrage des tendances avec toutes les fonctionnalités de tendance importantes intégrées dans un seul outil ! Il s'agit d'un indicateur multi-période et multi-devises 100 % non repeint qui peut être utilisé sur tous les symboles/instruments : forex, matières premières, crypto-monnaies, indices et actions. Trend Screener est un indicateur de suivi de tendance efficace qui fournit des signaux de tendance fléchés avec des
Top indicator for MT5   providing accurate signals to enter a trade without repainting! It can be applied to any financial assets:   forex, cryptocurrencies, metals, stocks, indices .  Watch  the video  (6:22) with an example of processing only one signal that paid off the indicator! MT4 version is here It will provide pretty accurate trading signals and tell you when it's best to open a trade and close it. Most traders improve their trading results during the first trading week with the help of
FX Power MT5 NG
Daniel Stein
5 (4)
Obtenez votre mise à jour quotidienne du marché avec des détails et des captures d'écran via notre Morning Briefing ici sur mql5 et sur Telegram ! FX Power MT5 NG est la nouvelle génération de notre très populaire indicateur de force des devises, FX Power. Et qu'est-ce que ce compteur de force de nouvelle génération offre ? Tout ce que vous avez aimé de l'original FX Power PLUS Analyse de la force de l'OR/XAU Des résultats de calcul encore plus précis Périodes d'analyse configurables individuel
Tout d'abord, il convient de souligner que cet outil de trading est un indicateur non repeint, non redessiné et non retardé, ce qui le rend idéal pour le trading professionnel. L'indicateur Smart Price Action Concepts est un outil très puissant à la fois pour les nouveaux et les traders expérimentés. Il regroupe plus de 20 indicateurs utiles en un seul, combinant des idées de trading avancées telles que l'analyse du trader Inner Circle et les stratégies de trading Smart Money Concepts. Cet in
RelicusRoad Pro MT5
Relicus LLC
4.82 (22)
Maintenant 147 $ (augmentant à 499 $ après quelques mises à jour) - Comptes illimités (PCS ou Mac) Manuel d'utilisation RelicusRoad + Vidéos de formation + Accès au groupe Discord privé + Statut VIP UNE NOUVELLE FAÇON DE REGARDER LE MARCHÉ RelicusRoad est l'indicateur de trading le plus puissant au monde pour le forex, les contrats à terme, les crypto-monnaies, les actions et les indices, offrant aux traders toutes les informations et tous les outils dont ils ont besoin pour rester renta
Auto Order Block with break of structure based on ICT and Smart Money Concepts Futures Break of Structure ( BoS )             Order block ( OB )            Higher time frame Order block / Point of Interest ( POI )    shown on current chart           Fair value Gap ( FVG ) / Imbalance   ,  MTF      ( Multi Time Frame )    Volume Imbalance     ,  MTF          vIMB Gap’s Equal High / Low’s     ,  MTF             EQH / EQL Liquidity               Current Day High / Low           HOD /
Advanced Supply Demand MT5
Bernhard Schweigert
4.53 (15)
La meilleure solution pour tout commerçant débutant ou expert ! Cet indicateur est un outil de trading unique, de haute qualité et abordable car nous avons intégré un certain nombre de fonctionnalités propriétaires et une nouvelle formule. Avec cette mise à jour, vous pourrez afficher des zones à double horaire. Vous pourrez non seulement afficher un TF plus élevé, mais afficher les deux, le graphique TF, PLUS le TF supérieur : AFFICHAGE DES ZONES NICHÉES. Tous les traders Supply Demand vont ado
AW Trend Predictor MT5
AW Trading Software Limited
4.76 (55)
La combinaison des niveaux de tendance et de panne dans un seul système. Un algorithme d'indicateur avancé filtre le bruit du marché, détermine la tendance, les points d'entrée, ainsi que les niveaux de sortie possibles. Les signaux indicateurs sont enregistrés dans un module statistique, qui vous permet de sélectionner les outils les plus appropriés, montrant l'efficacité de l'historique des signaux. L'indicateur calcule les marques Take Profit et Stop Loss. Manuel et instruction ->   ICI   / v
TPSpro TRENDPRO  - is a trend indicator that automatically analyzes the market and provides information about the trend and each of its changes, as well as giving signals for entering trades without redrawing! The indicator uses each candle, analyzing them separately. referring to different impulses - up or down impulse. Exact entry points into transactions for currencies, crypto, metals, stocks, indices!  -  Version MT4                  DETAILED DESCRIPTION        /       TRADING SETUPS       
A key element in trading is zones or levels from which decisions to buy or sell a trading instrument are made. Despite attempts by major players to conceal their presence in the market, they inevitably leave traces. Our task was to learn how to identify these traces and interpret them correctly. Reversal First Impulse levels (RFI)   -  Version MT4                  INSTRUCTIONS                 RUS                 ENG                         R ecommended to use with an indicator   -  TREND PRO  
ICT, SMC, SMART MONEY CONCEPTS, SMART MONEY, Smart Money Concept, Support and Resistance, Trend Analysis, Price Action, Market Structure, Order Blocks, BOS/CHoCH,   Breaker Blocks ,  Momentum Shift,   Supply&Demand Zone/Order Blocks , Strong Imbalance,   HH/LL/HL/LH,    Fair Value Gap, FVG,  Premium  &   Discount   Zones, Fibonacci Retracement, OTE, Buy Side Liquidity, Sell Side Liquidity, BSL/SSL Taken, Equal Highs & Lows, MTF Dashboard, Multiple Time Frame, BigBar, HTF OB, HTF Market Structure
Professional Scalping Tool on Deriv Attention! The indicator will be sold in limited quantities!!! Description: This trading indicator is designed for professional traders focused on scalping. Designed with the market in mind, it provides highly accurate spike trading signals. It works on the M1 timeframe and supports the following symbols: Boom 300 Index, Boom 500 Index, Boom 1000 Index, Crash 300 Index, Crash 500 Index, Crash 1000 Index. Functional Features: - Direction: - Trading is ca
Blahtech Supply Demand MT5
Blahtech Limited
4.57 (14)
Was: $299  Now: $99   Supply Demand uses previous price action to identify potential imbalances between buyers and sellers. The key is to identify the better odds zones, not just the untouched ones. Blahtech Supply Demand indicator delivers functionality previously unavailable on any trading platform. This 4-in-1 indicator not only highlights the higher probability zones using a multi-criteria strength engine, but also combines it with multi-timeframe trend analysis, previously confirmed swings
Présentation       Quantum Breakout PRO   , l'indicateur révolutionnaire MQL5 qui transforme la façon dont vous négociez les zones d'évasion ! Développé par une équipe de traders expérimentés avec une expérience commerciale de plus de 13 ans,       Évasion quantique PRO       est conçu pour propulser votre parcours commercial vers de nouveaux sommets grâce à sa stratégie de zone de discussion innovante et dynamique. Quantum Breakout Indicator vous donnera des flèches de signalisation sur le
XQ Indicator MetaTrader 5
Marzena Maria Szmit
5 (1)
Step into the realm of Forex trading with confidence and precision using XQ, a cutting-edge Forex indicator designed to elevate your trading game to unprecedented heights. Whether you're a seasoned trader or just stepping into the world of currency exchange, XQ Forex Indicator empowers you with the insights and signals needed to make informed trading decisions. The signal conditions are a combination of three indicators, and XQ Forex Indicator only display  medium and long-term trends . The ind
TrendDecoder Premium MT5
Christophe, Pa Trouillas
5 (1)
Identifiez les ranges et les tendances fortes  |  Obtenez les premiers signaux   |    Obtenez des TP et des sorties   clairs   |    Repérer les niveaux Fibo que le prix va tester   |  Indicateur qui ne retrace pas, non retardé - idéal pour le trading manuel et automatisé - adapté à tous les actifs et à toutes les unités de temps - 50% discount   pour le lancement - puis retour à >>   149 $ Après votre achat,   contactez-moi sur ce canal  pour obtenir les réglages recommandés. Version MT4 :   cli
MetaBands M5
Vahidreza Heidar Gholami
4.67 (3)
MetaBands uses powerful and unique algorithms to draw channels and detect trends so that it can provide traders with potential points for entering and exiting trades. It’s a channel indicator plus a powerful trend indicator. It includes different types of channels which can be merged to create new channels simply by using the input parameters. MetaBands uses all types of alerts to notify users about market events. Features Supports most of the channel algorithms Powerful trend detection algorith
Tout d'abord, il convient de souligner que ce système de trading est un indicateur non repainting, non redrawing et non lagging, ce qui le rend idéal pour le trading professionnel. Le "Système de Trading de Support et Résistance Intelligent" est un indicateur avancé conçu pour les traders novices et expérimentés. Il permet aux traders de bénéficier de précision et de confiance sur le marché du forex. Ce système complet combine plus de 7 stratégies, 10 indicateurs et diverses approches de trad
Was: $249  Now: $99   Market Profile defines a number of day types that can help the trader to determine market behaviour. A key feature is the Value Area, representing the range of price action where 70% of trading took place. Understanding the Value Area can give traders valuable insight into market direction and establish the higher odds trade. It is an excellent addition to any system you may be using. Inspired by Jim Dalton’s book “Mind Over Markets”, this indicator is designed to suit the
Malaysian SNR Levels
Matthias Horst Pieroth
This indicator can be used to display Support and Resistance levels according to  the  Malaysian SNR concept , in which Support and Resistance are exact levels of a line chart. Malaysian SNR There are 3 different horizontal levels in Malaysian SNR: A-Level : This level is located at the peak of this line chart. (shape looks like the letter A) V-Level : Level at the valley of a line chart, (shape looks like the letter V) Gap-Leve l: This level is located at the Close/Open gap between two cand
The Volume by Price Indicator for MetaTrader 5 features Volume Profile and Market Profile TPO (Time Price Opportunity). Get valuable insights out of currencies, equities and commodities data. Gain an edge trading financial markets. Volume and TPO histogram bar and line charts. Volume Footprint charts. TPO letter and block marker charts including split structures. Versatile segmentation and compositing methods. Static, dynamic and flexible ranges with relative and/or absolute visualizations. Lay
Trend Line Map Pro MT5
STE S.S.COMPANY
4.67 (9)
Trend Line Map indicator is an addons for   Trend Screener Indicator . It's working as a scanner for all signals generated by Trend screener ( Trend Line Signals ) . It's a Trend Line Scanner based on Trend Screener Indicator.  If you don't have Trend Screener Pro Indicator,   the Trend Line Map Pro will not work.     LIMITED TIME OFFER : Trend Line Map Indicator is available for only 50 $ and lifetime. ( Original price 125$ ) By accessing to our MQL5 Blog,  you can find all our premium indica
Account Graph MT5
Kyra Nickaline Watson-gordon
5 (1)
An indicator to draw a graph of account current and historical state such as Balance, Equity, Margin, Free Margin, Margin Level, Drawdown, Account Profit, Deposit and Withdrawals. Indicator Inputs : Draw Balance Graph Draw Equity Graph Draw Margin Graph Draw Free Margin Graph Draw Margin Level Graph Draw Drawdown Graph Draw Account Profit Graph Hide Data on Chart and Buffers Connect Gaps by Lines Sign of DDs on Profit Sign of DDs on Loss Tips : The Indicator will draw historical balance gra
La meilleure solution pour tout débutant ou Expert Trader ! Cet indicateur est un outil de trading unique, de haute qualité et abordable car nous avons incorporé un certain nombre de caractéristiques exclusives et une formule secrète. Avec seulement UN graphique, il donne des alertes pour les 28 paires de devises. Imaginez comment votre trading s'améliorera parce que vous serez capable de repérer le point de déclenchement exact d'une nouvelle tendance ou d'une opportunité de scalping ! Cons
TPA True Price Action indicator reveals the true price action of the market makers through 100% non-repainting signals strictly at the close of a candle! TPA shows entries and re-entries, every time the bulls are definitely stronger than the bears and vice versa. Not to confuse with red/green candles. The shift of power gets confirmed at the earliest stage and is ONE exit strategy of several. There are available now two free parts of the TPA User Guide for our customers. The first "The Basics"
IX Power MT5
Daniel Stein
5 (2)
IX Power   apporte enfin la précision imbattable de FX Power aux symboles non-Forex. Il détermine avec précision l'intensité des tendances à court, moyen et long terme de vos indices, actions, matières premières, ETF et même crypto-monnaies préférés. Vous pouvez   analyser tout ce que   votre terminal a à offrir. Essayez-le et découvrez comment   votre timing s'améliore considérablement   lors de vos transactions. Caractéristiques principales d'IX Power Résultats de calcul précis à 100 %,
Plus de l'auteur
I recommend you to read the   product's blog  (manual) from start to end so that it is clear from the beginning what the indicactor offers. This multi time frame and multi symbol divergence dashboard indicator sends an alert when one or two different divergences have been identified. It can be used with all time frames from M1 to MN. It is possible to enable moving average or RSI trend filter to filter out only the strongest setups. Combined with your own rules and techniques, this indicator wi
I recommend you to read the   product's blog  (manual) from start to end so that it is clear from the beginning what the indicactor offers. This multi time frame and multi symbol indicator can identify the following 5 crosses: when a fast moving average crosses a slow moving average line. when price has reached a single moving average (closed above/below or just bounced). when a triple moving average formation has appeared (all 3 MA:s in consecutive alignment) when the MACD main line crosses th
Cet indicateur multi-temps et multi-symboles identifie les motifs double haut/bas, tête et épaule, fanion/triangle et drapeau. Il est également possible de configurer des alertes uniquement lorsqu'une cassure de décolleté/triangle/mât de drapeau s'est produite (rupture de décolleté = signal confirmé pour le haut/les bas et la tête et les épaules).       L'indicateur peut également être utilisé en mode graphique unique. Veuillez en savoir plus sur cette option dans le produit   blogue . Combiné à
The indicator identifies when a divergence occurs between price and an indicator or oscillator. It identifies both regular and hidden divergences. Combined with your own rules and techniques, this indicator will allow you to create (or enhance) your own powerful system. Features Can detect divergences for the following oscillators/indicators:   MACD, OsMA, Stochastics, RSI, CCI, RVI, Awesome, ADX, ATR, OBV, Composite index, MFI and Momentum. Only one oscillator/indicator can be selected. Draws
FREE
Je vous recommande de lire le       blog du produit   (manuel) du début à la fin afin que       il est clair dès le début ce que propose l'EA. La stratégie principale de cet Expert advisor (EA) est de placer des trades lorsque 3 moyennes mobiles (MA) sont alignées consécutivement et à une certaine distance l'une de l'autre (elle peut être utilisée par exemple pour une stratégie peu connue utilisée par certains traders institutionnels , ce qui implique les MA 10, 20 et 30 sur la plage horaire D1
Cet indicateur reconnaît un type spécial de formation de barre intérieure qui est formée d'une grande bougie principale suivie de 4 bougies plus petites (veuillez consulter l'explication de la stratégie ci-dessous). Caractéristiques Trace les lignes d'arrêt d'achat/vente sur le graphique ainsi que les niveaux de profit et d'arrêt de perte. Les niveaux TP/SL sont basés sur l'indicateur Average True Range (ATR). Les couleurs des objets sont modifiables. Vous envoie une alerte en temps réel lorsqu'
Cet indicateur à plusieurs périodes et à plusieurs symboles identifie les formations haut/bas doubles ou triples ou une cassure de décolleté suivante (haut/bas confirmé). Il offre des filtres RSI, pin bar, engloutissant, pince à épiler, étoile du matin/soir ainsi que des options de filtre de divergence MACD, Awesome (AO) ou RSI qui permettent de filtrer uniquement les configurations les plus fortes.       L'indicateur peut également être utilisé en mode graphique unique. Veuillez en savoir plus
Please if possible consider the  paid version  which I will continue to develop (there will be no future updates for this free version). This Expert Advisor identifies when a divergence occurs between price and an oscillator/indicator. It identifies both regular/classical (trend reversal) and hidden (trend continuation) divergences. It has RSI, bollinger, stochastics, moving average and ADX filter options which makes it possible to filter out only the strongest setups. The default settings ar
FREE
Cet indicateur de tableau de bord de divergence multi périodes et multi symboles envoie une alerte lorsqu'une ou deux divergences différentes ont été identifiées sur plusieurs périodes et non sur des divergences uniques. Il peut être utilisé avec toutes les plages horaires de M1 à MN. Un maximum de 9 périodes peuvent être affichées dans le tableau de bord en même temps. Il est possible d'activer le filtre de tendance de la moyenne mobile, du RSI ou des bandes de Bollinger pour filtrer uniquement
The indicator identifies when a divergence occurs between price and an indicator or oscillator. It identifies bullish and bearish hidden or regular (classical) divergences. Combined with your own rules and techniques, this indicator will allow you to create (or enhance) your own powerful system. Features Can detect divergences for the following indicators/oscillators: MACD, OsMA (Moving average of Oscillator), Stochastics, RSI, CCI, RVI, Awesome (AO), ADX, ATR, OBV, MFI, Momentum and   Composi
FREE
Averaging down EA
Jan Flodin
5 (1)
This cost averaging Expert advisor (EA) places additional trades in the same direction as the original (manually opened) order when the price goes against you. It can be used as a grid system or as pure martingale system (exponential increasing of lot size) or smoothed martingale (for instance linear increasing of the lot size). Due to the risk involved, this EA is more suitable for intermediate to advanced traders who are well aware of how to handle risk management and trading an already profit
This indicator can send alerts when a Heiken Ashi Smoothed color change occurs. Combined with your own rules and techniques, this indicator will allow you to create (or enhance) your own powerful system. Features Can send all types of alerts. Option to delay the alert one or more bars in order to confirm the color (trend) change. Input parameters Candle shift for alert: Default is 1. Setting it to 0 will alert you on color change on the current candle. This should be regarded as a pending (uncon
FREE
Je vous recommande de lire le   blog (manuel) du produit   du début à la fin afin que ce soit clair dès le début ce que propose EA. Cet Expert Advisor identifie lorsqu'une divergence se produit entre le prix et un oscillateur/indicateur. Il identifie à la fois les divergences régulières/classiques (inversion de tendance) et cachées (poursuite de la tendance). Il propose des options de zone offre/demande, RSI, Bollinger, stochastique, moyenne mobile (MA régulière et Hull MA), ADX et filtre de vo
This indicator can send alerts when a Heiken Ashi Smoothed color change occurs. Combined with your own rules and techniques, this indicator will allow you to create (or enhance) your own powerful system. Features Can send all types of alerts. Option to delay the alert one bar in order to confirm the color (trend) change. Input parameters Wait for candle close: 'true' or 'false'. Setting it to 'true' will delay the alert to the opening of the bar following the bar where the color change occurred.
FREE
I  recommend you to read the   product's blog  (manual) from start to end so that it is clear from the beginning what the indicator offers. In addition to finding bullish and bearish Three line strike formations this multi symbol and mutli time frame indicator can also scan for the following candlestick patterns (please see screenshots for explanation of the patterns): Three white soldiers (reversal>continuation pattern) Three black crows (reversal>continuation pattern) The formations do not ap
Cet indicateur à plusieurs périodes et à plusieurs symboles identifie les formations haut/bas doubles ou triples ou une cassure de décolleté suivante (haut/bas confirmé). Il offre des filtres RSI, pin bar, engloutissant, pince à épiler, étoile du matin/soir ainsi que des options de filtre de divergence qui permettent de filtrer uniquement les configurations les plus fortes.       L'indicateur peut également être utilisé en mode graphique unique. Veuillez en savoir plus sur cette option dans le p
This multi time frame and multi symbol indicator scans for pin bars. Combined with your own rules and techniques, this indicator will allow you to create (or enhance) your own powerful system. Features Can monitor all symbols visible in your Market Watch window at the same time. Apply the indicator to just one chart and instantly monitor the entire market. Can monitors every time frame, from M1 to MN, and sends you a real-time alert when a pin bar is identified. All Metatrader native alert types
I  recommend you to read the   product's blog  (manual) from start to end so that it is clear from the beginning what the indicator offers. This multi time frame and multi symbol indicator identifies double top/bottom, head & shoulders, pennant/triangle and flag patterns. It is also possible to setup alerts only when a neckline/triangle/flagpole breakout has occured (neckline breakout = confirmed signal for top/bottoms and head & shoulders).  The indicator can also be used in single chart mode.
Cet indicateur de tendance à plusieurs périodes et à plusieurs symboles envoie une alerte lorsqu'une forte tendance ou un renversement de tendance a été identifié. Il peut le faire en choisissant de construire le tableau de bord à l'aide de la moyenne mobile (simple ou double (crossover MA)), RSI, bandes de Bollinger, ADX, indice composite (Constance M. Brown), Awesome (Bill Williams), MACD (ligne de signal ), Heiken Ashi lissé, moyenne mobile de Hull, croisements stochastiques, Gann HiLo Activa
I recommend you to read the   product's blog  (manual) from start to end so that it is clear from the beginning what the indicactor offers. This multi time frame and multi symbol supply and demand zone dashboard indicator sends alerts when the price has reached a supply/demand zone. It is also possible to use it to be alerted about regular double tops/bottoms instead of zones. It can be used with all time frames from M1 to MN. It is possible to use RSI, divergence (MACD, OsMA, RSI or Awesome) a
Cet indicateur de tableau de bord d'offre et de demande à plusieurs périodes et à plusieurs symboles envoie des alertes lorsque le prix a atteint une zone d'offre/demande. Il est également possible de l'utiliser pour être alerté des doubles hauts/bas réguliers au lieu des zones. Il peut être utilisé avec toutes les plages horaires de M1 à MN.       Un maximum de 9 périodes peuvent être affichées dans le tableau de bord en même temps.   Il est possible d'utiliser des filtres RSI, divergence (MACD
L'indicateur identifie quand une divergence se produit entre le prix et un oscillateur/indicateur. Il identifie à la fois les divergences régulières et cachées. Il dispose d'une option de filtre RSI qui permet de filtrer uniquement les configurations les plus puissantes. L'indicateur offre également des options pour attendre une formation engloutissante, une cassure du canal Donchian ou que le prix croise une moyenne mobile   (voir capture d'écran #3)       pour confirmer la divergence avant de
Cet indicateur multi-temps et multi-symboles permet d'identifier les 5 croix suivantes : lorsqu'une moyenne mobile rapide croise une ligne moyenne mobile lente. lorsque le prix a atteint une moyenne mobile unique (fermé au-dessus/au-dessous ou rebondi). lorsqu'une formation de moyenne mobile triple est apparue (tous les 3 MA:s en alignement consécutif). lorsque la ligne principale MACD croise la ligne de signal. lorsque la ligne de signal croise la ligne MACD zéro (0). Combiné à vos propres règl
Veuillez si possible envisager d'acheter le       Version MT5   que je continuerai à développer (il n'y aura pas de futures mises à jour pour cette version MT4). Je vous recommande également de lire       blog du produit   (manuel) du début à la fin afin qu'il soit clair dès le début ce que propose l'EA. La stratégie principale de cet Expert advisor (EA) est de placer des trades lorsque 3 moyennes mobiles (MA) sont alignées consécutivement et à une certaine distance l'une de l'autre (elle peut
L'indicateur identifie lorsqu'une divergence se produit entre le prix et un oscillateur/indicateur. Il identifie à la fois les divergences haussières et baissières. Il dispose d'une option de filtre RSI qui permet de filtrer uniquement les configurations les plus fortes. L'indicateur offre également des options pour attendre une cassure du canal Donchian ou que le prix croise une moyenne mobile (voir capture d'écran #3) pour confirmer la divergence avant de signaler l'opportunité commerciale. Co
Cet indicateur à plusieurs périodes et à plusieurs symboles recherche les barres à épingles, les étoiles du matin/soir, les engloutissements, les pinces à épiler, les frappes à trois lignes, les barres intérieures, les fanions et les triangles.   L'indicateur peut également être utilisé en mode graphique unique. Veuillez en savoir plus sur cette option dans le produit   blogue .   Combiné à vos propres règles et techniques, cet indicateur vous permettra de créer (ou d'améliorer) votre propre sys
This multi time frame and multi symbol indicator scans for Pin bars, Morning/Evening stars, Engulfings, Tweezers, Three line strikes, Inside bars and Pennants and Triangles. The indicator can also be used in single chart mode. Please read more about this option in the product's blog . Combined with your own rules and techniques, this indicator will allow you to create (or enhance) your own powerful system. Features Can monitor all symbols visible in your Market Watch window at the same time. Ap
Cet indicateur multi-temps et multi-symboles identifie le moment où la ligne de signal stochastique croise la ligne principale stochastique. En prime, il peut également rechercher les bandes de Bollinger et les croisements de surachat/survente RSI. Combiné à vos propres règles et techniques, cet indicateur vous permettra de créer (ou d'améliorer) votre propre système puissant. Caractéristiques Peut surveiller tous les symboles visibles dans votre fenêtre Market Watch en même temps. Appliquez l'i
This multi indicator/oscillator (hereafter indicator), multi time frame and multi symbol indicator identifies when a divergence occurs between price and one, two or three indicators. It identifies both regular/classical (trend reversal) and hidden (trend continuation) divergences. It has RSI and MA trend filter options which makes it possible to filter out only the strongest setups. Combined with your own rules and techniques, this indicator will allow you to create (or enhance) your own powerfu
This multi time frame and multi symbol indicator identifies fractals patterns. As a bonus it can also scan for Parabolic SAR (pSAR) trend changes. Combined with your own rules and techniques, this indicator will allow you to create (or enhance) your own powerful system. Features Can monitor all symbols visible in your Market Watch window at the same time. Apply the indicator to just one chart and instantly monitor the entire market. Can monitor every time frame, from M1 to MN, and sends you a
Filtrer:
ZERO9898
1791
ZERO9898 2024.01.25 12:24 
 

L'utilisateur n'a laissé aucun commentaire sur la note

Poller 54
524
Poller 54 2023.12.03 02:26 
 

Very useful indicator. Easy to spot supply and demand zones in the main window. Using it for scalping. Well working, even in the 1M Timeframe. Highly recommended, for that price!

Johan Julien Aubry
855
Johan Julien Aubry 2023.02.12 11:39 
 

Powerfull indicator, very cheap and with a lot of possibilities to customise settings. Can be used for entry points or to confirm other entries. Well documented and EA compatible. Jan is really helpful and very reactive. I totally recommend this product!

cubetrader33
618
cubetrader33 2022.11.08 02:28 
 

Best demand and supply indicator, recommended 100 %. For what it does the price is too low.

Répondre à l'avis
Version 1.7 2024.01.22
*** IMPORTANT - Please always make a backup of the existing indicator (the .ex5 file) before you make the update ***

This is not a mandatory update. Please only update if you are experiencing problems with the indicator after the new Metatrader build 4150
Version 1.6 2023.04.21
*** IMPORTANT - Please always make a backup of the existing indicator (the .ex5 file) before you make the update ***

Change log:
- various bug fixes in the divergence detection mechanism
- added Three line strike to the list of candle patterns
- fixed an issue with the morning/evening star candle patter scanning
- added Bollinger bands filter as an alternative to RSI
- added a new type of alert when price is close to (approaching) a zone. ATR or points can be used as offset value
Version 1.5 2023.04.06
*** IMPORTANT - please always make a backup of the existing indicator (the .ex5 file) before you make an update ***

Change log:
- fixed an issue with the drawing of trend lines when supply/demand was disabled (regular top/bottoms only)
Version 1.4 2023.02.11
*** IMPORTANT - please always make a backup of the existing indicator (the .ex5 file) before you make an update ***

Change log:
- bug fixe
Version 1.3 2023.02.07
*** IMPORTANT - please always make a backup of the existing indicator (the .ex5 file) before you make an update ***

Change log:
- various bug fixes
Version 1.2 2023.02.06
*** IMPORTANT - please always make a backup of the existing indicator (the .ex5 file) before you make an update ***

Change log:
- added support for one nested zone (zone on other time frame than the current)
- added reverse breakout logic from zone based on Hull moving average color change and/or 4 different candle patterns. An alert will be sent and an arrow drawn on the chart
- removed the non functional option to use the RSI filter on the second extremum (at zone test)
- price raised from $30 to $49
Version 1.1 2022.02.23
- bug fix