Ticks Momentum
- Indicateurs
- Andrej Nikitin
- Version: 1.12
- Mise à jour: 18 novembre 2021
- Activations: 5
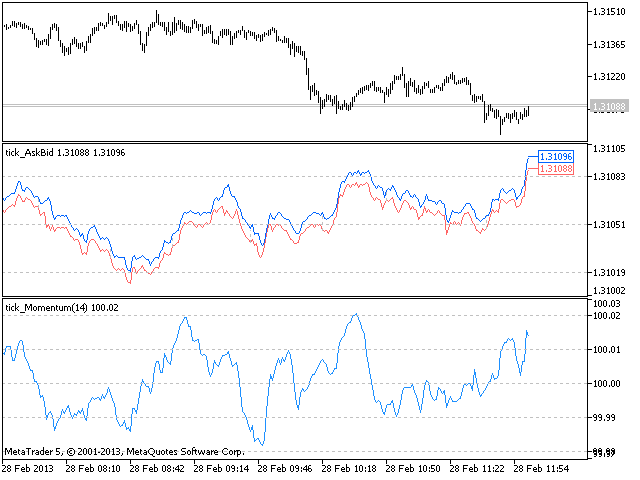
The Momentum indicator drawn using a tick chart.
After launching it, wait for enough ticks to come.
Parameters:
- period - period of the indicator calculation.
- levels count - number of displayed levels (no levels are displayed if set to 0)
- calculated bar - number of bars for the indicator calculation.