Golden Limit
- Indicateurs
- Renato Fridschtein
- Version: 2.11
- Mise à jour: 7 août 2022
- Activations: 8
There are no limits!
Golden Limit is the ultimate indicator to get clear and easy readings of price movements on charts.
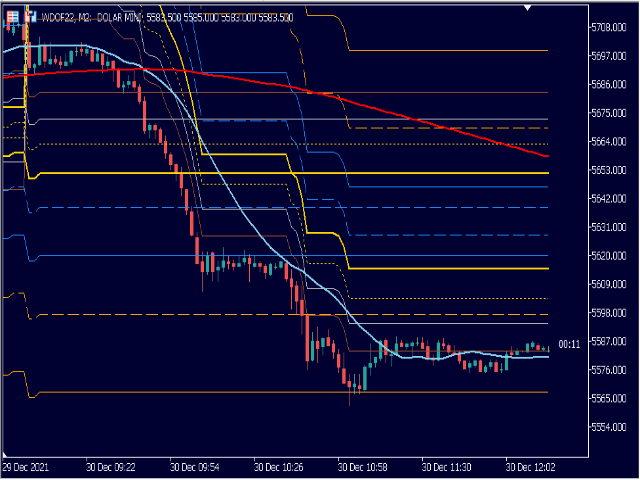
It projects support and resistance ranges, calculated by statistical models involving Price Action and the Fibonacci sequence, revealing in advance the behavior of prices and the best places to trade and not to trade.
It also has two moving averages to help choose the best entries.
The Golden Limit method was created from a proven model. In summary:
We use the names of precious metals for Limits to make the method easier to understand.
Every day at the open, the indicator projects the initial limits of support and resistance.
Next, the price seeks to make a top or a bottom close to one of the first two projected ranges: copper or silver.
Then the price changes direction and goes to the golden limit. For some assets, this happens almost every day (over 95%). Hence the name of the method.
From there, the price can continue to the next limits or start reversing, always going from one limit to another (non-consecutive).
Usually, this is the biggest/best movement the prices get in that day.
This behavior is observed in most symbols and timeframes.
Parameters
Active Resources:Double click on the value to trigger or hide the resource.
Audible Warning: an audio message that sounds when the indicator is turned on.
Supports and Resistances: shows the limit ranges for support and resistance.
20-period and 200-period Simple Moving Averages (SMA): select NO to hide the averages.
Candle Time Left: Shows the time left for the current bar to finish.
General Settings
Initial Value: Value used for the Limits calculation. Each asset has its own value.*
Offset (1 to 10): Used for times greater than 10 minutes to adjust the Limits.
Time Remaining Color: defines the color that will be used to show this resource.
Top/Bottom Weekly Reset: YES will do limit calculations based on week instead of day. It only affects graph times less than one hour (H1).
Colors
The trader can adjust the colors and styles of the limits and averages lines as desired and even hide each line individually by selecting None.
*NOTE: Contact us to learn more about the Golden Limit Method.
Author: Renato Fridschtein, software developer for over 35 years and trader for over 10. Has been creating indicators and investment robots since 2020.


