Supply Demand Dashboard MT5
- Indicateurs
- Jan Flodin
- Version: 1.8
- Mise à jour: 18 novembre 2023
- Activations: 10
Cet indicateur de tableau de bord d'offre et de demande à plusieurs périodes et à plusieurs symboles envoie des alertes lorsque le prix a atteint une zone d'offre/demande. Il est également possible de l'utiliser pour être alerté des doubles hauts/bas réguliers au lieu des zones. Il peut être utilisé avec toutes les plages horaires de M1 à MN. Un maximum de 9 périodes peuvent être affichées dans le tableau de bord en même temps. Il est possible d'utiliser des filtres RSI, divergence (MACD, RSI ou Awesome) et des modèles de bougies (pin bar, engloutissant, pince à épiler et étoile du matin/du matin) pour filtrer uniquement les configurations les plus fortes. Combiné à vos propres règles et techniques, cet indicateur vous permettra de créer (ou d'améliorer) votre propre système puissant.
À la fin du blog du produit, vous pourrez télécharger le code source d'un exemple de conseiller expert (EA) qui utilise la fonction iCustom() pour obtenir les signaux commerciaux de l'indicateur. Même si l'EA est entièrement fonctionnel, l'objectif principal est d'utiliser le code et de le coller dans votre propre EA développé ou d'ajouter votre propre logique d'entrée/sortie supplémentaire dans cette EA. Compte tenu de mon temps limité, je ne pourrai fournir aucun support de programmation. Mes excuses.
Caractéristiques
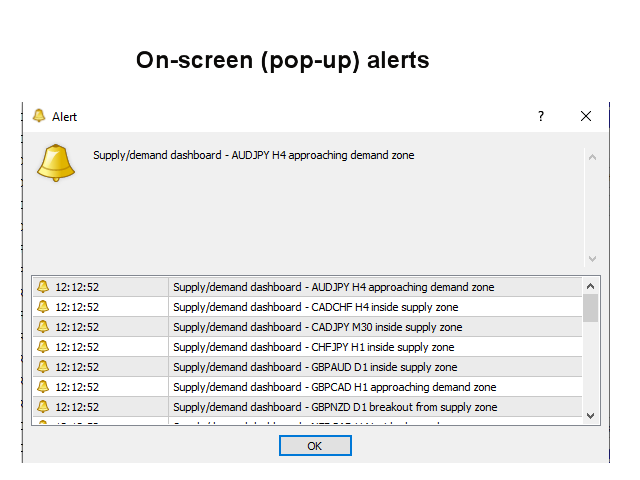
- Il suffit de placer l'indicateur sur un graphique et vous recevrez une alerte de tout nouveau signal apparaissant dans le tableau de bord. Tous les types d'alertes natives de Metatrader sont pris en charge.
- Effectue en permanence un tri par rang dans le tableau de bord. Il est cependant possible de désactiver ce tri pour faciliter la recherche d'un symbole spécifique. Les symboles seront alors visibles dans le même ordre qu'ils ont été saisis dans le paramètre Symboles ou dans l'ordre dans lequel ils sont visibles dans la fenêtre Market Watch.
- En cliquant à l'intérieur d'un rectangle, un nouveau graphique sera ouvert avec le symbole et la période en question. La zone (ou ligne supérieure/inférieure) sera dessinée sur ce graphique.
- L'indicateur peut écrire les signaux dans des variables globales qui peuvent être utilisées par un Expert Advisor pour le trading automatique.
Paramètres d'entrée
S'il vous plaît trouver la description et l' explication des paramètres d'entrée ici.
Important
L'indicateur doit être placé sur un graphique M5, un graphique propre (vide) sans aucun autre indicateur ou Expert Advisor dessus qui pourrait interférer avec le tableau de bord. Veuillez également noter que cet indicateur n'est pas pris en charge dans le testeur de stratégie. À cette fin, vous pouvez utiliser l'Expert Advisor mentionné ci-dessus. Le tableau de bord sera chargé dans une fenêtre d'indicateur qui couvrira automatiquement l'ensemble du graphique. 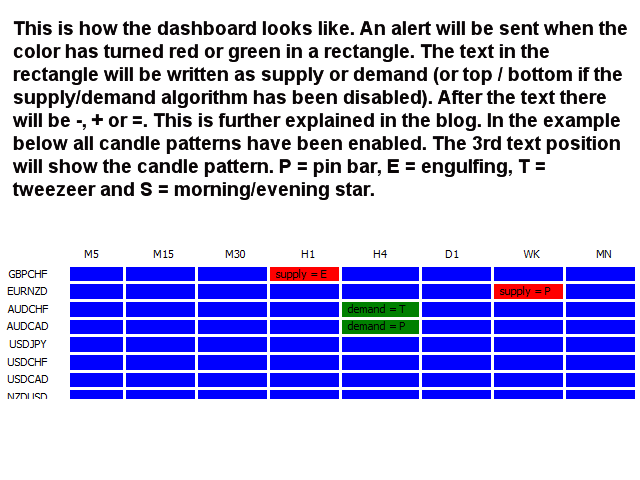
very good product and very good customer service