Indicator 4Level 2Channel 10Strategy
- Indicateurs
- Shaban Mir Fazlolah Oreynab
- Version: 1.0
- Activations: 5
Supply and demand
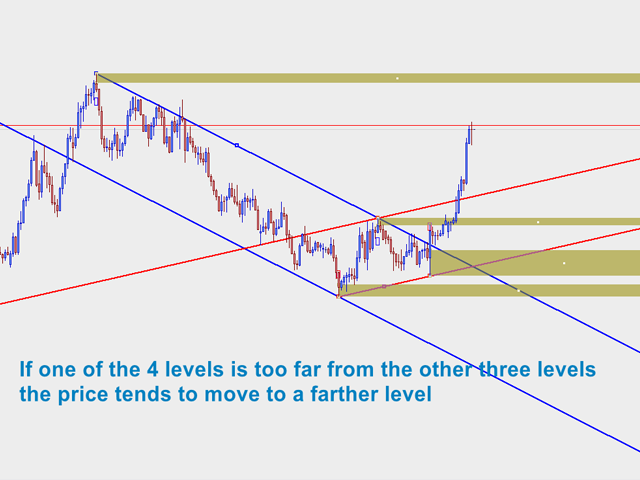
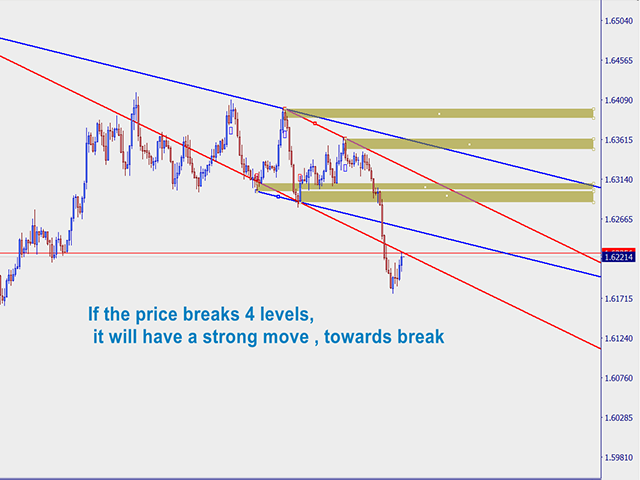
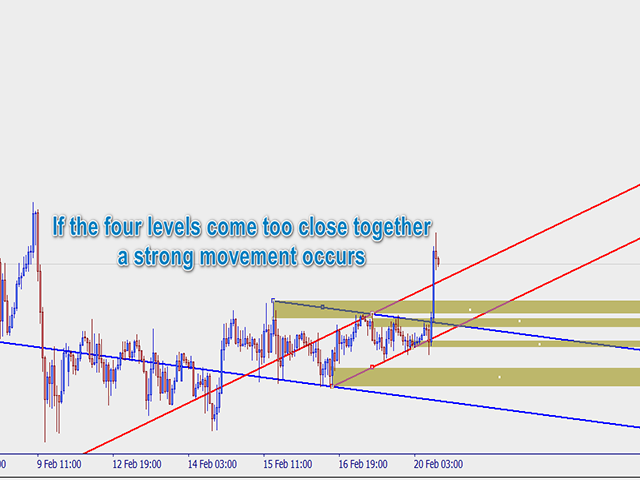
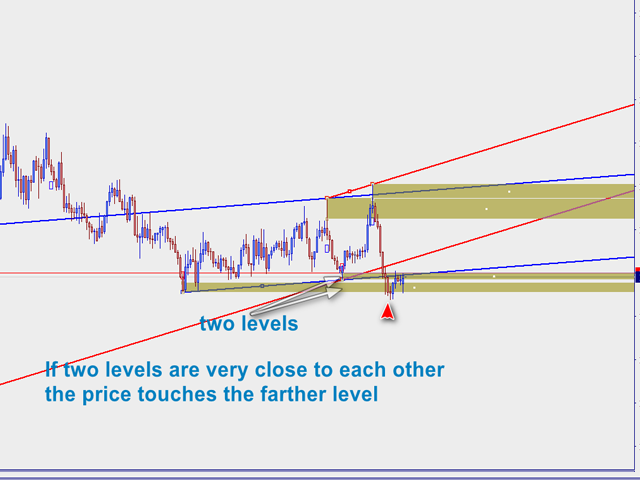
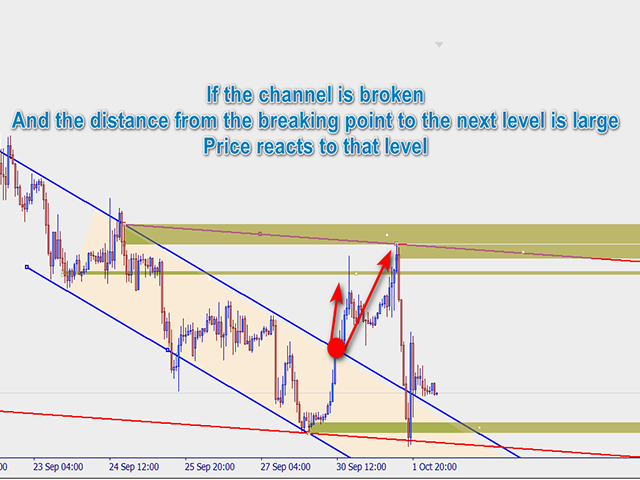
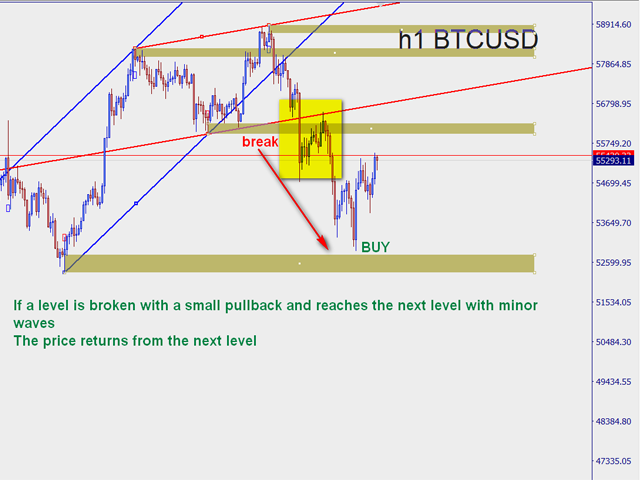
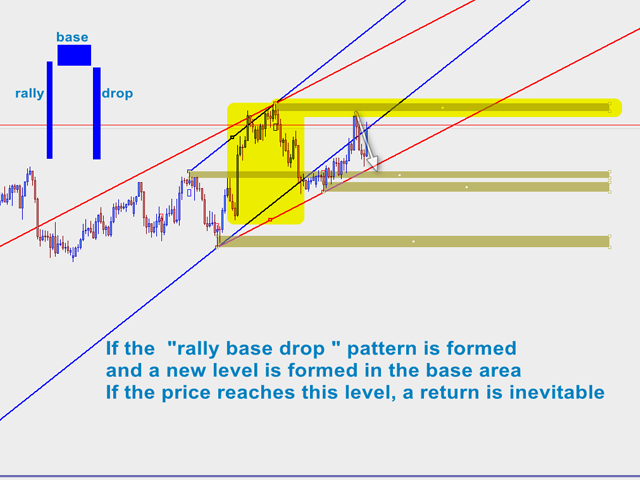
In all indicators that have the task of drawing support and resistance, the number of levels is so high that it causes a trader to make a mistake. We draw the last 4 important and valid levels for you using the Price Action method
These surfaces are not easily broken and their breaking is done with long and powerful candlesticks
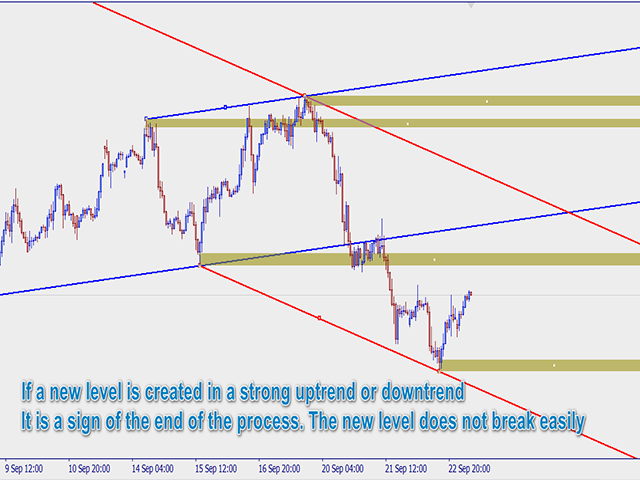
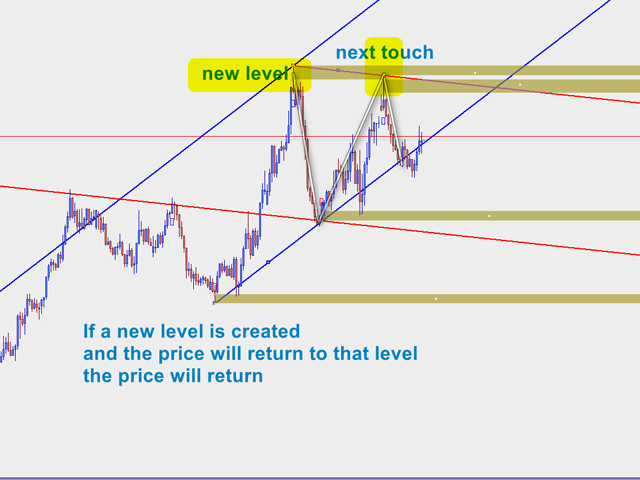
Sometimes traders draw levels and wait for the price to reach those levels, but new levels may be created between the previous two levels in the future and the trader will not consider that new level if the chart needs to be re-examined.
This indicator constantly updates the levels and if a new level is created, it deletes all the previous lines to check the chart trader again.
channels
We draw two valid channels for you. Sometimes the channel is not drawn correctly and this is because there is no standard channel in the chart.
If you feel it is a standard channel, use it in your analysis
Conclusion
This indicator is a good assistant for you. If you have a strategy to get a signal, you can combine with this indicator.
In the photos and youtube clip , we teach 10 trading strategies or rules with this indicator. These strategies can be used in any time frame. It just needs practice. Maybe you can find the 11 rule.