Tick Speed Free MT5
- Indicateurs
- John Louis Fernando Diamante
- Version: 1.0
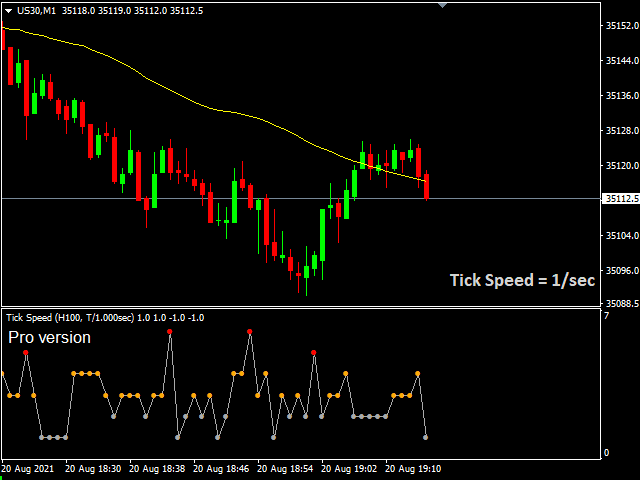
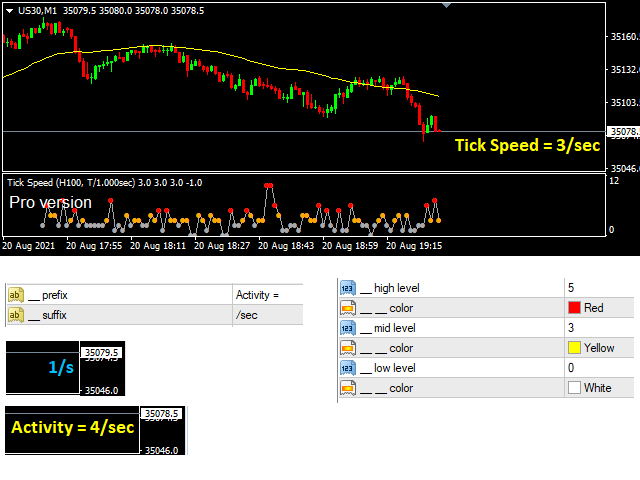
Tick Speed Free povides a on-chart label of tick speed to allow you to see the ebb and flow of market activity. Observing rises and falls in tick speed may allow you to better time entries to reduce slippage and re-quotes.
Options include:
- colores for low-mid-high tick speeds
- placement and styling
- prefix & suffix to customise the speed label
Troubleshooting:
- Note, in the tester environment, tick timings are limited to what is supplied by the tester environment and it's speed
- If there are any issues or suggestions for the indicator, please comment and let me know. The feedback will be noted and considered in future products and updates.