Abiroid MA Stack
- Indicateurs
- Abir Pathak
- Version: 1.7
- Mise à jour: 8 juin 2023
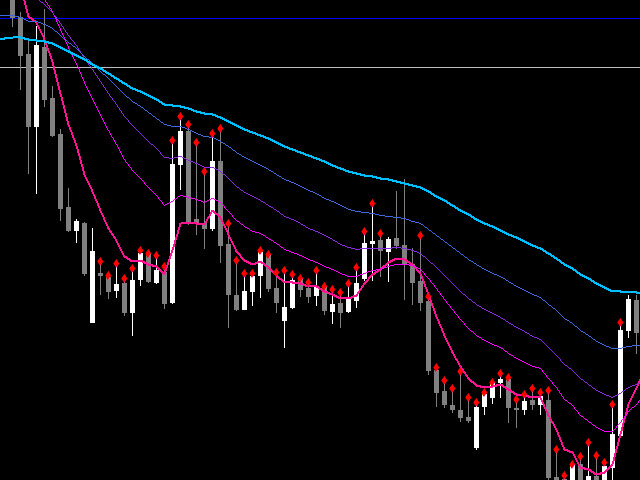
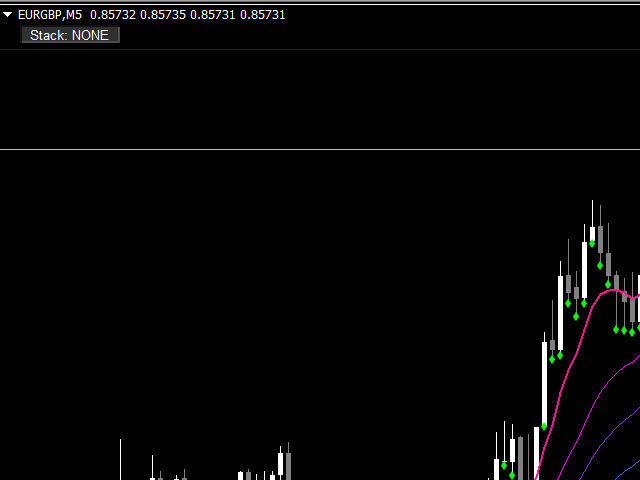
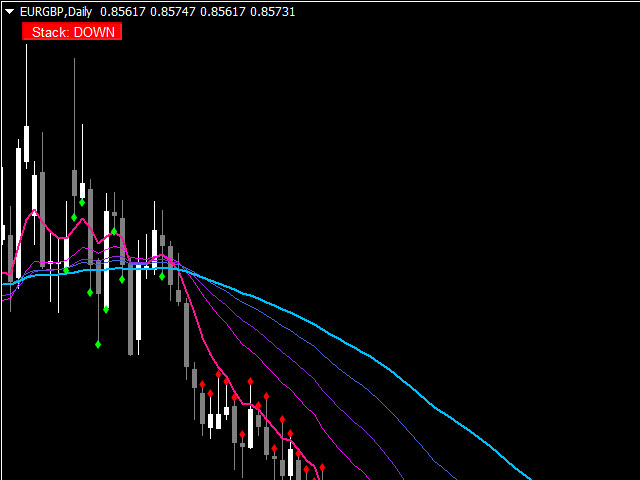
Moving Average Rainbow Stack:
- Free: Single Currency & Single Timeframe MA Stack
Very useful for finding current and higher timeframe trends. Best suited for long term trend based trading.
Use fewer MAs for quick scalping. And not suitable during low volatility. Only use during high volatility and steady trending markets.
Use this to enhance your existing Trend based strategies to find best trends.
Read detailed description
https://abiroid.com/product/abiroid-ma-stack
Available MTF and Scanner versions.


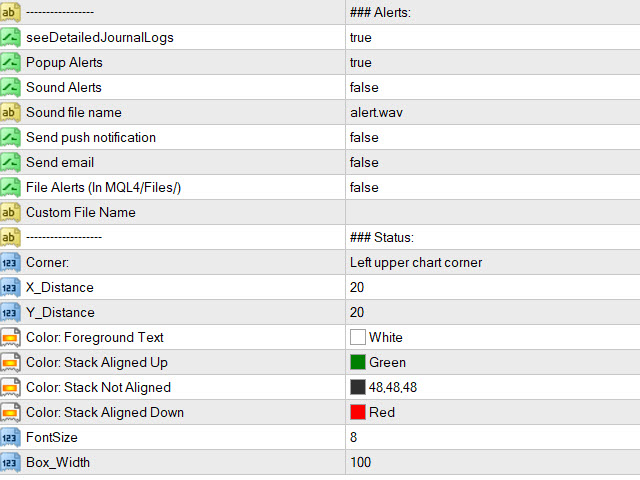

Abir you are really great in supporting your products and thank you for this very well designed indicator. This indicator is all I need to scan the market and find out which currencies are trending or ranging in only one screen. If a trader is using the moving average strategy to trade then this indicator is a must have. It is a unique indicator in the market because it can alert you when the cross takes place and then it will keep informing you how many points the market has moved every minute. I use 2 moving averages to alert me when they cross. If that happened then I have to pay attention to the trading opportunity that is about to take place. This indicator saved me a lot of time and effort to scan the market and has helped me to improve my trading results. Thank you very much Abir for this great indicator.