Midas VWAP
- Indicateurs
- Paulo Henrique Faquineli Garcia
- Version: 1.1
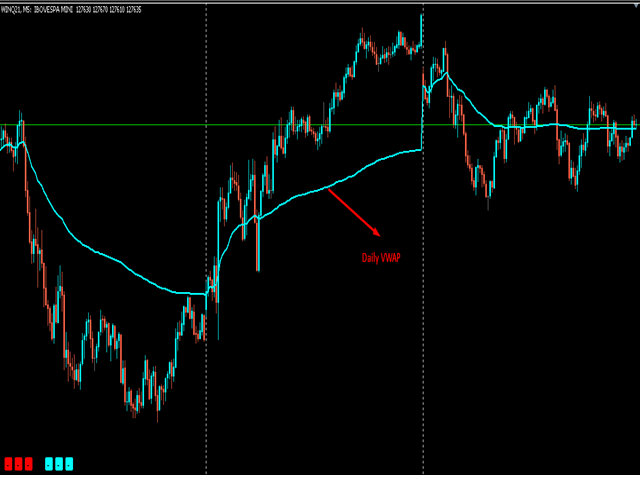
Volume Weighted Average Price (VWAP) is a trading benchmark commonly used by Big Players that gives the average price a Symbol has traded throughout the day. It is based on both Volume and price.
This indicator contains Daily VWAP and MIDAS' VWAP, which means you are able to anchor the beggining of MIDAS' calculations and, therefore you will be able to use this methodology to study price versus volume moves after anchor point.
You will be able to anchor up to 3 HIGH MIDAS VWAP's and 3 LOW.
Wish the best!
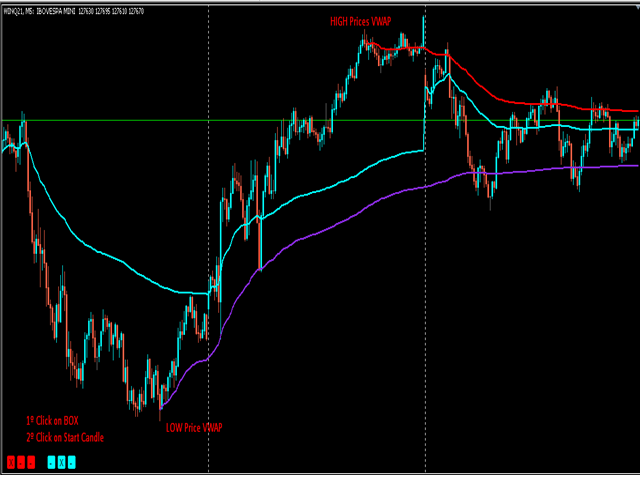
É um bom indicador. Sentia falta de algo assim. Só não compreendi a diferença entre os High e Low buttons. Imaginei que os high traçariam a vwap pela máxxima e os low pela mínima. Mas ambos calculam a vwap típica podendo usar qualquer um deles.