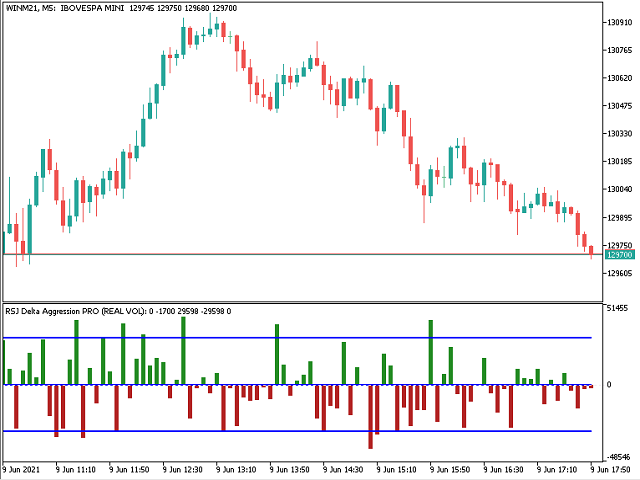
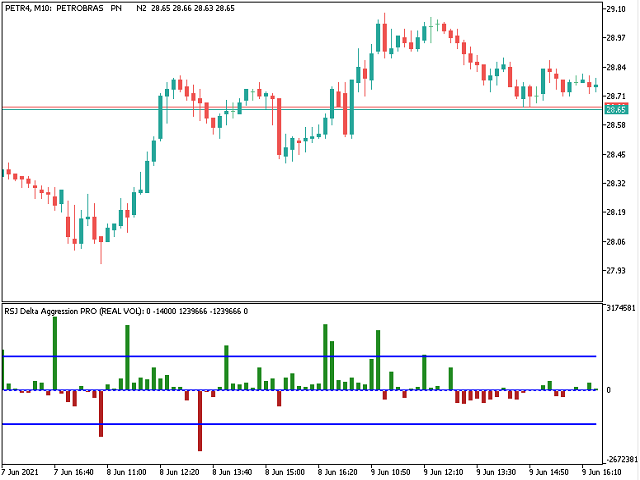
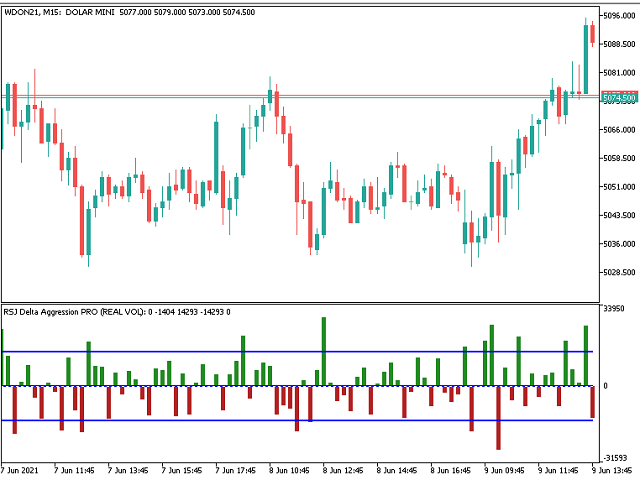
Delta Aggression Volume PRO
- Indicateurs
- JETINVEST
- Version: 3.0
- Mise à jour: 30 janvier 2024
- Activations: 20
Delta Aggression Volume PRO is an indicator developed to monitor the strength and continuity of the aggression volume of sell and buy negotiations.
Note: This indicator DOES NOT WORK for Brokers and/or Markets WITHOUT the type of aggression (BUY or SELL). Cryptocurrencies and Forex do not provide this type of data, that is, it does not work with them.
O Delta Agrression Volume PRO has features that allow you to view beyond the delta volume of the day.
Operation
- Multi symbols (those who provides type of aggression)
- Multi timeframes
- Renko charts and Graph charts
Settings
- It is possible to set the Volume Type:
- Real Volume (in this mode, the volumes traded in each asset transaction will be accounted)
- Ticks Volume (in this mode, the number of transactions of the asset will be counted.)
- It is possible to define the starting time of the calculations:
- CURRENT_DAY
- LAST_DAY
- LAST_TWODAYS
- LAST_FOURDAYS
- LAST_WEEK
- LAST_MONTH
- LAST_6MONTHS
- LAST_YEAR
- LAST_2YEARS
- ALL_AVAILABLE_DAYS
- It is possible to set the Delta Aggression channel range:
- Calculation Type:
- Linear Regression
- Standard Deviation
- Calculation Period
- It is possible to set the Volume moving average:
- Method: SMA / EMA / SMMA / LWMA
- Period
Resources
- It has 2 viewing modes :
- PLOT_ALL : Plots total volume + volume moving average + volume delta + channel lines
- PLOT_DELTA : Plots volume delta + channel lines
- It has 5 configurable alerts :
- Delta changes TREND Color
- Delta crosses Channel Up Line
- Delta crosses Channel DownLine
- Delta crosses Configurable Level
- Volume crosses Moving Average
- For each alert it is possible to configure:
- Popup
- Sound(There are 13 types of sound available.)
- Smartphone notification
- Popup and Sound
- Popup and Smartphone notification
- Sound and Smartphone notification
- Popup, Sound and Smartphone notification
Integration with Expert Advisors or other Indicators
- There are 10 buffers available for access and integration with expert advisors or other indicators, the buffers of aletrs are filled even with the alerts turned off, they are :
- Buffer ID 3: Total Volume Value
- Buffer ID 7: Delta Value
- Buffer ID 9: Channel Up Line Value
- Buffer ID 10: Channel Down Line Value
- Buffer ID 11: Moving Average Value
- Buffer ID 17: Alert 1
- Buffer ID 18: Alert 2
- Buffer ID 19: Alert 3
- Buffer ID 20: Alert 4
- Buffer ID 21: Alert 5
- The Buffers referring to the 5 Alerts can contain the following values:
- Downtrend: (-1)
- Undefined trend: (0)
- Uptrend: (+1)
If you still have questions, please contact me by direct message: https://www.mql5.com/en/users/robsjunqueira/


L'utilisateur n'a laissé aucun commentaire sur la note