TheStrat TFC Monitor MT5
- Indicateurs
- Robert Gerald Wood
- Version: 1.5
- Mise à jour: 23 novembre 2023
- Activations: 10
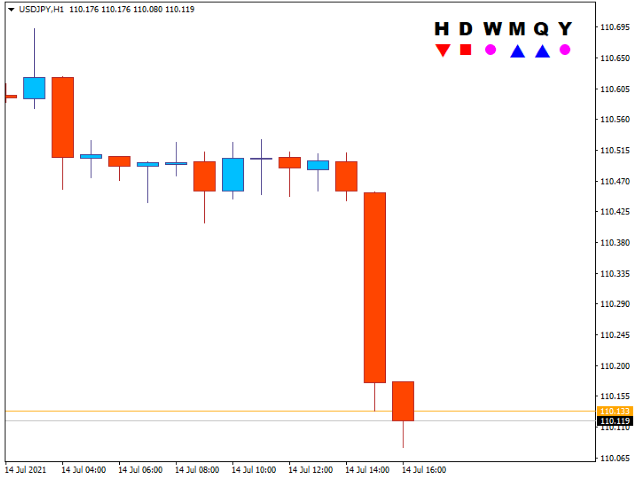
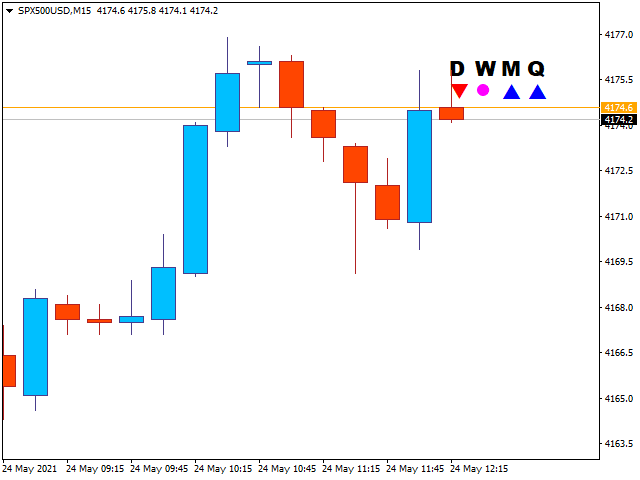
Lorsque vous négociez avec The Strat , il est important de garder un œil sur plusieurs délais.
Cet indicateur affichera l'état quotidien, hebdomadaire, mensuel et trimestriel de la bougie actuelle pour chaque période.
- Une icône en forme de cercle indique que la bougie sur cette période est actuellement un Inside, ou Type 1 dans la terminologie TheStrat. Une bougie Inside Day consolide l'action des prix, et nous recherchons une cassure de la fourchette.
- Une icône Triangle, pointant vers le haut ou vers le bas, est une bougie de tendance, ou Type 2 dans la terminologie TheStrat. Une bougie de tendance peut être haussière ou baissière, indiquant qu'elle est sortie de la fourchette de bougies précédente et qu'elle tend maintenant dans une direction.
- Une icône carrée est une bougie extérieure, ou Type 3 dans la terminologie The Strat. Cela indique deux choses, une que le prix est indécis quant à la direction sur cette période, et probablement assez instable, et deuxièmement, que sur des périodes plus courtes, il existe probablement de bonnes opportunités pour négocier de courtes inversions. Le carré sera de couleur haussière ou baissière pour indiquer quel camp est actuellement en train de gagner.
Les couleurs utilisées pour chaque icône peuvent être configurées selon vos goûts, et la taille du texte et des icônes est également configurable.
PARAMÈTRES
Sélections de délais
AfficherHeure
Lorsque True, affiche l'état horaire de la bougie.
Afficher tous les jours
Lorsque True, affiche l'état quotidien de la bougie.
AfficherHebdomadaire
Lorsque True, affiche l'état hebdomadaire de la bougie.
AfficherMensuel
Lorsque True, affiche l'état mensuel de la bougie.
AfficherTrimestriel
Lorsque True, affiche l'état de la bougie trimestrielle.
AfficherAnnuel
Lorsque True, affiche l'état annuel de la bougie.
Format d'affichage
À l'intérieur de la couleur de la police
La couleur à utiliser lors du dessin à l'intérieur des bougies (Type 1).
BullishFontCouleur
La couleur à utiliser lors du dessin des bougies à tendance haussière (Type 2) ou Extérieur (Type 3).
BearishFontCouleur
La couleur à utiliser lors du dessin des bougies à tendance haussière (Type 2) ou Extérieur (Type 3).
HeaderFontName
La police à utiliser pour les en-têtes des icônes d'état de la bougie.
Taille de police
La taille de la police à utiliser pour les titres. Cela contrôle également la taille globale de l'affichage de l'indicateur.

Great tool to see higher time frame confluence