TheStrat FTFC
- Indicateurs
- Robert Gerald Wood
- Version: 1.2
- Mise à jour: 16 juin 2021
- Activations: 5
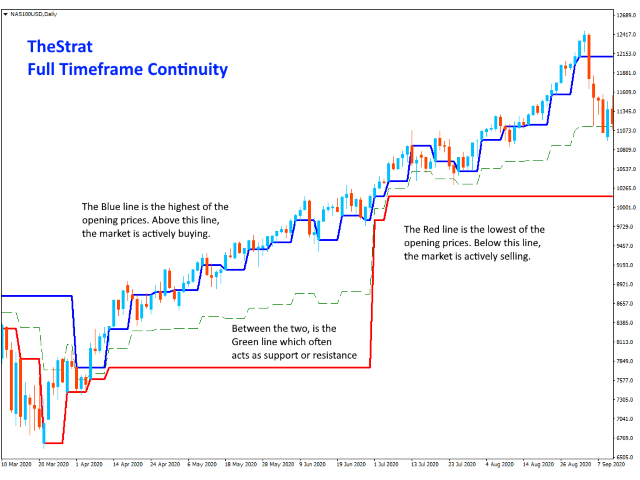
FTFC fait référence à Full Timeframe Continuity tel que défini par The Strat de Rob Smith.
Cet indicateur dessine deux lignes sur le graphique, l'une des plus élevées des niveaux d'ouverture trimestriels, mensuels, hebdomadaires, quotidiens ou horaires, et la seconde des plus basses de ces valeurs. Cela vous donne un canal au-dessus ou au-dessous duquel le trading est plus susceptible d'être très fortement dans une direction. Entre les lignes, l'action des prix sera plus agitée et vous pourrez utiliser des arrêts plus larges.
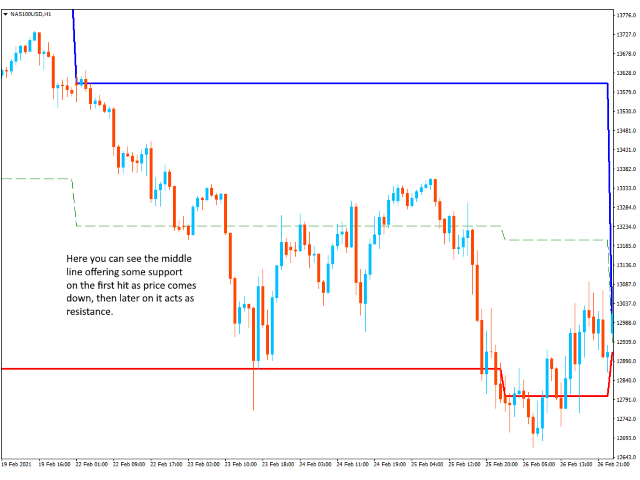
Une troisième ligne pointillée est également tracée pour montrer le point médian entre les hauts et les bas. C'est souvent un bon endroit pour trouver un support ou une résistance alors que le marché essaie de pousser le prix dans une certaine direction. Cette ligne peut être désactivée si vous le souhaitez en définissant la couleur sur AUCUN.
PARAMÈTRES
Inclure le niveau trimestriel
Vous permet de choisir d'inclure le prix d'ouverture trimestriel dans le calcul car certaines personnes préfèrent l'ignorer.
InclureCurrentTimeframeOpen
Lorsqu'il est vrai, si la période actuellement affichée est H1, D1, W1 ou MN1, l'indicateur inclura ces périodes ouvertes dans son calcul. Il s'agit d'un nouveau paramètre dans la dernière version de l'indicateur. Auparavant, le calcul n'incluait PAS la période actuelle ouverte, et cela n'est pas d'accord avec TheStrat.
Le paramètre est faux par défaut, de sorte que les utilisateurs existants ne sont pas affectés à moins qu'ils ne choisissent de l'activer.
MaxMilliSecondsToCalculate
Pour les graphiques avec beaucoup d'historique chargé (plus de 10 000 barres), cela limitera le temps d'initialisation de l'indicateur. Par défaut, le paramètre est de 1 500 millisecondes, soit 1,5 seconde. Si l'indicateur n'a pas réussi à effectuer tous ses calculs pour les barres historiques après cette période, il arrêtera d'essayer. Cela signifie que vous obtiendrez toujours un historique significatif, mais soyez assuré que cela ne provoquera pas l'arrêt de votre graphique.