• Aperçu
  • Avis (7)
  • Commentaires
  • Nouveautés

Markets Money Position Size tfmt5

3.83

This indicator uses the chart information and your inputs to display a calculated lot size and associated stop for long or short positions. It uses an ATR based percent volatility position sizing calculation and splits your account equity into two parts, each having its own risk percentage.

The concept behind "Market's Money" is using a lower risk percentage for your base account equity and then using a higher risk percentage for any equity above your base equity. This lets you potentially grow your account faster by using a higher risk percentage on your account profits while still maintaining a lower risk percentage on your initial capital. If your account is going through a drawdown and only the base equity threshold is available, the indicator will only use the risk percentage specified for that portion. As time goes along and your profits grow, you can change the amount specified in your base account equity and move some of the market's money to be your money to further protect it.

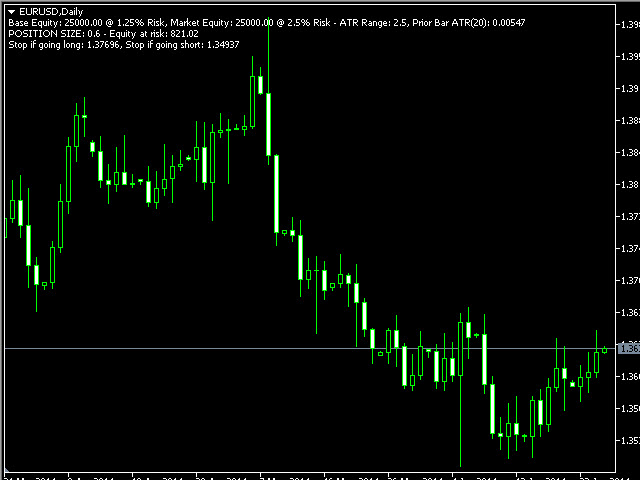
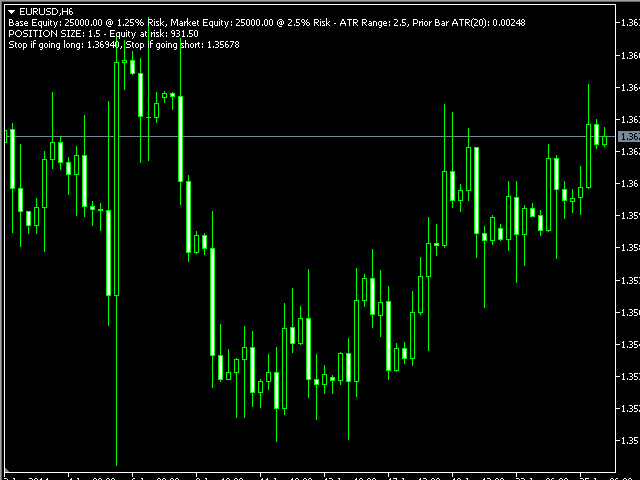
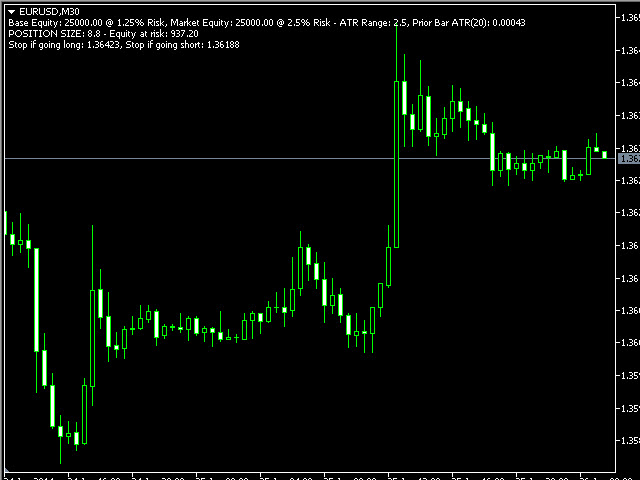
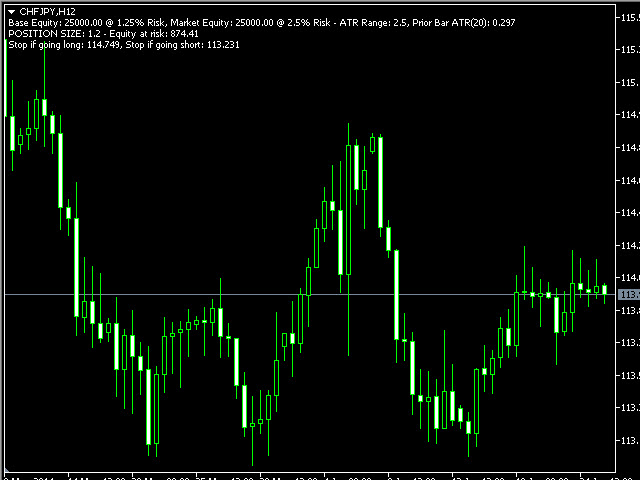
The indicator adds text directly to the chart to show you the inputs you have chosen including base equity, base risk %, market equity, market risk %, the ATR range input, the ATR value from the prior bar, the calculated position size, the account equity at risk if the position is stopped out (does not account for spreads, gaps, or slippage), and the stop levels if going long or short.

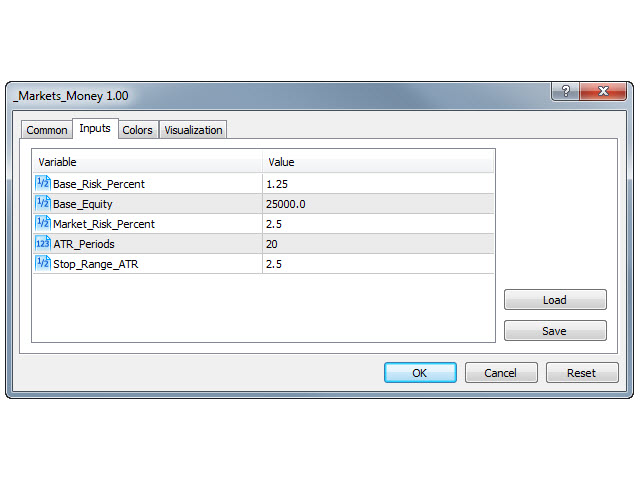
You can change the inputs to change your base risk %, base equity, market’s money risk %, how many bars are in the ATR, and the ATR range. The inputs include:

  • Base_Risk_Percent: The percent to be risked on the base equity in the calculation. If you want to risk 1%, enter 1 to this input. If you want to risk 1.75%, enter 1.75 to this input.
  • Base_Equity: The base equity that you want to separate from the rest of your account equity.
  • Market_Risk_Percent: The percent to be risked on the equity above your base equity. If you want to risk 2%, enter 2 to this input. If you want to risk 2.5%, enter 2.5 to this input.
  • ATR_Periods: The number of bars to be used in the ATR calculation.
  • Stop_Range_ATR: The number of multiples to be used to create the ATR range or stop level around the price. If this value is too small, you will have more whipsaws if the stop is too close. If this value is too large, the stop may be too far away and make the position size too low to be profitable.

% Volatility Position Size accounts for volatility, equalizes or normalizes positions no matter the currency pair, and keeps losses small with the integrated stop. You can easily find out what your position size should be based on your chosen risk tolerances between your base equity and above. The calculation uses the value of each tick on the chart and calculates the value if the price reaches the stop price. Based on this value, the calculation completes to limit the position to the amount you are willing to risk. As volatility increases, the indicator will display a smaller position size. As volatility decreases, the indicator will display a larger position size. Also, percent volatility position sizing will increase the position size as your account size grows based on your risk and will decrease your position size if your account size goes through a drawdown.

Summarized Calculation: (Account Value to Risk / ((ATR Distance / Tick Size) * Tick Value))

The calculation is then rounded down to match the Lot Increment size.

Caution:

  • If the ATR value is too low (for example M1 or M5 chart), the position size will be larger than you expect and you will need to increase the ATR Range input.
  • If you have another indicator that uses the chart comment function, only one will work on the chart at a time.
Avis 7
Ard Sluis
145
Ard Sluis 2022.11.14 08:01 
 

GREAT tool. very non-intrusively positioned on the chart. You plug in the risk you are comfortable with, the indicator tells you the preferred position size and stop loss in case to want to go Long or Short. This is a great tool in helping you with risk management. I looked at a couple of these indicators and I like this one the best by far! Thank you for your time and expertise to put this one together!

Produits recommandés
This indicator uses the chart information and your inputs to display the lot size and associated stop for long or short positions. It uses an ATR based percent volatility position sizing calculation. You can use this indicator to learn more about a better position size calculation than a fixed lot system. The indicator adds text directly to the chart to show you the current position size calculation, the risk % input, the ATR Range input, the ATR value from the prior bar, the account equity at r
FREE
Show Pip Value and Spread on Chart as Object or Comment. User can select to display Pip Value and/or Spread by object on main Chart, or show both only as Comment lines on chart. Object Color, Font face and Size  and also which corner to show, may change by user.  Pip Value calculated in accordance of input Lot size , Default is 1 lot . Can use at all currency pairs , Gold , Silver and most other charts.
FREE
Ind5 InfoPad Information Panel
Vladislav Andruschenko
4.86 (7)
INFOPad est un panneau d'information qui crée des informations sur la paire de devises sélectionnée dans le terminal MetaTrader 5. Il y a 5 fonctions de cet indicateur : Affiche les informations principales et principales sur le symbole sélectionné : Ask BID, Spread, Stop Level, Swap, Tick value, Commissions ; Affiche les objectifs futurs de la cible SL et de la cible TP (le nombre de points du stop loss et du take profit établis, le montant en dollars); Il montre le bénéfice reçu pour les péri
FREE
Le Matrix Arrow Indicator Multi Timeframe Panel MT5 est un complément gratuit et un atout majeur pour votre Matrix Arrow Indicator MT5 . Il montre le signal Matrix Arrow Indicator MT5 actuel pour 5 périodes personnalisées par l'utilisateur et pour 16 symboles/instruments modifiables au total. L'utilisateur a la possibilité d'activer/désactiver l'un des 10 indicateurs standard dont se compose l' Indicateur de Flèche Matricielle MT5 . Tous les 10 attributs d'indicateurs standard sont également ré
FREE
A professional tool for trading - the divergence indicator between the RSI and the price, which allows you to receive a signal about a trend reversal in a timely manner or catch price pullback movements (depending on the settings). The indicator settings allow you to adjust the strength of the divergence due to the angle of the RSI peaks and the percentage change in price, which makes it possible to fine-tune the signal strength. The indicator code is optimized and is tested very quickly as par
FREE
A professional tool for trading - the divergence indicator between the MACD and the price, which allows you to receive a signal about a trend reversal in a timely manner or catch price pullback movements (depending on the settings). The indicator settings allow you to adjust the strength of the divergence due to the angle of the MACD peaks and the percentage change in price, which makes it possible to fine-tune the signal strength. The indicator code is optimized and is tested very quickly as p
FREE
The Analytical cover trend indicator is a revolutionary trend trading and filtering solution with all the important features of a trend tool built into one tool! The Analytical cover indicator is good for any trader, suitable for any trader for both forex and binary options. You don’t need to configure anything, everything is perfected by time and experience, it works great during a flat and in a trend. The Analytical cover trend indicator is a tool for technical analysis of financial markets
69 USD
This is a regression tree indicator for MT4/MT5. This indicator classificate nodes on the time period so that the deviation becomes smaller, and displays regression line and channel for each node. It's free! Attached CartDemo.ex4 and CartDemo.ex5 is a Demo version and has the following limitations: Method is RandomForest only Maximum number of bars is 200 Maximum number of trees is 2 Maximum tree depth is 2 Calculated waste lines are shown Not display correlation coefficients Fu
FREE
Description:  The Support and Resistance Levels Finder is an advanced tool designed to enhance technical analysis in trading. Featuring dynamic support and resistance levels, it adapts in real-time as new key points unfold on the chart, providing a dynamic and responsive analysis. Its unique multi-timeframe capability allows users to display support and resistance levels from different timeframes on any desired timeframe, offering a nuanced perspective, such as showing daily levels on a five-mi
FREE
SpreadMeter OGT Free
Dmitriy Gurenko
5 (1)
The indicator shows the current spread of the symbol, the minimum, average and maximum values for the current bar in the form of digital, analog and graphic indicators. Has two modes of operation: fixing the system spread, or calculating the spread as the difference between the "Bid" and "Ask" prices on each incoming tick. Parameters  The indicator has a single input parameter: Type of calculation  - type of spread calculation. It can take the following values:  System spread  - the spread value
FREE
A professional tool for trading - the divergence indicator between the  MACD and the price, which allows you to receive a signal about a trend reversal in a timely manner or catch price pullback movements (depending on the settings). The indicator settings allow you to adjust the strength of the divergence due to the angle of the  MACD peaks and the percentage change in price, which makes it possible to fine-tune the signal strength. The indicator code is optimized and is tested very quickly as
FREE
Multi-timeframe trend indicator based on the ADX / ADXWilder indicator with Fibonacci levels The indicator shows trend areas using ADX or ADXWilder indicator data from multiple timeframes. The impulse mode of the indicator allows you to catch the beginning of a trend, and several "Screens" with different timeframes allow you to filter out market noise. Fibonacci levels are added to the price chart, which have flexible settings. How the indicator works: if PDI is greater than NDI, then   it`
FREE
FractalEfficiencyIndicator   A ratio between 0 and 1 with the higher values representing a more efficient or trending market,  It is used in the calculation of Perry J. Kaufman Adaptive Moving Average (KAMA), dividing the price change over a period by the absolute sum of the price movements that occurred to achieve that change. The Fractal Efficiency or also known as Efficiency Ratio was first published by Perry J. Kaufman in his book   ‘Smarter Trading‘. This is mostly considered a filter for v
FREE
PZ Penta O MT5
PZ TRADING SLU
3.8 (5)
The Penta-O is a 6-point retracement harmonacci pattern which usually precedes big market movements. Penta-O patterns can expand and repaint quite a bit. To make things easier this indicator implements a twist: it waits for a donchian breakout in the right direction before signaling the trade. The end result is an otherwise repainting indicator with a very reliable trading signal. The donchian breakout period is entered as an input. [ Installation Guide | Update Guide | Troubleshooting | FAQ | A
FREE
Free automatic Fibonacci is an indicator that automatically plots a Fibonacci retracement based on the number of bars you select on the BarsToScan setting in the indicator. The Fibonacci is automatically updated in real time as new highest and lowest values appears amongst the selected bars. You can select which level values to be displayed in the indicator settings. You can also select the color of the levels thus enabling the trader to be able to attach the indicator several times with differe
FREE
Premium trend entry pro TZ Trade Logics, presents you,  the enhance version of Premium trend entry  This release, bring you much more relaxed trading state with advanced features for trend filtering and premium signal entry timings. For us, is not the creating of the product which matters! but continued maintenance and education to users. through our dedicated means of reaching to us, you will enjoy close guide on how to use the product and other relevant training related to trading.  This tradi
FREE
MT5 AccountInfoEA
Nikolaos Pantzos
3 (1)
Account Info EA It is a tool that presents on the graph all the positions of the account, and specific information concerning the positions, but also the account. It enables the user to have an image of his account at a glance. Use like any expert advisor. You can't attach it in the same chart with other expert advisor. It does not have the ability to open or manage positions. You can attach it on any chart and any timeframe.
FREE
Important Lines
Terence Gronowski
4.88 (25)
This indicator displays Pivot-Lines, preday high and low, preday close and the minimum and maximum of the previous hour. You just have to put this single indicator to the chart to have all these important lines, no need to setup many single indicators. Why certain lines are important Preday high and low : These are watched by traders who trade in a daily chart. Very often, if price climbs over or falls under a preday low/high there is an acceleration in buying/selling. It is a breakout out of
FREE
A professional tool for trading - the divergence indicator between the  Stochastic and the price, which allows you to receive a signal about a trend reversal in a timely manner or catch price pullback movements (depending on the settings). The indicator settings allow you to adjust the strength of the divergence due to the angle of the  Stochastic peaks and the percentage change in price, which makes it possible to fine-tune the signal strength. The indicator code is optimized and is tested ver
FREE
Lines Profit Loss MT5
Taras Slobodyanik
4.54 (13)
The indicator displays profit (loss) on the current symbol. You can freely drag and drop the line to display the current profit or loss. Parameters Calculation in money or in points — calculate the profit/loss in points or money. Add pending orders to calculate — take pending orders into account in calculations. Magic Number (0 - all orders on symbol) — magic number, if it is necessary to evaluate specific orders. Offset for first drawing (points from the average price) — offset of the line f
FREE
Are you tired of drawing trendlines every time you're analyzing charts? Or perhaps you would like more consistency in your technical analysis. Then this is for you. This indicator will draw trend lines automatically when dropped on a chart. How it works Works similar to standard deviation channel found on mt4 and mt5. It has 2 parameters: 1. Starting Bar 2. Number of bars for calculation The   starting bar   is the bar which drawing of the trend lines will begin, while the   number of bars for c
FREE
Reversal Composite Candles
MetaQuotes Ltd.
3.33 (21)
The idea of the system is to indentify the reversal patterns using the calculation of the composite candle. The reversal patterns is similar to the "Hammer" and "Hanging Man" patterns in Japanese candlestick analysis. But it uses the composite candle instead the single candle and doesn't need the small body of the composite candle to confirm the reversal. Input parameters: Range - maximal number of bars, used in the calculation of the composite candle. Minimum - minimal size of the composite can
FREE
Follow The Line MT5
Oliver Gideon Amofa Appiah
4.36 (28)
This indicator obeys the popular maxim that: "THE TREND IS YOUR FRIEND" It paints a GREEN line for BUY and also paints a RED line for SELL. (you can change the colors). It gives alarms and alerts of all kinds. IT DOES NOT REPAINT and can be used for all currency pairs and timeframes. Yes, as easy and simple as that. Even a newbie can use it to make great and reliable trades. NB: For best results, get my other premium indicators for more powerful and reliable signals. Get them here: https://www.m
FREE
The indicator identifies when a divergence occurs between price and an indicator or oscillator. It identifies both regular and hidden divergences. Combined with your own rules and techniques, this indicator will allow you to create (or enhance) your own powerful system. Features Can detect divergences for the following oscillators/indicators:   MACD, OsMA, Stochastics, RSI, CCI, RVI, Awesome, ADX, ATR, OBV, Composite index, MFI and Momentum. Only one oscillator/indicator can be selected. Draws
FREE
RsiCrossSma
Thiago Gomes Cavalcanti
5 (2)
Esse indicador é a combinação do  RSI (IFR) com Média Móvel Simples aplicada o RSI em um único indicador para facilitar a criação de alguma estratégia. Fiz esse indicador para que um único indicador contenha os buffer necessários para implementar alguma EA. Descrição dos Buffers para o EA, Buffer 0 -> Valor do RSI Buffer 1 -> Valor da média móvel aplicada ao RSI
FREE
A professional tool for trading - the divergence indicator between the  RVI and the price, which allows you to receive a signal about a trend reversal in a timely manner or catch price pullback movements (depending on the settings). The indicator settings allow you to adjust the strength of the divergence due to the angle of the  RVI peaks and the percentage change in price, which makes it possible to fine-tune the signal strength. The indicator code is optimized and is tested very quickly as p
FREE
BoxInside MT5
Evgeny Shevtsov
5 (4)
This indicator calculates the volume profile and places labels that correspond to the VAH, VAL and POC levels, for each candle individually. Indicator operation features The indicator works on the timeframes from M3 to MN, but it uses the history data of smaller periods: M1 - for periods from M3 to H1, M5 - for periods from H2 to H12, M30 - for the D1 period, H4 - for the W1 period, D1 - for the MN period. The color and location of the VAL, VAH and POC labels on the current candle are consider
FREE
AdaptiveCCiMt5
Francis Dube
4 (4)
The Commodity Channel Index computes the deviation of the typical price of each bar from the average price over a particular time period. Multiplying the median deviation by 0.015 facilitates normalization, which makes all deviations below the first standard deviation less than  -100, and all deviations above the first standard deviation more than 100. This adaptive version is based on the indicator described by John Ehlers, in the book Rocket Science for traders. The indicator uses the homodyne
FREE
ATR Moving Average
David Gitau Gakunga
5 (3)
ATR Moving Average draws a moving average of the standard Average True Range( ATR ) in the same window. Settings Name Description ATR period Set Price per iod for ATR calculation ATR level Set ATR value for thresholding( only whole number, ignore leading zeros e.g. 0.00089 = 89 ) MA Period Set moving Average Period MA Method Set moving average method( Simple, Exponential, Smoothed and Linear Weighted ) MA Shift Set moving average shift Enable Alerts ? Generate Alert when ATR crosses
FREE
The Moving Averages On-Off  let you  control the indicator  using  the keyboard  or a  button . You can choose if you want the indicator always shown or always hided while switching among different time frames or financial instruments .    --->  This indicator is part of Combo Indicator OnOff It's possible to  setup three Moving Averages : Short ,  Medium ,  Long   Input You can customize the price type used for calculation : close, open, high, low, median price, typical price, weighted It
FREE
Les acheteurs de ce produit ont également acheté
Description: First of all Its worth emphasizing here that this Trading System is Non-Repainting, Non-Redrawing and Non-Lagging Indicator, Which makes it ideal from both manual and robot trading.  For limited time only 50% OFF,  Now 100$ only. 4 purchases left & the price increases to 200$ Contact me right after the purchase to share with you the user manual. The “Smart Trend Trading System MT5” is a comprehensive trading solution tailored for new and experienced traders. It combines over 10 pre
100 USD
Maintenant 147 $ (augmentant à 499 $ après quelques mises à jour) - Comptes illimités (PCS ou Mac) Manuel d'utilisation RelicusRoad + Vidéos de formation + Accès au groupe Discord privé + Statut VIP UNE NOUVELLE FAÇON DE REGARDER LE MARCHÉ RelicusRoad est l'indicateur de trading le plus puissant au monde pour le forex, les contrats à terme, les crypto-monnaies, les actions et les indices, offrant aux traders toutes les informations et tous les outils dont ils ont besoin pour rester renta
147 USD
Trend Screener Pro MT5
STE S.S.COMPANY
4.88 (52)
Indicateur de tendance, solution unique révolutionnaire pour le trading et le filtrage des tendances avec toutes les fonctionnalités de tendance importantes intégrées dans un seul outil ! Il s'agit d'un indicateur multi-période et multi-devises 100 % non repeint qui peut être utilisé sur tous les symboles/instruments : forex, matières premières, crypto-monnaies, indices et actions. Trend Screener est un indicateur de suivi de tendance efficace qui fournit des signaux de tendance fléchés avec des
50 USD
Top indicator for MT5   providing accurate signals to enter a trade without repainting! It can be applied to any financial assets: forex, cryptocurrencies, metals, stocks, indices .  MT4 version is here It will provide pretty accurate trading signals and tell you when it's best to open a trade and close it. Watch  the video  (6:22) with an example of processing only one signal that paid off the indicator! Most traders improve their trading results during the first trading week with the help of
125 USD
ICT, SMC, Smart Money Concept, Support and Resistance, Trend Analysis, Price Action, Market Structure, Order Blocks, Breaker Blocks, Momentum Shift, Strong Imbalance, HH/LL/HL/LH, Fair Value Gap, FVG, Premium & Discount Zones, Fibonacci Retracement, OTE, Buyside Liquidity, Sellside Liquidity, Liquidity Voids, Market Sessions, NDOG, NWOG,Silver Bullet,ict template Dans le marché financier, une analyse de marché précise est cruciale pour les investisseurs. Pour aider les investisseurs à mieux c
39 USD
Owl Smart Levels MT5
Sergey Ermolov
4.41 (32)
Version MT4   |  Comment installer?   |   FAQ L' indicateur Owl Smart Levels est un système de trading complet au sein d'un seul indicateur qui comprend des outils d'analyse de marché populaires tels que les fractales avancées de Bill Williams , Valable ZigZag qui construit la structure d'onde correcte du marché et les niveaux de Fibonacci qui marquent les niveaux exacts d'entrée. sur le marché et les endroits où prendre des bénéfices. Description détaillée de la stratégie Mode d'emploi de l'in
72.75 USD
Le profit de la structure du marché change à mesure que le prix s'inverse et recule. L'indicateur d'alerte d'inversion de la structure du marché identifie le moment où une tendance ou un mouvement de prix approche de l'épuisement et est prêt à s'inverser. Il vous avertit des changements dans la structure du marché qui se produisent généralement lorsqu'un renversement ou un recul majeur est sur le point de se produire. L'indicateur identifie initialement les cassures et la dynamique des prix,
49 USD
FX Volume MT5
Daniel Stein
4.93 (14)
Obtenez votre mise à jour quotidienne du marché avec des détails et des captures d'écran via notre Morning Briefing ici sur mql5 et sur Telegram ! FX Volume est le PREMIER et SEUL indicateur de volume qui fournit un VRAI aperçu du sentiment du marché du point de vue d'un courtier. Il fournit des informations impressionnantes sur la façon dont les acteurs institutionnels du marché, comme les courtiers, sont positionnés sur le marché des changes, bien plus rapidement que les rapports COT. Voir c
249 USD
Gold Stuff mt5
Vasiliy Strukov
4.9 (137)
Gold Stuff mt5 est un indicateur de tendance conçu spécifiquement pour l'or et peut également être utilisé sur n'importe quel instrument financier. L'indicateur ne se redessine pas et ne traîne pas. Délai recommandé H1. Contactez-moi immédiatement après l'achat pour obtenir les réglages et un bonus personnel !   RÉGLAGES Dessiner la flèche - on off. dessiner des flèches sur le graphique. Alertes - activation et désactivation des alertes sonores. Notification par e-mail - activé désactivé.
149 USD
TrendMaestro5
Stefano Frisetti
note: this indicator is for METATRADER4, if you want the version for METATRADER5 this is the link:  https://www.mql5.com/it/market/product/108106 TRENDMAESTRO recognizes a new TREND in the bud, he never makes mistakes. The certainty of identifying a new TREND is priceless. DESCRIPTION TRENDMAESTRO identifies a new TREND in the bud, this indicator examines the volatility, volumes and momentum to identify the moment in which there is an explosion of one or more of these data and therefore the mome
397 USD
FX Power MT5 NG
Daniel Stein
5 (2)
Obtenez votre mise à jour quotidienne du marché avec des détails et des captures d'écran via notre Morning Briefing ici sur mql5 et sur Telegram ! FX Power MT5 NG est la nouvelle génération de notre très populaire indicateur de force des devises, FX Power. Et qu'est-ce que ce compteur de force de nouvelle génération offre ? Tout ce que vous avez aimé de l'original FX Power PLUS Analyse de la force de l'OR/XAU Des résultats de calcul encore plus précis Périodes d'analyse configurables individuel
169 USD
ICT, SMC, SMART MONEY CONCEPTS, SMART MONEY, Smart Money Concept, Support and Resistance, Trend Analysis, Price Action, Market Structure, Order Blocks, BOS/CHoCH,   Breaker Blocks ,  Momentum Shift,   Supply&Demand Zone/Order Blocks , Strong Imbalance,   HH/LL/HL/LH,    Fair Value Gap, FVG,  Premium  &   Discount   Zones, Fibonacci Retracement, OTE, Buy Side Liquidity, Sell Side Liquidity, BSL/SSL Taken, Equal Highs & Lows, MTF Dashboard, Multiple Time Frame, BigBar, HTF OB, HTF Market Structure
65 USD
This is arguably the most complete harmonic price formation auto-recognition indicator you can find for the MetaTrader Platform. It detects 19 different patterns, takes fibonacci projections as seriously as you do, displays the Potential Reversal Zone (PRZ) and finds suitable stop-loss and take-profit levels. [ Installation Guide | Update Guide | Troubleshooting | FAQ | All Products ] It detects 19 different harmonic price formations It plots primary, derived and complementary Fibonacci p
299 USD
TPA True Price Action indicator reveals the true price action of the market makers through 100% non-repainting signals strictly at the close of a candle! TPA shows entries and re-entries, every time the bulls are definitely stronger than the bears and vice versa. Not to confuse with red/green candles. The shift of power gets confirmed at the earliest stage and is ONE exit strategy of several. There are available now two free parts of the TPA User Guide for our customers. The first "The Basics"
168 USD
Description: First of all Its worth emphasizing here that this Trading Tool is Non-Repainting, Non-Redrawing and Non-Lagging Indicator, Which makes it ideal for professional trading and expert advisers. For limited time only 40% OFF,  Now 60$ only. 4 purchases left & the price increases to 100$ Attention, the application might not work in the strategy tester,    Try Demo here before you buy:   here . The Smart Price Action Concepts Indicator is a very powerful tool for both new and experienced
60 USD
Présentation de l'indicateur Heracles. Cet indicateur facilite le trading sans nécessiter d'analyse. Il identifie automatiquement les zones d'accumulation, les points d'entrée et fournit des niveaux de prise de profit clairs. L'indicateur Heracles vous alertera et affichera des flèches de signal lorsque le prix atteindra les points d'entrée d'achat ou de vente, en suggérant également trois niveaux de prise de profit. Il convient aussi bien aux traders débutants qu'aux traders professionnels
75.99 USD
Le tableau de bord d'alerte RSI / TDI vous permet de surveiller les RSI à la fois (sélectionnables par vous) sur chaque paire majeure que vous négociez. Vous pouvez l'utiliser de deux manières : 1. Sélectionnez plusieurs périodes et le tiret vous montrera quand il y a plusieurs périodes prolongées au-delà des conditions commerciales normales. Un excellent indicateur que le prix a poussé fort récemment, car il a atteint un niveau de surachat ou de survente sur plusieurs périodes, de sorte
49 USD
Matrix Arrow Indicator MT5
Juvenille Emperor Limited
5 (14)
Matrix Arrow Indicator MT5   est une tendance unique 10 en 1 suivant un indicateur multi-période   100% non repeint   qui peut être utilisé sur tous les symboles/instruments:   forex ,   matières premières ,   crypto-monnaies ,   indices ,  actions .  Matrix Arrow Indicator MT5  déterminera la tendance actuelle à ses débuts, en rassemblant des informations et des données à partir d'un maximum de 10 indicateurs standard, qui sont: Indice de mouvement directionnel moyen (ADX) Indice de canal de m
75 USD
ICT Silver Bullet MT5
Haidar, Lionel Haj Ali
5 (16)
ICT Silver Bullet If you are searching for a reliable indicator to trade the ICT Silver Bullet concept, or ICT concepts, Smart Money Concepts, or SMC, this indicator will respond to your need!  Before version 2.2, this indicator was focused only on ICT Silver Bullet, but moving forward, we will include the different elements for smart money concept trading. This indicator will help you identify the following: FVG - fair value gaps Market structure: BOS and CHOCH. It is based on ZIGZAG as it is
39 USD
Dessine automatiquement les niveaux de support et de résistance PLUS les écarts des bougies de propulsion sur votre graphique, afin que vous puissiez voir où le prix est susceptible de se diriger ensuite et/ou de s'inverser potentiellement. Cet indicateur est conçu pour être utilisé dans le cadre de la méthodologie de trading de position enseignée sur mon site web (The Market Structure Trader) et affiche des informations clés pour le ciblage et les entrées potentielles. MT4 Version:  https://
49 USD
AW Trend Predictor MT5
AW Trading Software Limited
4.75 (51)
La combinaison des niveaux de tendance et de panne dans un seul système. Un algorithme d'indicateur avancé filtre le bruit du marché, détermine la tendance, les points d'entrée, ainsi que les niveaux de sortie possibles. Les signaux indicateurs sont enregistrés dans un module statistique, qui vous permet de sélectionner les outils les plus appropriés, montrant l'efficacité de l'historique des signaux. L'indicateur calcule les marques Take Profit et Stop Loss. Manuel et instruction ->   ICI   / v
55 USD
ICT Template MT5
David Perk
4.33 (6)
Last 5 copies for this historical lowest prices. ICT Template Indicator visualizes and automatically updates all important ICT elements for Scalpers, Day and Swing traders. It allows you too keep your chart clean and bring any elements by just one click to the buttons. Thanks to mobile notifications on external liquidity levels, you will not miss any opportunity and you don't have to sit behind the screens whole day. Each element has fully customizable colours, width, line types, max timeframe
30 USD
Strong Support mt5
Vasiliy Strukov
5 (9)
Les niveaux de support et de résistance sont depuis longtemps un outil puissant pour l'analyse du marché. Strong support l'indicateur construit les niveaux de support sur les bas de prix locaux et les niveaux de résistance sur les hauts de prix locaux. Mes autres développements peuvent être consultés ici Il est recommandé d'utiliser conjointement avec un indicateur de tendance, par exemple, Gold Stuff - cela vous permettra de négocier sur la tendance et de définir simultanément des zones de
149 USD
Gartley Hunter MT5
Siarhei Vashchylka
5 (12)
Gartley Hunter - An indicator for searching for harmonic patterns (Gartley patterns) and their projections. The indicator is equipped with a system of alerts and push notifications. Manual (Be sure to read before purchasing) | Version for MT4 Advantages 1. 12 harmonic patterns: 7 classical and 5 exotic. New patterns will be added as the indicator develops. 2. Constant automatic search for harmonic patterns. The indicator is capable of finding from the smallest to the largest patterns. 3. Autom
89 USD
Advanced Supply Demand MT5
Bernhard Schweigert
4.46 (13)
La meilleure solution pour tout commerçant débutant ou expert ! Cet indicateur est un outil de trading unique, de haute qualité et abordable car nous avons intégré un certain nombre de fonctionnalités propriétaires et une nouvelle formule. Avec cette mise à jour, vous pourrez afficher des zones à double horaire. Vous pourrez non seulement afficher un TF plus élevé, mais afficher les deux, le graphique TF, PLUS le TF supérieur : AFFICHAGE DES ZONES NICHÉES. Tous les traders Supply Demand vont ado
199 USD
TPSpro TRENDPRO - is a trend indicator that automatically analyzes the market and provides information about the trend and each of its changes, as well as giving signals for entering trades without redrawing! The indicator uses each candle, analyzing them separately. referring to different impulses - up or down impulse. Exact entry points into transactions for currencies, crypto, metals, stocks, indices!  - To maximize the potential of TPSpro TREND PRO, read the full description  -  https://www
125 USD
Smart Peak Bottom
Xiaoyu Huang
5 (2)
Il s'agit d'un indicateur clair pour juger des hauts et des bas, et cela fonctionne bien pour le marché oscillant. Prix promotionnel 49$ → 59$ caractéristiques bon pour juger des hauts et des bas Pas de redessin, pas de dérive Calcul rapide, pas de décalage Mode de rappel riche Plusieurs paramètres et couleurs peuvent être ajustés paramètre "======== Principal ========" HighLowPeriod1 = 9 HighLowPeriod2 = 60 HighLowPeriod3 = 34 HighLowEMAPeriod = 4 MASignalPeriod = 5 "======== Notifier ==
49 USD
BUY INDICATOR AND GET EA FOR FREE AS A BONUS + SOME OTHER GIFTS! ITALO TRIANGLE INDICATOR  is the best triangle indicator ever created, and why is that? Using Geometry and Fibonacci the Indicator works on all time-frames and assets, indicator built after 7 years of experience on forex and many other markets. You know many triangle indicators around the internet are not complete, does not help, and it's difficult to trade, but the   Italo Triangle Indicator is different , the Italo Triangle Indi
65 USD
Was: $249  Now: $99   Market Profile defines a number of day types that can help the trader to determine market behaviour. A key feature is the Value Area, representing the range of price action where 70% of trading took place. Understanding the Value Area can give traders valuable insight into market direction and establish the higher odds trade. It is an excellent addition to any system you may be using. Blahtech Limited presents their Market Profile indicator for the MetaTrader community. Ins
99 USD
Market Structure Patterns
Samuel Manoel De Souza
4.75 (16)
Market Structure Patterns is an indicator based on smart money concepts that displays structures and zones on the chart, can send alerts of any type, have his values accessed through global variables  for creating Expert Advisors based on it. This is the first one of this type in the market that allows the control of the transparency of the zones on the chart. The indicator also paints the   candlesticks   depending on the trend. This feature can be enabled in the parameter "Color Candles". By d
30 USD
Plus de l'auteur
%b shows you as a percentage where the last price is in relation to the lower and upper Bollinger Bands. If the price is at the moving average line, %b will show on the secondary chart window as a value of 50 which is 50% between the bands. %b can be a negative value (below the lower band) or above 100 (above the upper band) when the price is outside of the bands. This indicator also includes an upper line and lower line that you can specify. By default these are set at 0 and 100 for the 0% and
FREE
This indicator uses the chart information and your inputs to display the lot size and associated stop for long or short positions. It uses an ATR based percent volatility position sizing calculation. You can use this indicator to learn more about a better position size calculation than a fixed lot system. The indicator adds text directly to the chart to show you the current position size calculation, the risk % input, the ATR Range input, the ATR value from the prior bar, the account equity at r
FREE
Moving Average Envelopes use a percentage of a simple moving average to create an upper and lower envelope around the moving average. Using the middle moving average value, the chosen percentage from the input is multiplied by the MA value to add upper and lower envelopes. As the MA value is different among markets and currency pairs, you must manually adjust the chosen percentage for each chart. If you do not see the envelopes on a chart, change the percentage to a smaller value until you see t
FREE
Bollinger BandWidth tfmt4
GTV Holdings, LLC
3.6 (5)
The Bollinger BandWidth is the numerical difference between the value of the upper Bollinger Band and the lower Bollinger Band. As volatility increases and the Bollinger Bands get wider, the BandWidth indicator value will increase. As volatility decreases and the Bollinger Bands get closer, the BandWidth indicator value will decrease. The BandWidth indicator helps show volatility as it increases and decreases. Typical use is to find times of low volatility that start to breakout as the price mov
FREE
ATR Envelopes tfmt4
GTV Holdings, LLC
3.6 (5)
ATR Envelopes use a multiple of the Average True Range and add an upper envelope line and lower envelope line around a moving average. ATR Envelopes are also known as ATR Channels. Typical use is to indicate when the price breaks out of the envelope as the ATR measures volatility. Way of the Turtle by Curtis Faith uses this type of indicator as it shows tests of an ATR Channel Breakout trend following system. You can change the moving average period, the Average True Range period, and the number
FREE
This indicator uses the chart information and your inputs to display the lot size and associated stop for long or short positions. It uses an ATR based percent volatility position sizing calculation. You can use this indicator to learn more about a better position size calculation than a fixed lot system. The indicator adds text directly to the chart to show you the current position size calculation, the risk % input, the ATR range input, the ATR value from the prior bar, the account equity at r
FREE
This indicator uses the chart information and your inputs to display a calculated lot size and associated stop for long or short positions. It uses an ATR based percent volatility position sizing calculation and splits your account equity into two parts, each having its own risk percentage. The concept behind "Market's Money" is using a lower risk percentage for your base account equity and then using a higher risk percentage for any equity above your base equity. This lets you potentially grow
FREE
Filtrer:
Ard Sluis
145
Ard Sluis 2022.11.14 08:01 
 

GREAT tool. very non-intrusively positioned on the chart. You plug in the risk you are comfortable with, the indicator tells you the preferred position size and stop loss in case to want to go Long or Short. This is a great tool in helping you with risk management. I looked at a couple of these indicators and I like this one the best by far! Thank you for your time and expertise to put this one together!

[Supprimé] 2019.01.14 07:59 
 

L'utilisateur n'a laissé aucun commentaire sur la note

sunnychow
8664
sunnychow 2018.12.16 04:55 
 

Thanks for sharing

Gennadiy Voltornist
11922
Gennadiy Voltornist 2018.02.02 20:16 
 

L'utilisateur n'a laissé aucun commentaire sur la note

Daniel Andrejczuk
5596
Daniel Andrejczuk 2017.11.09 14:51 
 

L'utilisateur n'a laissé aucun commentaire sur la note

Nork
6194
Nork 2017.07.21 17:36 
 

L'utilisateur n'a laissé aucun commentaire sur la note

Rodrigo da Silva Boa
7137
Rodrigo da Silva Boa 2016.03.14 04:27 
 

L'utilisateur n'a laissé aucun commentaire sur la note

Répondre à l'avis
Version 1.20 2022.01.17
Compiled with current version of MetaEditor.
In prior version, stop levels had their labels reversed. Is corrected in this version.