Price and Moving Average Crossover MT5
- Indicateurs
- Boris Armenteros
- Version: 1.0
- Activations: 20
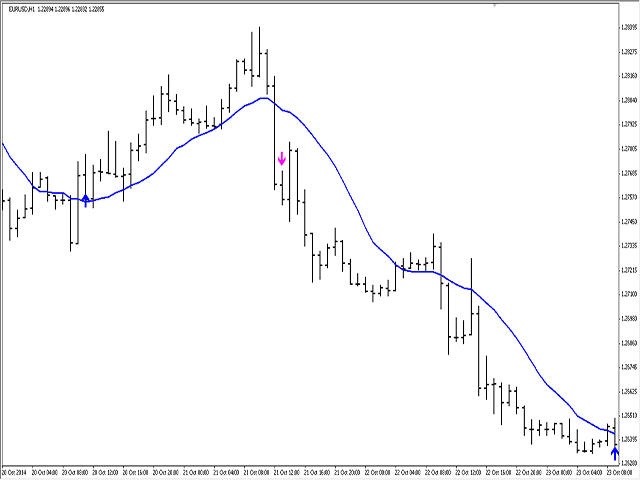
Crossing
of market price and moving average with all kinds of alerts and features to improve visualization on the chart.
Features
- Crossing of market price and Moving Average (MA) at current bar or at closing of last bar;
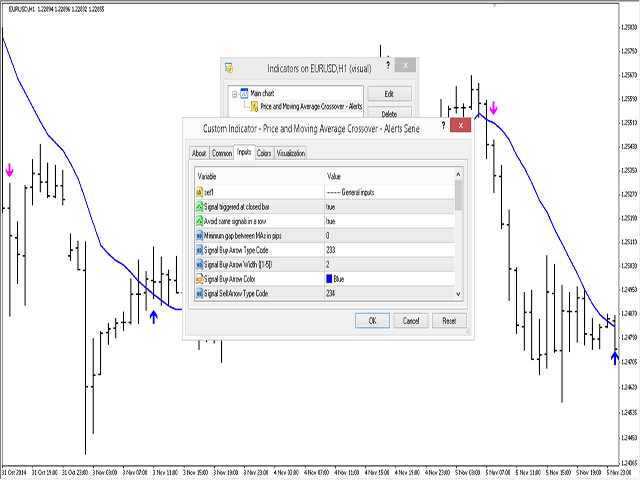
- It can avoid same signals in a row, so it can allow only a buy signal followed by a sell signal and vice versa;
- MA can be set for any of the following averaging methods: Simple Moving Average (SMA), Exponential Moving Average (EMA), Smoothed Moving Average (SMMA), Linear-weighted Moving Average (LWMA);
- MA can be also set for any averaging period and for any of the following prices: Close, Open, High, Low, Median, Typical or Weighted;
- The user can choose the drawing style of MA to improve the visualization on the chart;
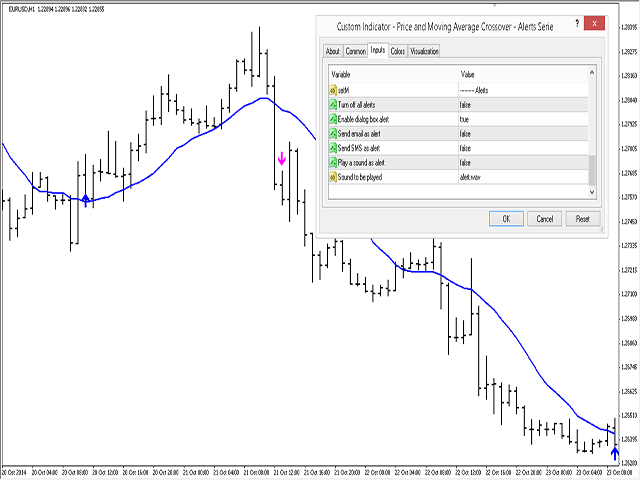
- Any kind of alerts can be enabled: Dialog Box, Email message, SMS notifications for smartphones and tablets, and Sound alerts;
- By default up arrows are plotted for buying signals and down arrows for selling signals;
- The user can choose the drawing style of the arrows;
- It includes a minimum gap value between market price and MA to validate the crossing;
- It works properly at any symbol (no matter how exotic it is) and any timeframe;
- Compatible with any MetaTrader platform, regardless of the number of digits or
other parameters;
- Compatible with any other tool (indicator, EA or script) without slowing down the terminal performance and the trading operations.
About Us
We are a small team of coders/traders that provide professional programming services for the trading world, mostly for MetaTrader platform. Our team has around 7 years (as average) of trading experience and about 6 years (as average) dedicated to programming for MetaTrader. We have developed Scripts, Indicators and Expert Advisors for many clients around the world and for our own use.