Average Cost Price
- Indicateurs
- Zihni Taş
- Version: 1.0
- Activations: 5
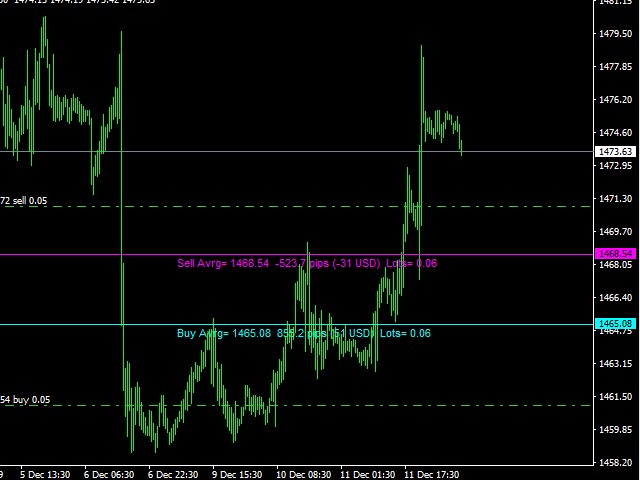
Average Cost Price helps you keep track of your open positions on the chart. In doing so, it provides lines and explanations on the chart. This line is the average price value of Buy or Sell.
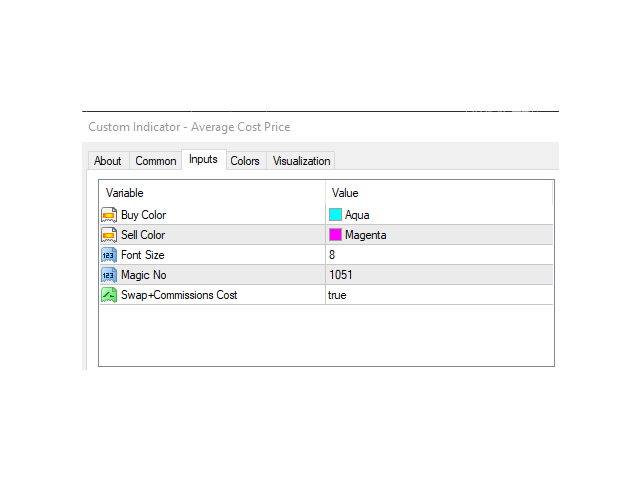
If you wish, you can see the average cost price by adding SWAP and COMMISSIONS to the average price value.
With MAGIC NO you can differentiate position costs on the same symbol.
Average Cost The description below the price line gives you:
* Average Buy or Sell price,
* PIPS difference between average price and current price,
* Profit or Loss amount,
* Lot amount
Hi, I don't see the buy average price only the sell one