• Aperçu
  • Avis (1)
  • Commentaires
  • Nouveautés

CCI Dashboard for MT5

5

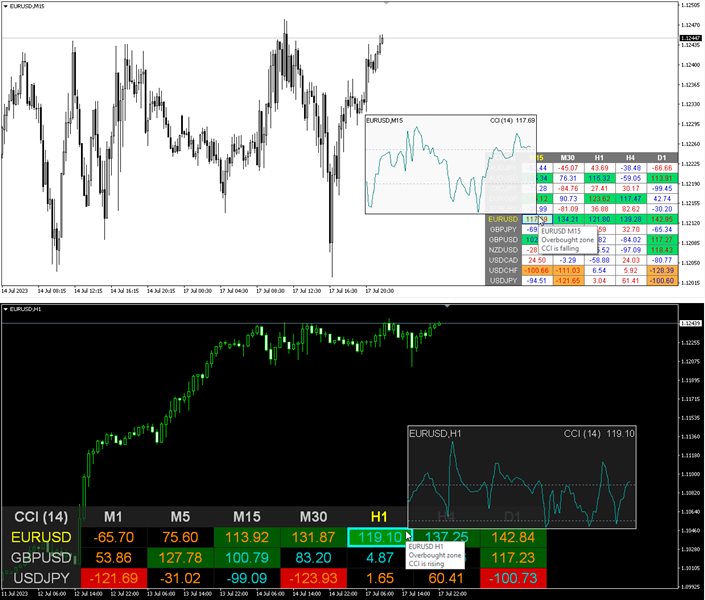
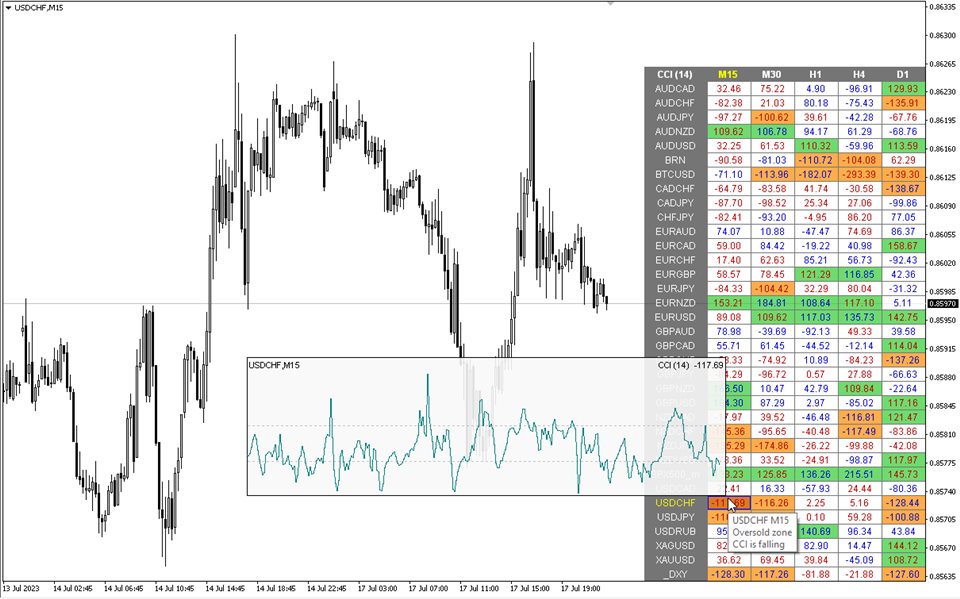
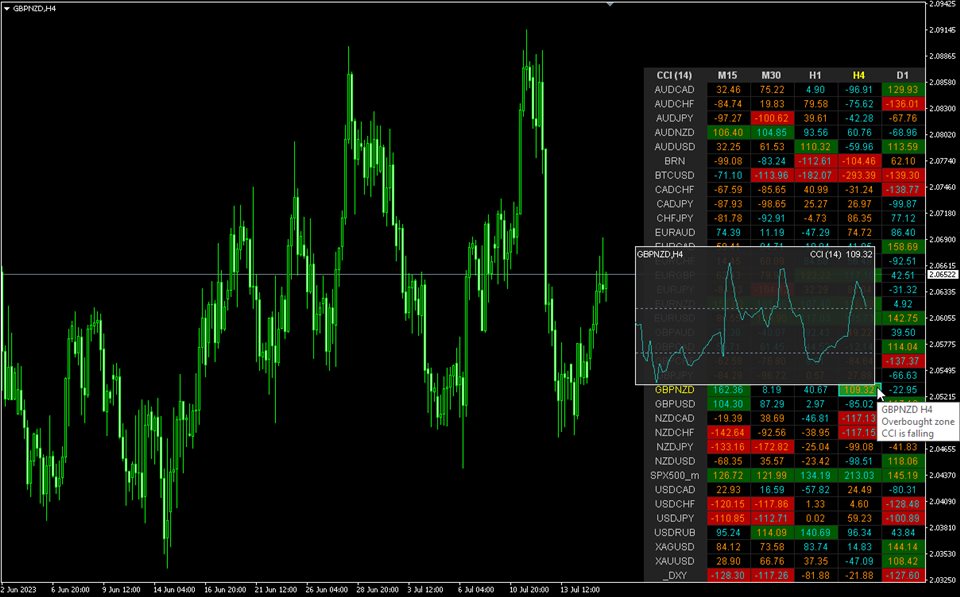
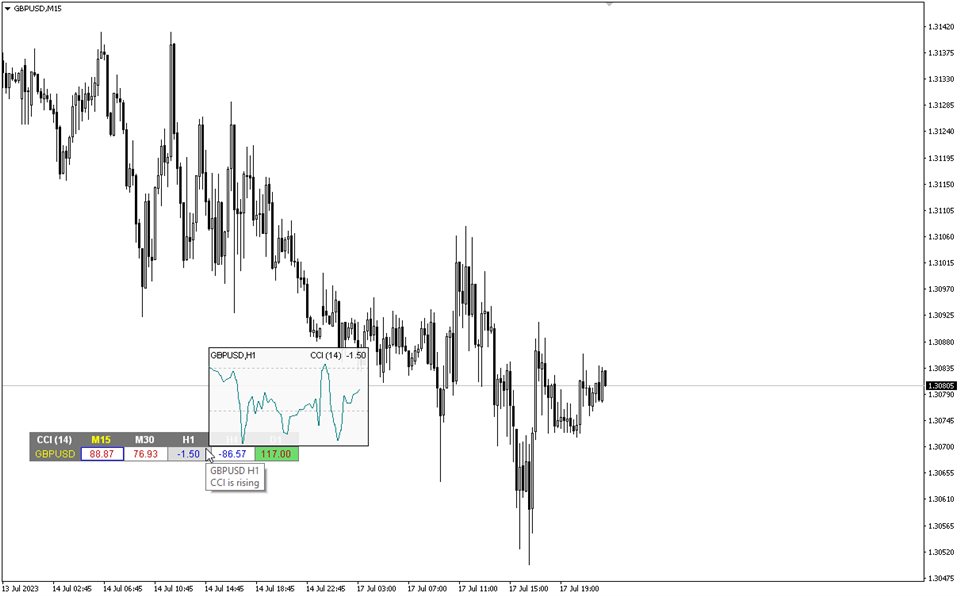
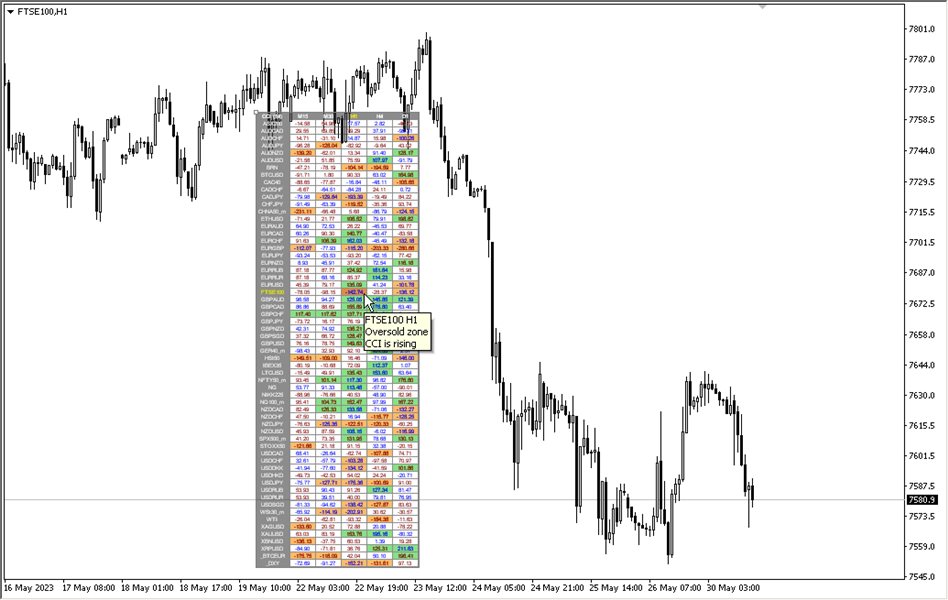
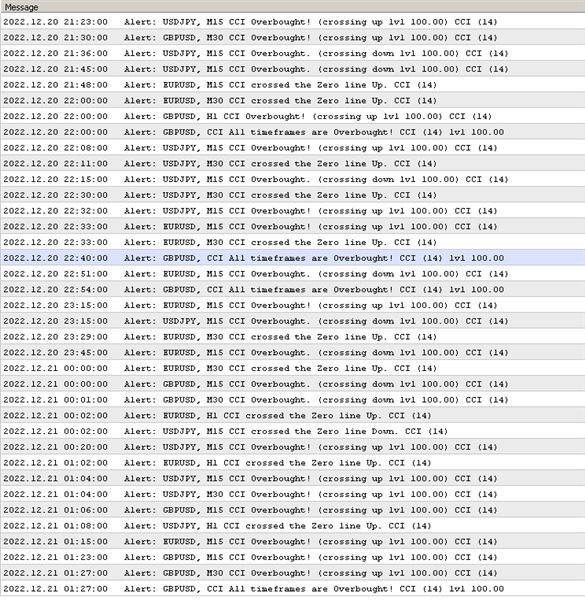
Multicurrency and multitimeframe modification of the Commodity Channel Index (CCI) indicator. You can specify any desired currencies and timeframes in the parameters. Also, the panel can send notifications when crossing overbought and oversold levels. By clicking on a cell with a period, this symbol and period will be opened. This is MTF Scanner.

The key to hide the dashboard from the chart is "D" by default.


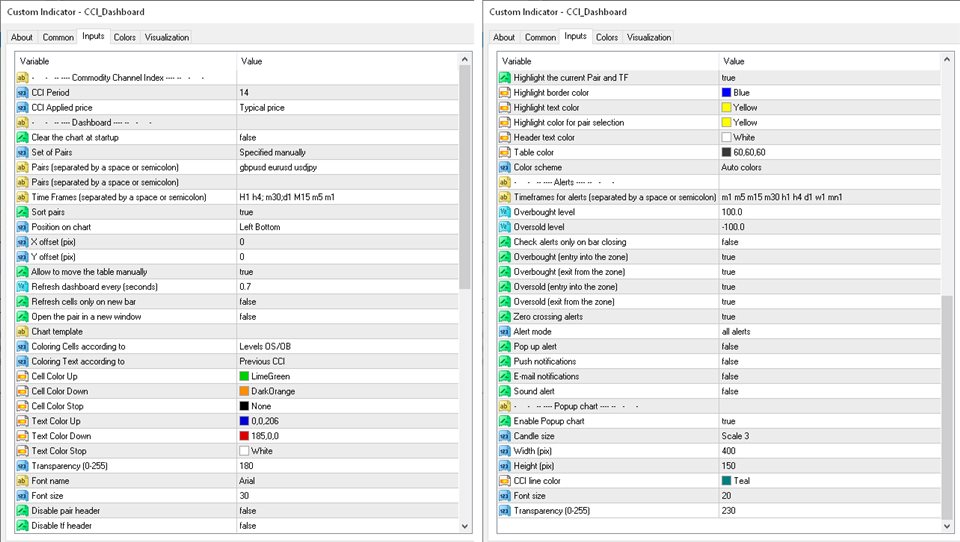
Parameters

CCI Period — averaging period.
CCI Applied price — price type.
Clear the chart at startup — clear the chart at startup.
Set of Pairs — set of symbols
       Market Watch — pairs from the "Market Watch";
       Specified manually — pairs specified manually, in the parameters "Pairs".
       Current pair.
        Pairs (separated by a space or semicolon) — list of symbols separated by spaces or semicolons. The currency names should be written exactly like the broker's, keeping the case and prefix/suffix.
        Time Frames (separated by a space or semicolon) — list of timeframes separated by spaces or semicolons (multi timeframe).
        Sort pairs — sorting the list of pairs.
        Position on chart — corner to display the panel on the chart.
        X offset (pix) — shift the panel along the X axis.
        Y offset (pix) — shift the panel along the Y axis.
        Allow to move the table manually.
        Refresh dashboard every (seconds) — update period for all pairs and timeframes.
        Open the pair in a new window — open a symbol in a new chart window by clicking.
        Chart template — the name of the template for the chart, if the chart opens in a new window.
        Coloring the cells according to the — paint the cells of the table according to the levels of overbought/oversold or according to the direction of the previous candle.
        Color Up — cell color if the indicator increases.
        Color Down — cell color if the indicator decreases.
        Color Stop — cell color if the indicator does not change.
        Transparency (0-255) — transparency of the panel.
        Font name — font name.
        Font size — font size.
            Alerts
            Timeframes for alerts (separated by a space or semicolon) — list of periods for which the alert will be sent (separated by a space or semicolon).
            Overbought level — overbought level for alerts.
            Oversold level — oversold level for alerts.
            Check alerts only on bar closing — check level crossing only after bar closing.
            Enable overbought alerts.
            Enable oversold alerts.
            Enable zero crossing alerts.
            Alert mode
                 separated by timeframes — send alerts only from individual TFs.
                 combined in a row — send an alert only when all TFs are in the same direction.
                 all alerts — both modes. 

                  Pop up alert — pop-up alert.
                  Push notifications — push notification.
                  E-mail notifications — e-mail notification.
                  Sound alert — sound alert.

                  Popup chart
                  Enable Popup chart
                  Candle size
                  Width (pix)
                  Height (pix)
                  Font size
                  Transparency (0-255)


                  Avis 1
                  Adz trading
                  98
                  Adz trading 2023.05.30 16:14 
                   

                  very useful indicator i have a trend multitimeframe of and overbrought oversold crossing level top

                  Produits recommandés
                  L'utilitaire est conçu pour copier rapidement les transactions entre les terminaux MT4 et/ou MT5 situés sur le même ordinateur ou serveur VPS Windows. Les options les plus importantes et les plus utiles qui peuvent être nécessaires lors de la copie d'une facture sont fournies: copier toutes les transactions ou les transactions uniquement pour l'instrument actuel copier le Take Profit et le Stop Loss copier uniquement les nouvelles transactions ouvertes après le début du travail du conseiller
                  Supply and Demand Monster
                  Tsog Erdene Borjigon Enkhkhudulmur
                  Supply and demand zones are at the heart of   supply and demand trading . These zones are areas that show  liquidity at a specific price.  The supply zone is also called the distribution zone, while the demand zone is called the accumulation zone.   Our indicator automatically draw supply and demand zones in Metatrader 5. It give opportunity to understand trading zone and avoiding risk.
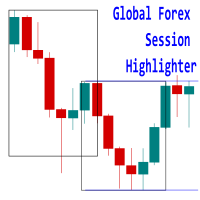
                  Introducing the 'Global Forex Session Highlighter' , a powerful tool designed to enhance your trading strategy by providing a visual representation of the Three major Forex trading sessions: Tokyo, London, and New York. This indicator is designed to help traders understand the dynamics of the global Forex market by highlighting the trading sessions directly on your MT5 chart. It provides a clear view of when each session starts and ends, allowing you to strategize your trades around the most act
                  This script is designed to download a long history of cryptocurrency quotes from the Binance exchange. You will find it perfectly suitable if you want once to download the history of cryptocurrencies for charts analyzing, collecting statistics or testing trading robots in the MetaTrader 5 strategy tester, or if you need to update the history not very frequently (for example, once a day or once a week). After running the script, you will have fully featured (but not automatically updated) cryptoc
                  News Explorer
                  Ervand Oganesyan
                  Ce texte est une traduction automatique de l'anglais. version anglaise News Explorer est un outil qui permet de naviguer entre les événements du calendrier économique sur le graphique des prix. Calendrier économique entièrement fonctionnel directement dans le terminal. Navigation graphique rapide entre les événements du calendrier. Pas besoin d'ouvrir des sites Web de calendrier, de copier-coller des dates, de faire défiler manuellement les graphiques jusqu'à ces dates. Tout est disponible direc
                  Get news5
                  Aleksander Gladkov
                  Utility for reading news from investing.com To access the site, you need to add WebRequest in the Options terminal menu on the Expert Advisors tab: https://sslecal2.investing.com If reading is successful, a message about writing the file is displayed. The INV_week_this.txt file is written to the MQL5\Files folder of the terminal and is kept up to date, updating data according to its own timer You can attach the utility to any chart with any time frame; just one is enough to support indicat
                  Excellent Multiplatform Copier of deals. I use it regularly on VPS (copy from Mt5 to Mt4). Multiplatform : copying from MetaTrader 4 to MetaTrader 4; copying from MetaTrader 4 to MetaTrader 5; copying from MetaTrader 5 to MetaTrader 4; copying from MetaTrader 5 to MetaTrader 5. Modes: master   - the current terminal is   source of trades (deals are copied from it); slave   - the current terminal is the receiver of trades (trades are copied to it). from myself  - mode "deals multiplier" (use
                  Nasdaq Investor This Ea is based on the strategy from the Menora (All In One) Indicator , which can be downloaded for free on the link below. https://www.mql5.com/en/market/product/91511?source=Site+Market+MT5+Search+Rating006%3amenora This Ea is not a get-rich-quick scheme. Rather, it is suitable for patient traders who want to profit from the market on the long run. The technique is to cut losses short when wrong (even before the price reaches the stop loss) and to utilize profits
                  FREE
                  Boleta de negociação, adiciona automáticamente as ordens Take Profit e Stop Loss quando excutada uma ordem de compra ou venda. Ao apertar as teclas de atalho (A, D, ou TAB), serão inseridas duas linhas de pre-visualização, representando as futuras ordens de take profit (azul) e stop loss (vermelho), as quais irão manter o distanciamento especificado pelo usuário. Ditas ordens só serão adicionadas ao ser executada a ordem inicial. Ao operar a mercado, as ordens pendentes de take profit, e stop lo
                  Binance is a world-renowned cryptocurrency exchange! In order to facilitate the real-time data analysis of the encrypted digital currency market, the program can automatically import the real-time transaction data of Binance Futures to MT5 for analysis. The main functions are: 1. Support the automatic creation of USD-M futures trading pairs of the Ministry of Currency Security, and the base currency can also be set separately. The base currency BaseCurrency is empty to indicate all currencies
                  Introducing a compact and handy panel for watching the market and estimating multicurrency price movements. It shows main parameters for a user defined group of symbols in the form of a table. Its functionality is checked on Forex and FORTS. The following information is displayed: Financial instrument name . Last price value - can be turned off for off-exchange markets. Ask price value . Bid price value . Spread size in pips. Stop level in pips - can be turned off for off-exchange markets. Chang
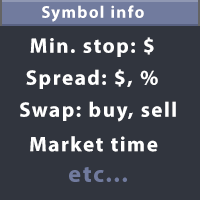
                  This utility displays the information required for making trades on each opened chart. For example: spread value, swap value; triple swap day; session closing time; ATR of the symbol by Gerchik; total profit/loss for the current symbol; the number of trades made earlier; the percentage change in the quotes of 6 selected instruments; and much more. The spread value is always shown. The rest of the information is displayed depending on the settings: Show total orders at the moment (long, short) .
                  You can see Binance Spot data instantly in Metatrader 5 and it allows you to use all the features that Metatrader has provided to you. You can access the data of all symbols listed on Binance Futures. Don't forget to set the timezone. Binance it's 00:00 UTC. You need to fix it according to your own country You need to install the free Binance Spot Symbol List plugin. https://www.mql5.com/tr/market/product/83507 After loading, it automatically downloads the data of the cryptos in the market obser
                  FX28 Trader MT5
                  Tsvetan Tsvetanov
                  3 (1)
                  Présentation du FX28 Trader Dashboard - Votre gestionnaire de transactions ultime Découvrez tout le potentiel de votre expérience de trading avec le FX28 Trader Dashboard, un gestionnaire de transactions complet et intuitif conçu pour élever votre trading Forex à de nouveaux sommets. Que vous soyez un trader expérimenté ou que vous débutiez votre parcours financier, cet outil puissant a été développé pour simplifier vos activités de trading et améliorer votre processus de prise de décision. Car
                  SuperIndices MT5
                  Stanislav Korotky
                  5 (1)
                  This cluster indicator is MT5 version of SuperIndices for MT4. It allows for processing mixed clusters, where symbols from various markets can be included. For example, it can handle Forex, indices, CFDs, spot at the same time. Number of visible lines increased to 16. An interactive ruler can be enabled to measure signals' strength on the history. The indicator creates a set of embedded cluster indicators (CCFpExtraIndices) with carefully selected periods and combines their results using smart w
                  Safety Control: Your Ultimate Balance Management Solution for Prop Firm Challenges Overview Tired of manually monitoring your trading activities in prop trading challenges? Meet Safety Control, an advanced Expert Advisor for MetaTrader 5 that will change the way you trade forever. This proprietary software aims to help you manage your balance effortlessly during prop firm challenges. Features Automated Drawdown Control : Safety Control continuously monitors your account's balance and equity in r
                  Just Copier MT5
                  Agung Imaduddin
                  4.75 (4)
                  "Just copier" is designed to copy trading without any complicated settings. The copy can be done in one PC. One EA can be set as master (provider) or slave (receiver). The receiver lot can be set to multiple providers lots. Please also check this product at fxina.hostingerapp.com.  Any type of copy is available. MT4 -> MT5 MT4 -> MT4 MT5 -> MT5 MT5 -> MT4 If you want to copy MT4 -> MT5 or MT5 -> MT4, please purchase "Just copier" for MT4 and "Just copier" for MT5 separately. Just Copier can copy
                  DrawDown Limiter
                  Haidar, Lionel Haj Ali
                  5 (17)
                  Expert Advisor "Drawdown Limiter"  Vous êtes au bon endroit si vous recherchez un contrôle de drawdown, un limiteur de drawdown, une protection du solde, une protection de l'équité ou une limite quotidienne de drawdown en rapport avec les entreprises de gestion de capitaux (Prop Firm), FTMO, My Forex Fund, ou si vous souhaitez protéger votre compte de trading. Avez-vous déjà eu du mal à contrôler votre drawdown en tradant sur des comptes financés ? Cet EA est fait pour vous. Les entreprises d
                  Prior Lines
                  Ricardo Almeida Branco
                  This indicator shows on the current day some lines of interest, such as maximum, minimum and closing of the previous day, as well as the opening, maximum and minimum price of the current day. It can also show the GAP (closing of the previous day and opening of the current day) and projections of the amplitude of the previous day, according to the value you choose in the multiplier. Oh, I was going to forget. It is also possible to determine the time frame, which is daily by default. If th
                  Many Forex traders have either been told, or have learnt from painful experience, that the Yen currency pairs can be both dangerous and volatile to trade. The GBP/JPY is perhaps the most infamous and volatile of all. No wonder then, that many Forex traders simply stay away from the Yen currency pairs. But then they probably don’t have a very clear idea of where the Yen itself is heading. If they did, then trading the Yen pairs would be much more straightforward. And this is where the Quantum JPY
                  L'indicateur   Accurate Gold   est un outil convivial, à la fois intuitif et simple à utiliser, quel que soit le niveau d'expérience des traders. Il est conçu pour les traders à la recherche de signaux précis sur le laps de temps M5 sur le marché de l'or. Cet indicateur utilise des algorithmes mathématiques avancés pour analyser les mouvements de prix et la dynamique du volume, générant ainsi des signaux d'achat et de vente précis. Les caractéristiques distinctives de cet indicateur, notamment s
                  Powerful trend indicator provided with all necessary for trade and it is very easy to use. Everyone has probably come across indicators or Expert Advisors that contain numerous input parameters that are difficult to understand. But here, input parameters are simple and it is no need to configure anything — neural network will do all for you. Difference from a classic version The real-time multi time frame panel is added, so you can check a trend for other timeframes without switching the sche
                  Attention!!! Do not try to test the EA in the MT4 Tester, it is simply impossible, because the EA opens positions on 27 different instruments and 8 timeframe . The tester is able to test only one pair. Multi-currency tester is possible only in MT5. Instructions for launching a multi-currency tester in MT5:  https://youtu.be/WrQQwMQclrY How EA works: 1. The main strategy for the breakdown of local extremes is used. 2. An additional algorithm is used to control losing trades and redistribute loss
                  EUR 8 of 8
                  Tomas Michalek
                  Plug & Play portfolio - series of high-quality EURUSD H1 strategies for maximized success. The eighth strategy, the last one from the EUR-8 portfolio , uses BollingerBands mean reversal method for setting up the pending order. To have a whole portfolio of strategies, which trades for you is incredibly efficient, don't miss that opportunity. Check my other strategies today! and assemble your portfolio. Benefits for you Plug & Play system , designed to have   simple initial setup . That's saved
                  Was: $249  Now: $99   Market Profile defines a number of day types that can help the trader to determine market behaviour. A key feature is the Value Area, representing the range of price action where 70% of trading took place. Understanding the Value Area can give traders valuable insight into market direction and establish the higher odds trade. It is an excellent addition to any system you may be using. Inspired by Jim Dalton’s book “Mind Over Markets”, this indicator is designed to suit the
                  The   Pairs Spread indicator   has been developed for the popular strategy known as pairs trading, spread trading, or statistical arbitrage. This indicator measures the distance (spread) between prices of two directly (positively) correlated instruments and shows the result as a curve with standard deviations. So, traders can quickly identify when the instruments are too far apart and use this information for trade opportunities.  How to use the Pairs Spread indicator Best results are attaine
                  Avant d'installer l'indicateur HeatMap assurez vous d'utiliser un broker qui vous donne accès au Depth of market (DOM) !! Cet indicateur crée sur votre graphiques une heatmap vous permettant de voir les ordres limites d'achat ou de vente facilement et en temps réel. Vous avez la possibilité de changer de réglage et les couleurs de la HeatMap afin de s'adapter à  tous les marchés et à tous les graphiques. Voici un exemple de réglage que vous pouvez utiliser  avec le SPX500 sur le broker AMPGlob
                  Indicator MTF Qristalium Arrows is a semi - automatic trading system. It works on all currency pairs.  The indicator uses three rules: 1) we trade only on the trend, 2)"buy when everyone sells and sell when everyone buys", 3) the Price always goes against the crowd.  Indicator MTF Arrows Qristalium filter rules across multiple time frames using the built-in indicators. If the trend matches on the selected time intervals, the indicator will give an arrow to enter the market. Then you make
                  Trade Copier Pro MT5
                  Vu Trung Kien
                  3.67 (3)
                  Trade Copier Pro MT5 is a tool to copy trade remotely between multiple MT4/MT5 accounts at different computers/locations over internet. This is an ideal solution for signal provider, who want to share his trade with the others globally on his own rules. One provider can copy trades to multiple receivers and one receiver can get trade from multiple providers as well. The provider can even set the subscription expiry for each receiver, so that receiver will not be able to receive the signal after
                  Quick operation, quick purchase, sale, empty operation. Provide three buttons: Buy, Sell, empty. Buy: Quickly place more orders after clicking, default 1 hand, profit point and stop-loss point are 110 points, after successful order can be manually modified. Sell: Quickly place an empty order after clicking, default 1 hand, profit point and stop-loss point are 110 points, can be manually modified after the order is successful. Empty: Quickly clear all orders, including pu
                  Les acheteurs de ce produit ont également acheté
                  Tout d'abord, il convient de souligner que ce système de trading est un indicateur non repeint, non redessiné et non retardé, ce qui le rend idéal pour le trading manuel et automatisé. Le "Système de Trading Smart Trend MT5" est une solution de trading complète conçue pour les traders débutants et expérimentés. Il combine plus de 10 indicateurs premium et propose plus de 7 stratégies de trading robustes, ce qui en fait un choix polyvalent pour différentes conditions de marché. Stratégie de suivi
                  Atomic Analyst MT5
                  Issam Kassas
                  4.82 (11)
                  Tout d'abord, il convient de souligner que cet indicateur de trading n'est ni repainting, ni redrawing et ne présente aucun délai, ce qui le rend idéal à la fois pour le trading manuel et automatisé. L'Analyste Atomique est un indicateur d'action sur les prix PA qui utilise la force et le momentum du prix pour trouver un meilleur avantage sur le marché. Équipé de filtres avancés qui aident à éliminer les bruits et les faux signaux, et à augmenter le potentiel de trading. En utilisant plusieur
                  FX Volume MT5
                  Daniel Stein
                  4.94 (17)
                  Obtenez votre mise à jour quotidienne du marché avec des détails et des captures d'écran via notre Morning Briefing ici sur mql5 et sur Telegram ! FX Volume est le PREMIER et SEUL indicateur de volume qui fournit un VRAI aperçu du sentiment du marché du point de vue d'un courtier. Il fournit des informations impressionnantes sur la façon dont les acteurs institutionnels du marché, comme les courtiers, sont positionnés sur le marché des changes, bien plus rapidement que les rapports COT. Voir c
                  Quantum Trend Sniper
                  Bogdan Ion Puscasu
                  5 (37)
                  Présentation       Quantum Trend Sniper Indicator   , l'indicateur révolutionnaire MQL5 qui transforme la façon dont vous identifiez et négociez les inversions de tendance ! Développé par une équipe de traders expérimentés avec une expérience commerciale de plus de 13 ans,       Indicateur Quantum Trend Sniper       est conçu pour propulser votre parcours de trading vers de nouveaux sommets grâce à sa manière innovante d'identifier les inversions de tendance avec une précision extrêmement élevée
                  Trend Screener Pro MT5
                  STE S.S.COMPANY
                  4.89 (61)
                  Indicateur de tendance, solution unique révolutionnaire pour le trading et le filtrage des tendances avec toutes les fonctionnalités de tendance importantes intégrées dans un seul outil ! Il s'agit d'un indicateur multi-période et multi-devises 100 % non repeint qui peut être utilisé sur tous les symboles/instruments : forex, matières premières, crypto-monnaies, indices et actions. Trend Screener est un indicateur de suivi de tendance efficace qui fournit des signaux de tendance fléchés avec des
                  Tout d'abord, il convient de souligner que cet outil de trading est un indicateur non repeint, non redessiné et non retardé, ce qui le rend idéal pour le trading professionnel. L'indicateur Smart Price Action Concepts est un outil très puissant à la fois pour les nouveaux et les traders expérimentés. Il regroupe plus de 20 indicateurs utiles en un seul, combinant des idées de trading avancées telles que l'analyse du trader Inner Circle et les stratégies de trading Smart Money Concepts. Cet in
                  Top indicator for MT5   providing accurate signals to enter a trade without repainting! It can be applied to any financial assets:   forex, cryptocurrencies, metals, stocks, indices .  Watch  the video  (6:22) with an example of processing only one signal that paid off the indicator! MT4 version is here It will provide pretty accurate trading signals and tell you when it's best to open a trade and close it. Most traders improve their trading results during the first trading week with the help of
                  FX Power MT5 NG
                  Daniel Stein
                  5 (4)
                  Obtenez votre mise à jour quotidienne du marché avec des détails et des captures d'écran via notre Morning Briefing ici sur mql5 et sur Telegram ! FX Power MT5 NG est la nouvelle génération de notre très populaire indicateur de force des devises, FX Power. Et qu'est-ce que ce compteur de force de nouvelle génération offre ? Tout ce que vous avez aimé de l'original FX Power PLUS Analyse de la force de l'OR/XAU Des résultats de calcul encore plus précis Périodes d'analyse configurables individuel
                  RelicusRoad Pro MT5
                  Relicus LLC
                  4.82 (22)
                  Maintenant 147 $ (augmentant à 499 $ après quelques mises à jour) - Comptes illimités (PCS ou Mac) Manuel d'utilisation RelicusRoad + Vidéos de formation + Accès au groupe Discord privé + Statut VIP UNE NOUVELLE FAÇON DE REGARDER LE MARCHÉ RelicusRoad est l'indicateur de trading le plus puissant au monde pour le forex, les contrats à terme, les crypto-monnaies, les actions et les indices, offrant aux traders toutes les informations et tous les outils dont ils ont besoin pour rester renta
                  Auto Order Block with break of structure based on ICT and Smart Money Concepts Futures Break of Structure ( BoS )             Order block ( OB )            Higher time frame Order block / Point of Interest ( POI )    shown on current chart           Fair value Gap ( FVG ) / Imbalance   ,  MTF      ( Multi Time Frame )    Volume Imbalance     ,  MTF          vIMB Gap’s Equal High / Low’s     ,  MTF             EQH / EQL Liquidity               Current Day High / Low           HOD /
                  XQ Indicator MetaTrader 5
                  Marzena Maria Szmit
                  5 (1)
                  Step into the realm of Forex trading with confidence and precision using XQ, a cutting-edge Forex indicator designed to elevate your trading game to unprecedented heights. Whether you're a seasoned trader or just stepping into the world of currency exchange, XQ Forex Indicator empowers you with the insights and signals needed to make informed trading decisions. The signal conditions are a combination of three indicators, and XQ Forex Indicator only display  medium and long-term trends . The ind
                  Blahtech Supply Demand MT5
                  Blahtech Limited
                  4.57 (14)
                  Was: $299  Now: $99   Supply Demand uses previous price action to identify potential imbalances between buyers and sellers. The key is to identify the better odds zones, not just the untouched ones. Blahtech Supply Demand indicator delivers functionality previously unavailable on any trading platform. This 4-in-1 indicator not only highlights the higher probability zones using a multi-criteria strength engine, but also combines it with multi-timeframe trend analysis, previously confirmed swings
                  Advanced Supply Demand MT5
                  Bernhard Schweigert
                  4.53 (15)
                  La meilleure solution pour tout commerçant débutant ou expert ! Cet indicateur est un outil de trading unique, de haute qualité et abordable car nous avons intégré un certain nombre de fonctionnalités propriétaires et une nouvelle formule. Avec cette mise à jour, vous pourrez afficher des zones à double horaire. Vous pourrez non seulement afficher un TF plus élevé, mais afficher les deux, le graphique TF, PLUS le TF supérieur : AFFICHAGE DES ZONES NICHÉES. Tous les traders Supply Demand vont ado
                  ICT, SMC, SMART MONEY CONCEPTS, SMART MONEY, Smart Money Concept, Support and Resistance, Trend Analysis, Price Action, Market Structure, Order Blocks, BOS/CHoCH,   Breaker Blocks ,  Momentum Shift,   Supply&Demand Zone/Order Blocks , Strong Imbalance,   HH/LL/HL/LH,    Fair Value Gap, FVG,  Premium  &   Discount   Zones, Fibonacci Retracement, OTE, Buy Side Liquidity, Sell Side Liquidity, BSL/SSL Taken, Equal Highs & Lows, MTF Dashboard, Multiple Time Frame, BigBar, HTF OB, HTF Market Structure
                  L'indicateur de Carré Gann est un puissant outil d'analyse du marché basé sur l'article "Formule Mathématique pour les Prédictions de Marché" écrit par W.D. Gann. Cet outil utilise des concepts mathématiques et des théories de Gann pour réaliser une analyse précise du marché. Il utilise les carrés de 144, 90, 52 et aussi le carré de 9. De plus, il intègre la méthode du  pour le carré de 9 et sa relation avec les canaux et le modèle en étoile de ce carré. Manuel d'Utilisateur et Application : Ava
                  AW Trend Predictor MT5
                  AW Trading Software Limited
                  4.76 (54)
                  La combinaison des niveaux de tendance et de panne dans un seul système. Un algorithme d'indicateur avancé filtre le bruit du marché, détermine la tendance, les points d'entrée, ainsi que les niveaux de sortie possibles. Les signaux indicateurs sont enregistrés dans un module statistique, qui vous permet de sélectionner les outils les plus appropriés, montrant l'efficacité de l'historique des signaux. L'indicateur calcule les marques Take Profit et Stop Loss. Manuel et instruction ->   ICI   / v
                  Le profit de la structure du marché change à mesure que le prix s'inverse et recule. L'indicateur d'alerte d'inversion de la structure du marché identifie le moment où une tendance ou un mouvement de prix approche de l'épuisement et est prêt à s'inverser. Il vous avertit des changements dans la structure du marché qui se produisent généralement lorsqu'un renversement ou un recul majeur est sur le point de se produire. L'indicateur identifie initialement les cassures et la dynamique des prix,
                  The Volume by Price Indicator for MetaTrader 5 features Volume Profile and Market Profile TPO (Time Price Opportunity). Get valuable insights out of currencies, equities and commodities data. Gain an edge trading financial markets. Volume and TPO histogram bar and line charts. Volume Footprint charts. TPO letter and block marker charts including split structures. Versatile segmentation and compositing methods. Static, dynamic and flexible ranges with relative and/or absolute visualizations. Lay
                  Présentation       Quantum Breakout PRO   , l'indicateur révolutionnaire MQL5 qui transforme la façon dont vous négociez les zones d'évasion ! Développé par une équipe de traders expérimentés avec une expérience commerciale de plus de 13 ans,       Évasion quantique PRO       est conçu pour propulser votre parcours commercial vers de nouveaux sommets grâce à sa stratégie de zone de discussion innovante et dynamique. Quantum Breakout Indicator vous donnera des flèches de signalisation sur le
                  TrendLine PRO MT5
                  Evgenii Aksenov
                  4.78 (49)
                  The Trend Line PRO indicator is an independent trading strategy. It shows the trend change, the entry point to the transaction, as well as automatically calculates three levels of Take Profit and Stop Loss protection Trend Line PRO is perfect for all Meta Trader symbols: currencies, metals, cryptocurrencies, stocks and indices Advantages of Trend Line PRO Never redraws its signals The possibility of using it as an independent strategy It has three automatic levels Take Profit and Stop Loss lev
                  Owl Smart Levels MT5
                  Sergey Ermolov
                  4.47 (36)
                  Version MT4   |  FAQ L' indicateur Owl Smart Levels est un système de trading complet au sein d'un seul indicateur qui comprend des outils d'analyse de marché populaires tels que les fractales avancées de Bill Williams , Valable ZigZag qui construit la structure d'onde correcte du marché et les niveaux de Fibonacci qui marquent les niveaux exacts d'entrée. sur le marché et les endroits où prendre des bénéfices. Description détaillée de la stratégie Mode d'emploi de l'indicateur Conseiller-Assis
                  Gartley Hunter Multi
                  Siarhei Vashchylka
                  5 (5)
                  Gartley Hunter Multi - An indicator for searching for harmonic patterns simultaneously on dozens of trading instruments and on all classic timeframes: (m1, m5, m15, m30, H1, H4, D1, Wk, Mn). Manual (Be sure to read before purchasing) | Version for MT4 Advantages 1. Patterns: Gartley, Butterfly, Shark, Crab. Bat, Alternate Bat, Deep Crab, Cypher 2. Simultaneous search for patterns on dozens of trading instruments and on all classic timeframes 3. Search for patterns of all possible sizes. Fr
                  Trend Line Map Pro MT5
                  STE S.S.COMPANY
                  4.67 (9)
                  Trend Line Map indicator is an addons for   Trend Screener Indicator . It's working as a scanner for all signals generated by Trend screener ( Trend Line Signals ) . It's a Trend Line Scanner based on Trend Screener Indicator.  If you don't have Trend Screener Pro Indicator,   the Trend Line Map Pro will not work.     LIMITED TIME OFFER : Trend Line Map Indicator is available for only 50 $ and lifetime. ( Original price 125$ ) By accessing to our MQL5 Blog,  you can find all our premium indica
                  TrendDecoder Premium MT5
                  Christophe, Pa Trouillas
                  5 (1)
                  Identifiez les ranges et les tendances fortes  |  Obtenez les premiers signaux   |    Obtenez des TP et des sorties   clairs   |    Repérer les niveaux Fibo que le prix va tester   |  Indicateur qui ne retrace pas, non retardé - idéal pour le trading manuel et automatisé - adapté à tous les actifs et à toutes les unités de temps - 50% discount   pour le lancement - puis retour à >>   149 $ Après votre achat,   contactez-moi sur ce canal  pour obtenir les réglages recommandés. Version MT4 :   cli
                  MetaBands M5
                  Vahidreza Heidar Gholami
                  4.67 (3)
                  MetaBands uses powerful and unique algorithms to draw channels and detect trends so that it can provide traders with potential points for entering and exiting trades. It’s a channel indicator plus a powerful trend indicator. It includes different types of channels which can be merged to create new channels simply by using the input parameters. MetaBands uses all types of alerts to notify users about market events. Features Supports most of the channel algorithms Powerful trend detection algorith
                  TPSpro TRENDPRO  - is a trend indicator that automatically analyzes the market and provides information about the trend and each of its changes, as well as giving signals for entering trades without redrawing! The indicator uses each candle, analyzing them separately. referring to different impulses - up or down impulse. Exact entry points into transactions for currencies, crypto, metals, stocks, indices!  -  Version MT4                  DETAILED DESCRIPTION        /       TRADING SETUPS       
                  Dessine automatiquement les niveaux de support et de résistance PLUS les écarts des bougies de propulsion sur votre graphique, afin que vous puissiez voir où le prix est susceptible de se diriger ensuite et/ou de s'inverser potentiellement. Cet indicateur est conçu pour être utilisé dans le cadre de la méthodologie de trading de position enseignée sur mon site web (The Market Structure Trader) et affiche des informations clés pour le ciblage et les entrées potentielles. MT4 Version:  https://
                  Golden Spikes Detector
                  Batsirayi L Marango
                  5 (1)
                  Golden Spikes Detector Cet indicateur est basé sur une stratégie avancée principalement pour les pics de trading sur les indices Boom et Crash. Des algorithmes complexes ont été mis en œuvre pour détecter uniquement les entrées à forte probabilité. Il alerte sur les entrées potentielles d’achat et de vente. Pour échanger des pics sur le courtier Deriv ou Binary, prenez uniquement les alertes Buy Boom et Sell Cash. Il a été optimisé pour être chargé sur une période de 5 minutes, bien qu'une analy
                  IX Power MT5
                  Daniel Stein
                  5 (2)
                  IX Power   apporte enfin la précision imbattable de FX Power aux symboles non-Forex. Il détermine avec précision l'intensité des tendances à court, moyen et long terme de vos indices, actions, matières premières, ETF et même crypto-monnaies préférés. Vous pouvez   analyser tout ce que   votre terminal a à offrir. Essayez-le et découvrez comment   votre timing s'améliore considérablement   lors de vos transactions. Caractéristiques principales d'IX Power Résultats de calcul précis à 100 %,
                  Smart Peak Bottom
                  Xiaoyu Huang
                  5 (2)
                  Il s'agit d'un indicateur clair pour juger des hauts et des bas, et cela fonctionne bien pour le marché oscillant. Prix promotionnel 49$ → 59$ caractéristiques bon pour juger des hauts et des bas Pas de redessin, pas de dérive Calcul rapide, pas de décalage Mode de rappel riche Plusieurs paramètres et couleurs peuvent être ajustés paramètre "======== Principal ========" HighLowPeriod1 = 9 HighLowPeriod2 = 60 HighLowPeriod3 = 34 HighLowEMAPeriod = 4 MASignalPeriod = 5 "======== Notifier ==
                  Plus de l'auteur
                  Multicurrency and multi timeframe modification of the Relative Strength Index (RSI) indicator. You can specify any desired currencies and timeframes in the parameters. Also, the panel can send notifications when crossing overbought and oversold levels. By clicking on a cell with a period, this symbol and period will be opened. This is MTF Scanner. The key to hide the dashboard from the chart is "D" by default. Similar to the Currency Strength Meter, the Dashboard can automatically select pairs
                  ZigZag Dashboard for MT5
                  Taras Slobodyanik
                  5 (2)
                  Multicurrency and multitimeframe modification of the ZigZag indicator. Displays the current direction of the market, the height of the last movement, the number of bars in this movement and the breaking of the previous point of the ZigZag (horizontal line). This is MTF Scanner. You can specify any desired currencies and timeframes in the parameters. Also, the panel can send notifications when the ZigZag changes direction or when there was a breakthrough of the previous point. By clicking on a
                  ADX Dashboard MT5
                  Taras Slobodyanik
                  5 (3)
                  ADX indicator is used to determine the trend and its strength. The direction of the price is shown by the +DI and -DI values, and the ADX value shows the strength of the trend. If +DI is above -DI, then the market is in an uptrend, if on the contrary, it is a downtrend. If ADX is below 20, then there is no definite direction. As soon as the indicator breaks this level, a medium-strength trend begins. Values above 40 indicate a strong trend (a downtrend or an uptrend). Multicurrency and multit
                  ZigZag Lines MTF
                  Taras Slobodyanik
                  4.27 (11)
                  Multi timeframe ZigZag indicator. It displays the support/resistance horizontal lines and their breakouts, as well as draws the current targets of the market. It can also display lines of the Fractals indicator and candles from other periods (up to Quarterly).  The indicator redraws the last (current) point, and in some cases can change the last 2-3 points. All lines are drawn as objects (not indicator buffers, but there is a possibility to receive the data for the EA ). When used in an Exp
                  ADX Dashboard
                  Taras Slobodyanik
                  5 (3)
                  ADX indicator is used to determine the trend and its strength. The direction of the price is shown by the +DI and -DI values, and the ADX value shows the strength of the trend. If +DI is above -DI, then the market is in an uptrend, if on the contrary, it is a downtrend. If ADX is below 20, then there is no definite direction. As soon as the indicator breaks this level, a medium-strength trend begins. Values above 40 indicate a strong trend (a downtrend or an uptrend). Multicurrency and multit
                  ZigZag Dashboard for MT4
                  Taras Slobodyanik
                  4.75 (4)
                  Multicurrency and multitimeframe modification of the ZigZag indicator. Displays the current direction of the market, the height of the last movement, the number of bars in this movement and the breaking of the previous point of the ZigZag (horizontal line). This is MTF Scanner. You can specify any desired currencies and timeframes in the parameters. Also, the panel can send notifications when the ZigZag changes direction or when there was a breakthrough of the previous point. By clicking on a
                  MA Dashboard
                  Taras Slobodyanik
                  4.5 (2)
                  Multicurrency and multitimeframe modification of the indicator Moving Average (MA). On the dashboard you can see the current state of the indicator - breakouts and touches (by price) of the Fast MA and Slow MA, as well as the intersection of the MA lines between each other (moving average crossover) . In the parameters you can specify any desired currencies and timeframes. Also, the indicator can send notifications about the price touching the lines and about their crossing. By clicking on a cel
                  Lines Profit Loss MT5
                  Taras Slobodyanik
                  4.57 (14)
                  The indicator displays profit (loss) on the current symbol. You can freely drag and drop the line to display the current profit or loss. Parameters Calculation in money or in points — calculate the profit/loss in points or money. Add pending orders to calculate — take pending orders into account in calculations. Magic Number (0 - all orders on symbol) — magic number, if it is necessary to evaluate specific orders. Offset for first drawing (points from the average price) — offset of the line f
                  FREE
                  Time Scale for MT5
                  Taras Slobodyanik
                  4.88 (16)
                  The indicator draws the time scale on the chart. You can specify the time offset, adjust the size and font to display on the chart ( it is displaying your local time on your chart instead of MT time ). You can also select the desired format for displaying the date and time. You may be interested in my other product , which contains a more advanced version of the Time Scale . Parameters Hours (time shift) — time shift (hours); Minutes (time shift) — time shift (minutes); Show time on mouse — sh
                  FREE
                  The Gann Box (or Gann Square) is a market analysis method based on the "Mathematical formula for market predictions" article by W.D. Gann. This indicator can plot three models of Squares: 90, 52(104), 144. There are six variants of grids and two variants of arcs. You can plot multiple squares on one chart simultaneously. Parameters Square — selection of a square model: 90 — square of 90 (or square of nine); 52 (104) — square of 52 (or 104); 144 — universal square of 144; 144 (full) — "full"
                  Multicurrency and multi-timeframe indicator Inside Bar (IB). In the parameters, you can specify any desired currencies and timeframes. The panel displays the last found Inside Bar (and Mother Bar) pattern, the current price position and the breakout of the levels of the Mother and Inside Bars. You can set the size and color for bars and text in the cells. The indicator can also send notifications when levels are broken. By clicking on a cell with a period, the specified symbol and period will b
                  Heikin Ashi Dashboard
                  Taras Slobodyanik
                  5 (3)
                  Multi-currency and multitimeframe Heikin Ashi indicator. Shows the current state of the market. On the scanner panel you can see the direction, strength and number of bars of the current trend. The Consolidation/Reversal candles are also shown using color. You can specify any desired currencies and periods in the parameters. Also, the indicator can send notifications when the trend changes or when reversal and consolidation candles (dojis) appear. By clicking on a cell, this symbol and period wi
                  Multicurrency and multitimeframe indicator of the Standard Deviation Channel. Displays the current direction of the market. On the panel, you can see breakouts and touches (by price) of the levels of the linear regression channel. In the parameters, you can specify any desired currencies and timeframes. Also, the indicator can send notifications when levels are touched. By clicking on a cell, this symbol and period will be opened. This is MTF Scanner. The key to hide the dashboard from the char
                  Lines Profit Loss
                  Taras Slobodyanik
                  4.82 (22)
                  The indicator displays profit (loss) on the current symbol. You can freely drag and drop the line to display the current profit or loss. Parameters Calculation in money or in points — calculate the profit/loss in points or money. Add pending orders to calculate — take pending orders into account in calculations. Magic Number (0 - all orders on symbol) — magic number, if it is necessary to evaluate specific orders. Offset for first drawing (points from the average price) — offset of the line fr
                  FREE
                  MACD Dashboard MT5
                  Taras Slobodyanik
                  5 (1)
                  Multi-currency and multi-timeframe indicator MACD. The dashboard can display both the Traditional (true) MACD and the MACD which is built into MetaTrader. On the panel you can see the current state of the indicator — the direction of movement of the MACD lines, their intersection and a pop-up window with the indicator chart. In the parameters you can specify any desired pairs-symbols and timeframes. The scanner can also send notifications about lines crossing each other and about lines crossing
                  Multicurrency and multitimeframe modification of the Stochastic Oscillator. You can specify any desired currencies and timeframes in the parameters. The panel displays the current values and intersections of the lines — Signal and Main (stochastics crossover). Also, the indicator can send notifications when crossing overbought and oversold levels. By clicking on a cell with a period, this symbol and period will be opened. This is MTF Scanner. The key to hide the dashboard from the chart is "D"
                  Multicurrency and multitimeframe modification of the Stochastic Oscillator. You can specify any desired currencies and timeframes in the parameters. The panel displays the current values and intersections of the lines — Signal and Main (stochastics crossover). Also, the indicator can send notifications when crossing overbought and oversold levels. By clicking on a cell with a period, this symbol and period will be opened. This is MTF Scanner. The key to hide the dashboard from the chart is "D"
                  Pro Sessions MT4
                  Taras Slobodyanik
                  4 (2)
                  This is an indicator of trading sessions  that can display all levels (Open-High-Low-Close) for four sessions. The indicator can also predict session levels. Sessions can be drawn with lines or rectangles (empty or filled), lines can be extended to the next session. You can easily hide/show each session by pressing hotkeys (by default '1', '2', '3', '4'). You can see ASR (Average Session Range) lines  (default hotkey 'A'). This is similar to the ADR calculation, only it is calculated based on t
                  MA Dashboard MT5
                  Taras Slobodyanik
                  5 (4)
                  Multicurrency and multitimeframe modification of the indicator Moving Average (MA). On the dashboard you can see the current state of the indicator - breakouts and touches (by price) of the Fast MA and Slow MA, as well as the intersection of the MA lines between each other (moving average crossover). In the parameters you can specify any desired currencies and timeframes. Also, the indicator can send notifications about the price touching the lines and about their crossing. By clicking on a cell
                  ZigZag Lines MTF for MT5
                  Taras Slobodyanik
                  5 (7)
                  Multi timeframe ZigZag indicator. It displays the support/resistance horizontal lines and their breakouts, as well as draws the current targets of the market. It can also display lines of the Fractals indicator and candles from other periods (up to Quarterly).  The indicator redraws the last (current) point, and in some cases can change the last 2-3 points. All lines are drawn as objects (not indicator buffers, but there is a possibility to receive the data for the EA ). When used in an Exp
                  Time Scale
                  Taras Slobodyanik
                  4.8 (10)
                  The indicator draws the time scale on the chart. You can specify the time offset, adjust the size and font to display on the chart (it is displaying your local time on your chart instead of MT time). You can also select the desired format for displaying the date and time. While holding down the middle mouse button, and moving the cursor, a slider will appear on the scale. You may be interested in my other product , which contains a more advanced version of the Time Scale. Parameters Hours (tim
                  FREE
                  Multi-currency and multitimeframe Heikin Ashi indicator. Shows the current state of the market. On the scanner panel you can see the direction, strength and number of bars of the current trend. The Consolidation/Reversal candles are also shown using color. You can specify any desired currencies and periods in the parameters. Also, the indicator can send notifications when the trend changes or when reversal and consolidation candles (dojis) appear. By clicking on a cell, this symbol and period wi
                  Pro Sessions MT5
                  Taras Slobodyanik
                  5 (1)
                  This is an indicator of trading sessions  that can display all levels (Open-High-Low-Close) for four sessions . The indicator can also predict session levels. Sessions can be drawn with lines or rectangles (empty or filled), lines can be extended to the next session. You can easily hide/show each session by pressing hotkeys (by default '1', '2', '3', '4'). You can see ASR (Average Session Range) lines  (default hotkey 'A'). This is similar to the ADR calculation, only it is calculated based on
                  Multicurrency and multitimeframe modification of the Relative Strength Index (RSI) indicator. You can specify any desired currencies and timeframes in the parameters. Also, the panel can send notifications when crossing overbought and oversold levels. By clicking on a cell with a period, this symbol and period will be opened. This is MTF Scanner. The key to hide the dashboard from the chart is "D" by default. Similar to the Currency Strength Meter, the Dashboard can automatically select pairs c
                  News Dashboard MT4
                  Taras Slobodyanik
                  4.33 (6)
                  This dashboard displaying current news from ForexFactory.com (calendar FFC) and from the Investing.com website . You can sort news by impact and by country, and display them on the chart with one click. By holding down the 'Ctrl' key, you can select several different 'currencies' or 'impacts' to sort. Also, this utility shows not only the forecast, but also the actual values ​​after they appear on the site. You can set a separate notification for each news. You can read the news using your EA
                  Symbol Manager for MT5
                  Taras Slobodyanik
                  5 (1)
                  Symbol Manager or Grid Manager, designed to group orders into one position (by symbol and by direction). This utility will be useful to multi-currency traders, who can have multiple orders on several pairs. You will be able to see the total number of lots, the total profit, and set virtual stop loss and virtual take profit. To set a real TP (or SL), you must first set the virtual value, and then enter the command in this cell: "set". If you want to set real TP/SL for all orders at once, then en
                  MACD Dashboard
                  Taras Slobodyanik
                  Multi-currency and multi-timeframe indicator MACD. The dashboard can display both the Traditional (true) MACD and the MACD which is built into MetaTrader. On the panel you can see the current state of the indicator — the direction of movement of the MACD lines, their intersection and a pop-up window with the indicator chart. In the parameters you can specify any desired pairs-symbols and timeframes. The scanner can also send notifications about lines crossing each other and about lines crossing
                  The indicator calculates the inclination angle between the Highs, Lows and Closes of adjacent bars. The angle can be measured in degrees or radians. A linear graph or a histogram is drawn in a subwindow. You can set the scale for the calculation — floating or fixed. For use in Expert Advisors or indicators, you need to specify a fixed scale. Parameters Angular measure — degrees or radians. Scale mode for calculation — scaling mode. Free scale — free transformation, the indicator will calculate
                  FREE
                  The indicator has three main tools: Magnifier (Zoom chart), Ruler  ( Time and Price scales ),   and Crosshair. You can move it all around with your mouse and customize different formats for  displaying , customize   size and color of each element. The Magnifier (zoom chart) allows you to display candles from any time frame and at different scales. Default hotkeys: 'Q' - higher timeframe, 'A' - lower timeframe, 'W' - decrease candle size, 'S' - increase candle size, 'Z' - show/hide zoom chart.
                  The indicator has three main tools: Magnifier (Zoom chart), Ruler  ( Time and Price scales ),   and Crosshair. You can move it all around with your mouse and customize different formats for  displaying , customize   size and color of each element. The Magnifier (zoom chart) allows you to display candles from any time frame and at different scales. Default hotkeys: 'Q' - higher timeframe, 'A' - lower timeframe, 'W' - decrease candle size, 'S' - increase candle size, 'Z' - show/hide zoom chart.
                  Filtrer:
                  Adz trading
                  98
                  Adz trading 2023.05.30 16:14 
                   

                  very useful indicator i have a trend multitimeframe of and overbrought oversold crossing level top

                  Répondre à l'avis
                  Version 3.70 2024.04.19
                  1) For the "Alert when CCI crosses Zero level" parameter, modes have been added to select the direction of intersections.
                  Version 3.60 2024.03.14
                  1) Changed the behavior of setting the timer at startup. Now the indicator tries to start the timer again when a new tick arrives. If there is no tick for a long time (or it’s a weekend), you can click on the button on the chart and restart the timer yourself.
                  Version 3.50 2023.11.11
                  1) Added automatic shifting of the dashboard to the foreground.
                  Version 3.40 2023.10.15
                  1) The "Y-offset (pix, +/-)" parameter can now be negative.
                  2) Changed the behavior of the pop-up chart when the window is small.
                  Version 3.30 2023.09.03
                  1) Added "Hotkey to enable/disable the Popup chart" parameter for "Popup chart".
                  2) Added "Y-offset (pix)" parameter for "Popup chart".
                  Version 3.20 2023.08.27
                  1) Added a Dashboard recovery check when running multiple copies on the same chart.
                  Version 3.10 2023.08.25
                  1) Returned the deletion of the dashboard from the chart at startup.
                  Version 3.0 2023.08.18
                  1) Optimization of pop-up windows for MT5.
                  Version 2.90 2023.07.29
                  1) Added a hotkey to hide the dashboard, by default "D".
                  2) The condition of the list of pairs for the second parameter has been changed. Pairs in the second parameter must be typed only with a semicolon and must be in exact case. "Pairs (separated ONLY by a semicolon and have exact letter case)"
                  Version 2.80 2023.07.17
                  1) Added "Popup chart" parameters. Now, when you hover the mouse over the cells, you can see a pop-up chart from this timeframe.
                  2) Fixed some minor bugs.
                  Version 2.70 2023.06.03
                  1) Added the ability to enable/disable alerts for each Symbol when clicking on the name of the Pair. If no Pair is selected then alerts are enabled for all Symbols.
                  Version 2.60 2023.05.31
                  1) Added "Color scheme" parameter.
                  Version 2.50 2023.05.30
                  1) Added "Coloring Text according to" parameter.
                  2) Added tooltips.
                  3) The current CCI settings have been added to the alerts.
                  4) Changed the color scheme.
                  Version 2.40 2022.11.11
                  1) Fixed bug with "Alert mode combined in a row".
                  Version 2.30 2022.10.19
                  1) Added separate parameters for each alert when entering and exiting the Overbought/Oversold zones.
                  Version 2.20 2022.09.20
                  1) Disabled stopping the indicator in case of an error starting the CCI. Now there will be a repeated attempt to launch the CCI.
                  Version 2.10 2022.09.08
                  1) Added parameters to change table colors.
                  Version 2.0 2022.04.18
                  1) Added a parameter to highlight the current Pair and TF.
                  Version 1.90 2021.10.26
                  1) Added the "Refresh cells only on new bar" parameter.
                  Version 1.80 2021.08.24
                  1) Fixed a bug when launching many indicators with the "Current pair" parameter.
                  Version 1.70 2021.04.14
                  1) Added parameter "Enable zero crossing alerts".
                  2) Added parameter "Allow to move the table manually".
                  Version 1.60 2021.03.19
                  1) Fixed a bug when disabling the table header.
                  Version 1.50 2021.03.13
                  1) Added options to disable the table headers.
                  Version 1.40 2021.02.12
                  1) Added parameters to disable (enable) the "Overbought" and "Oversold" signals.
                  Version 1.30 2020.06.08
                  1) Recompilation for the new MT5 build.
                  Version 1.20 2019.11.06
                  1) Changed the alert algorithm when the indicator starts.
                  Version 1.10 2019.10.27
                  1) Added periods for alerts - "Timeframes for alerts".
                  2) Added parameter for clearing the chart at startup - "Clear the chart at startup".
                  3) Added center alignment of the panel - "Centered".
                  4) Added offsets for the panel - "X offset (pix)" and "Y offset (pix)".
                  5) Reverse the order of pairs of "Market Watch" without sorting.