CCI currency strength meter
- Indicateurs
- Miroslav Stojic
- Version: 1.3
- Mise à jour: 8 février 2020
- Activations: 5
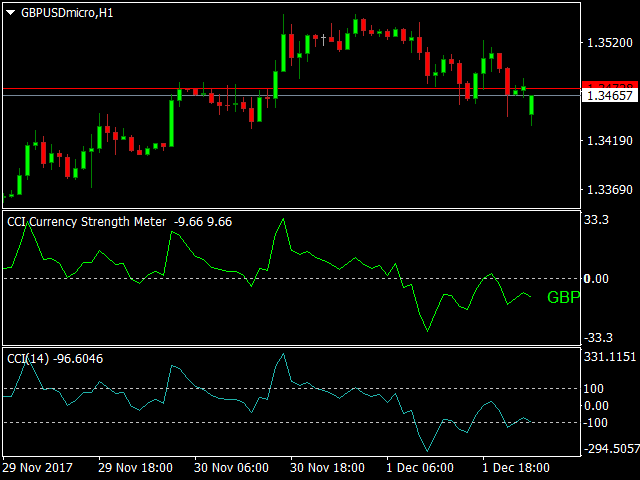
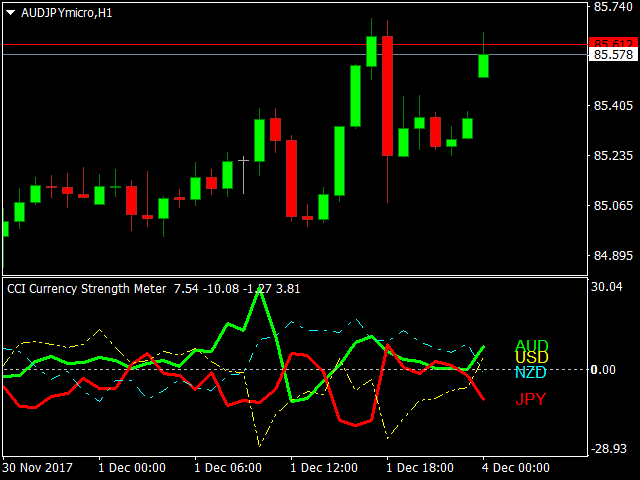
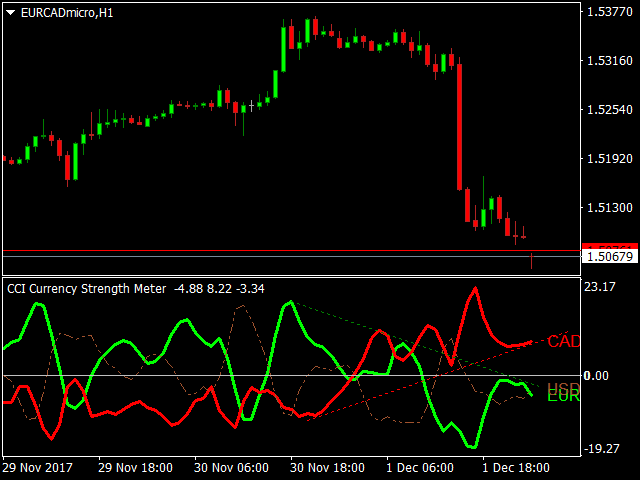
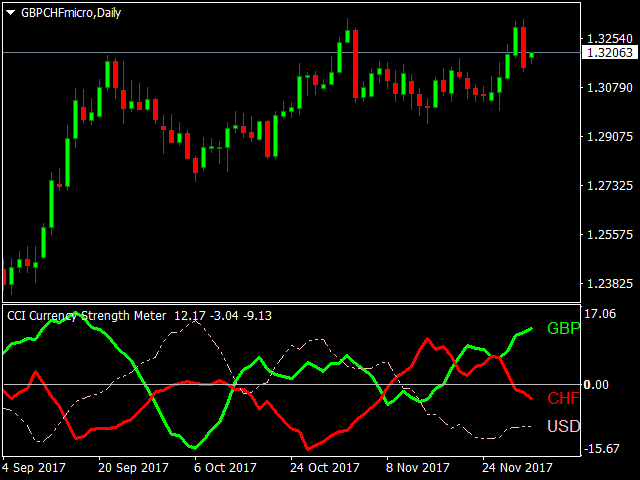
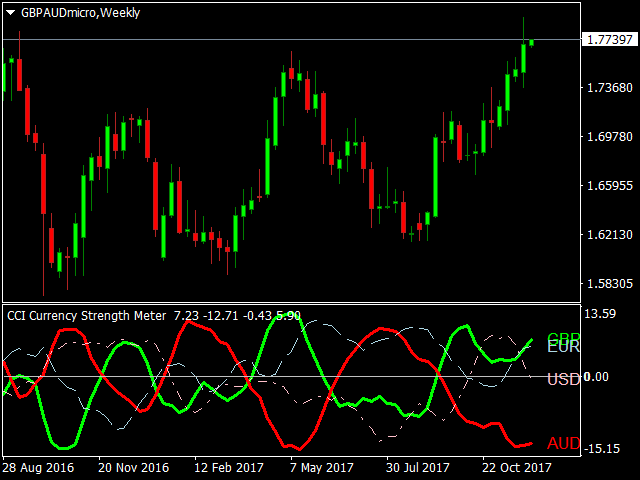
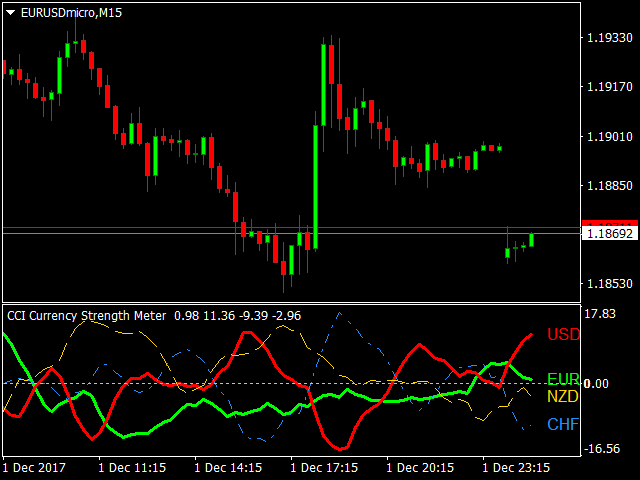
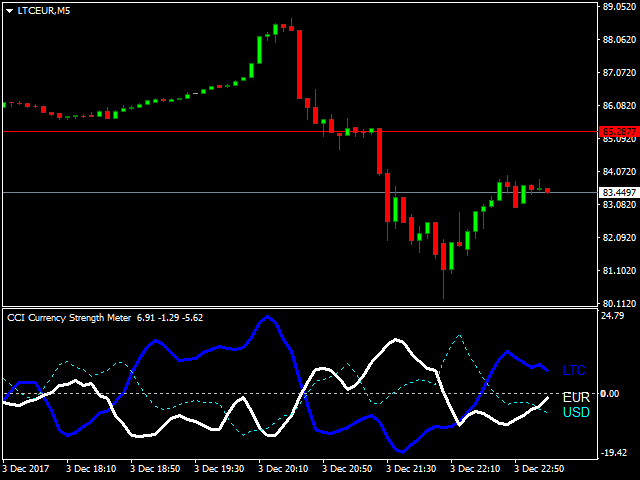
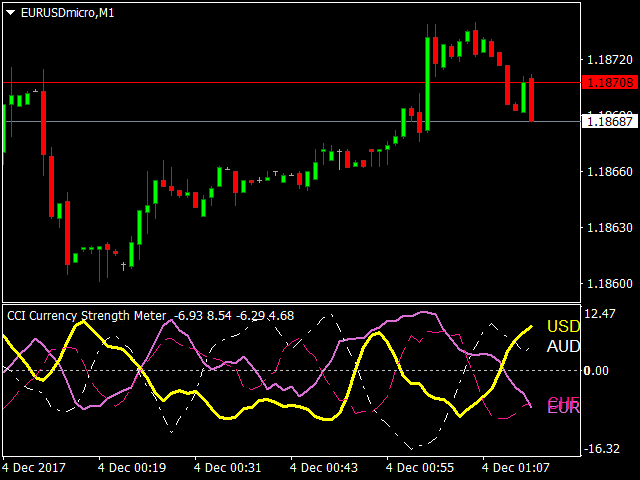
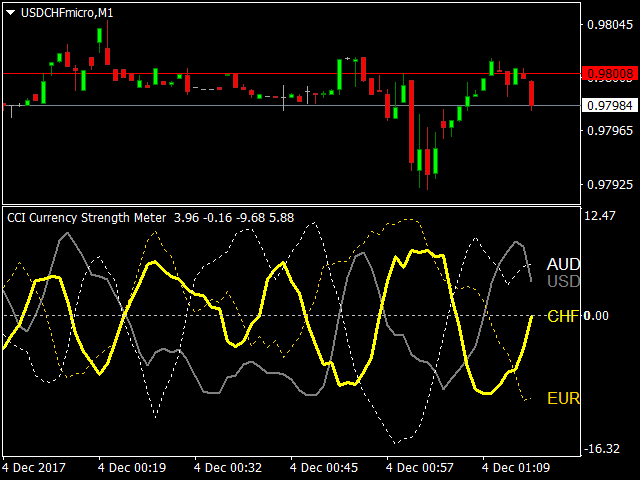
CCI Currency Strength Meter uses CCI (Commodity Channel Index) to monitor how strong a currency is, or in other words, if it's being bought or sold by the majority compared to the other currencies. If you load this indicator on a chart, it will first display the strength-lines of the currencies (base and counter currency of the chart) with changeable solid lines. Also, you can add up to five additional currencies to the "comparison pool," that already has the base and the profit (counter) currency. So, in total, you can display up to 7 lines.
Note: This is a multicurrency indicator. So, if you want to test this indicator, I provided the DEMO version that has a lot of limitations. The link to this DEMO version is: https://www.mql5.com/en/market/product/26981
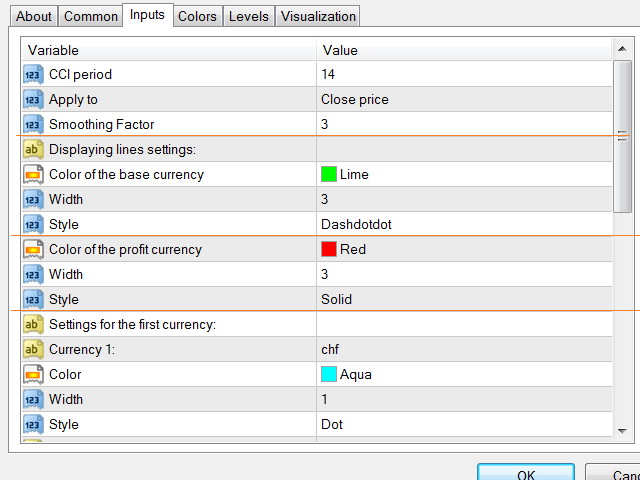
Settings for the CCI indicator used:
- CCI period: the period of the CCI (14 by default),
- Apply to: which price should CCI be based on (close, open, high, low, median...),
- Smoothing Factor: so that the lines don't look choppy; less or 1 = No smoothing, and 2 or more = smoothing applied (the smoothing factor applies to the CCI currency strength meter indicator, and not to the CCI used).
- History: the number of candles to be displayed.
Lines formatting for the base and counter currency:
- Color of the base currency: self-explanatory, select the color for the base currency,
- Width: width of the line of the base currency,
- Style: line style (solid, dash, dot...),
- Color of the profit currency: color for the counter currency,
- Width: width of the line of the profit currency,
- Style: the style of the line of the profit currency (solid, dot, dash...).
Next is formatting for the additional 5 currencies (this one example is the same for all 5):
- Currency n: write in the 3 letters symbol of the currency you want to display (examples: "eur" or "aUd" or "usD" or "NZD".."Btc" - all these formats are acceptable)
- Color: color of that selected currency,
- Width: line width,
- Style: line style (if width is 1).
The same is for the next 4 currencies. In total, you can display up to 7 currencies.
Suggestion: Watch the provided video to make everything clear and/or check out the DEMO version: https://www.mql5.com/en/market/product/26981.


i used this indicator for quite some time and it has yielded positive results - overall a very good indicator