Chart CCI 5
- Indicateurs
- Leonid Basis
- Version: 4.2
- Mise à jour: 20 novembre 2021
- Activations: 5
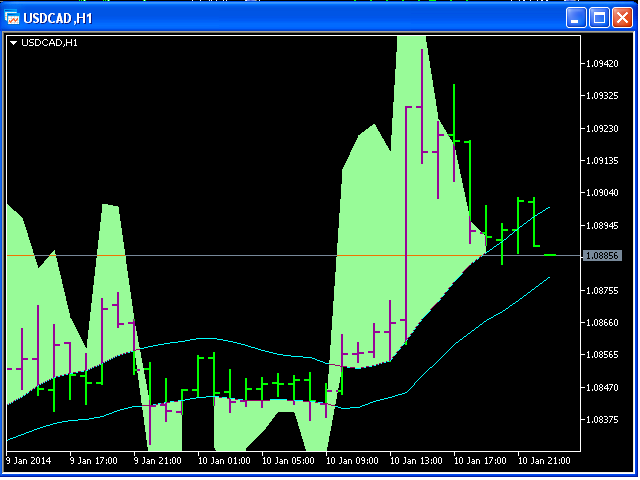
This indicator is a combination of 2 classical indicators: MA and CCI.
Two moving averages form Upper and Lower bands.
The input parameter nPeriod is used for MA and CCI calculations.
The PaleGreen clouds characterize Up and Down trends. The moment a cloud appears above or under upper or lower bound is the time to enter the market.