Gekko ADX Plus
- Indicateurs
- Rodrigo Galeote
- Version: 1.12
- Mise à jour: 17 février 2023
- Activations: 5
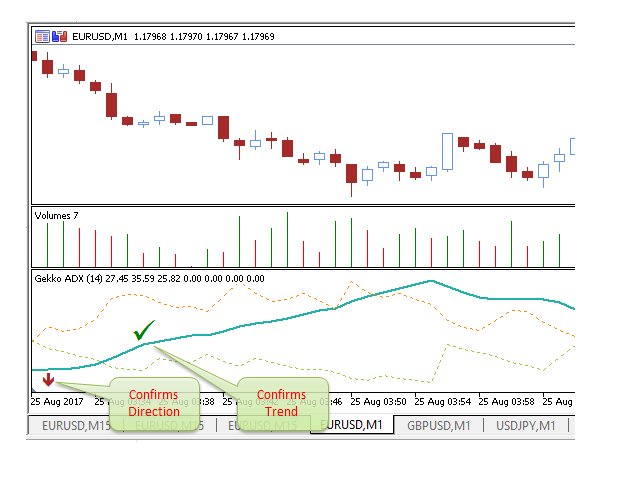
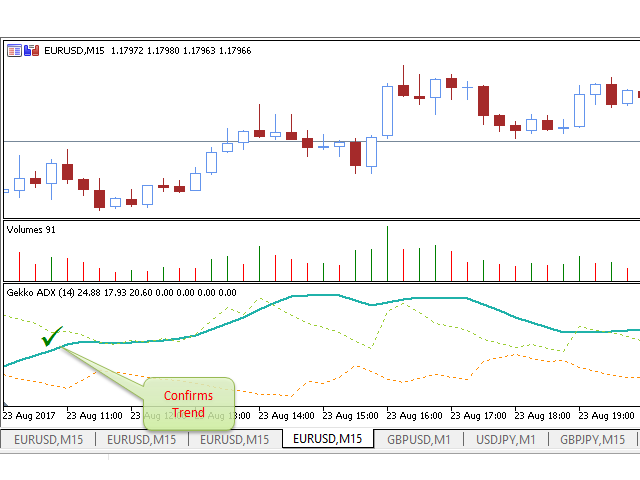
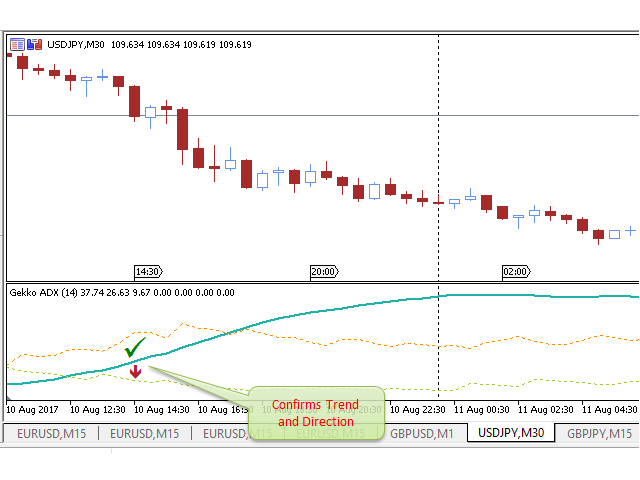
This is Gekko's Cutomized Cutomized Average Directional Index (ADX), a customized version of the famous ADX indicator. Use the regular ADX and take advantage two entry signals calculations and different ways of being alerted whenever there is potential entry or exit point.
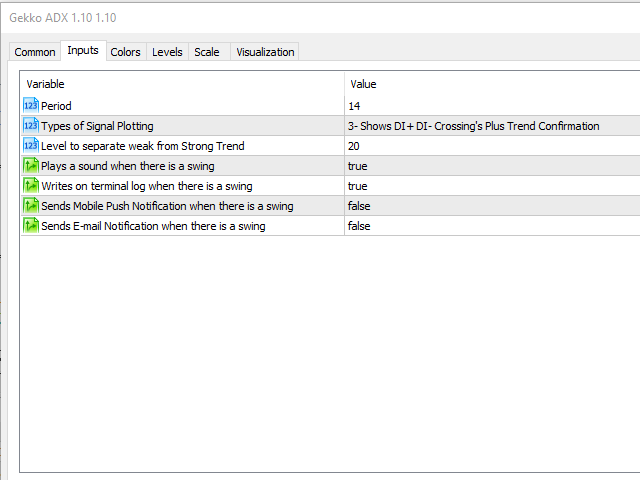
Inputs
- Period: Period for the ADX calculation;
- PlotSignalType: How will the indicator calculate entry (swing) signals:
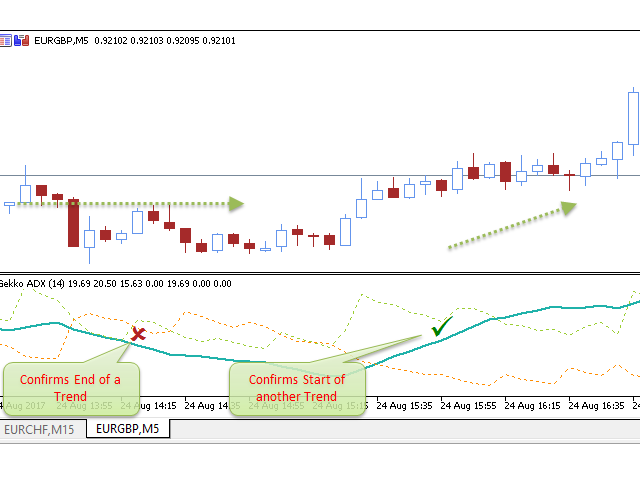
- 1- ShowSwingsOnTrendLevel: Show Signals for Trend Confirmation Swings;
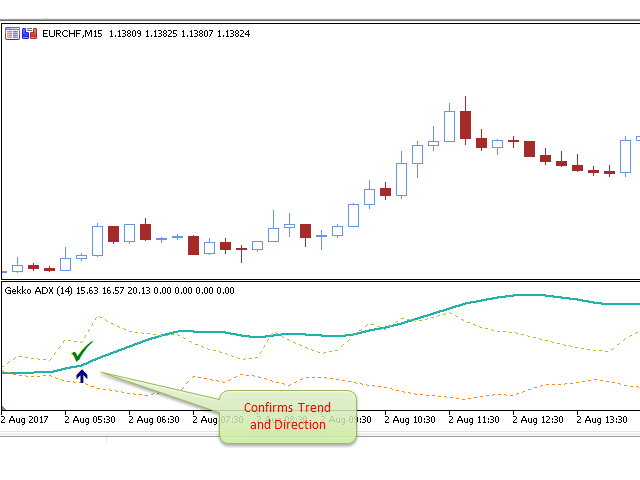
- 2- ShowSwingsOnTrendLevelDirection: Shows Signals for Trend Confirmation Swings Plus Entry Direction (Long or Short);
- 3- ShowSwingsOnPosAndNegDI: Shows Entry/Exit (Long or Short) Signals based on DI+ and DI- crossing plus Trend confirmation;
- Trend Level: The level used for confirming a Trend formation.
- Plays a sound when there is a swing: set it as true and it will play a sound on the Metatrader Terminal every time there's a swing on the trend, indicating entry or exit points.
- Write Logs On Terminal Window: set it as true if you want the indicator to write logs on the Terminal's Experts tab for signal swings;
- Send Mobile Push Notifications: set it as true if you desire to receive Push Notification on the MetaTrader app on your mobile for signal swings;
- Send E-Mail Alerts: set it as true if you desire to receive e-mail alerts at the e-mail address configured on the terminal for signal swings;
Good Trades!
Donate part of your profit to good causes and humanitarian entities of your choice, "Money only comes if there's a purpose for you to earn it" .