Sweepwell ICT Liquidity Suite
- Indicateurs
- Version: 1.0
- Activations: 10

SHORT (for the product card): Liquidity pools, sweeps with strength, CRT on H1/H4/D1, SMT divergence, FVG and inverse FVG, kill zones - one clean panel, closed bars only.
Sweepwell ICT Liquidity Suite marks where liquidity sits on your chart and shows when it is taken. It combines the ICT concepts that are discussed most often today - liquidity pools and sweeps, candle range theory (CRT), SMT divergence and inverse fair value gaps - in one indicator with one calm, readable look.
What It Draws
1. Liquidity pools (buy-side above highs, sell-side below lows)
- Equal highs and equal lows (EQH / EQL), tolerance as a fraction of ATR(14), with a dot on every touch
- Previous day high / low (PDH / PDL) and previous week high / low (PWH / PWL)
- Session highs / lows of Asia, London and New York (chart up to H1)
- Levels that sit on the same price are merged into one label (for example "BSL · EQH · NY H")
2. Liquidity sweeps
- A sweep = a candle wicks through a pool and closes back on the pool side. A close beyond the pool counts as "taken", not as a sweep.
- Every sweep gets a strength of 1 to 3 dots: how deep the wick went beyond the pool and how far the close came back (both measured in ATR).
3. CRT - candle range theory (H1, H4, D1)
- Candle 1 is the range (high, low, 50 %). Candle 2 sweeps one side and closes back inside: the opposite side of the range is drawn as the target.
- Choose the confirmation: candle 2 close (2-candle model) or the first chart candle closing back inside (early).
- The range the market trades against right now is shown as a light box; finished setups show "target ✓", "invalid" or "expired".
- Click H1 / H4 / D1 in the panel to switch the CRT timeframe on the chart.
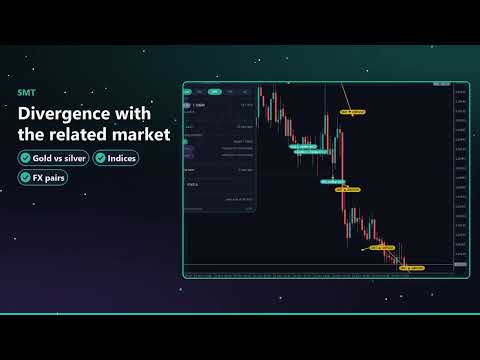
4. SMT divergence
- Compares swing highs / lows of the chart symbol with a correlated symbol. Automatic pairs: EURUSD/GBPUSD, AUDUSD/NZDUSD, XAUUSD/XAGUSD, US500/US100, US30/US500, EURJPY/GBPJPY, BTCUSD/ETHUSD, DE40/EU50, USDCHF/EURUSD (inverse) and more. Broker prefixes and suffixes (".US500Cash", "EURUSDm") are found automatically, or enter any symbol yourself.
5. Fair value gaps and inverse FVG
- FVG with consequent encroachment (50 % line). When a candle closes through a gap, the gap flips its role and is shown as inverse FVG (IFVG).
6. Kill zones
- ICT kill zones (New York clock) or sessions, daylight saving time handled for Europe and the US, server time offset detected automatically. Drawn as a quiet strip, so they never cover the price.
Dashboard
Nearest buy-side and sell-side pool with distance in ATR, last sweep with strength, CRT state for H1 / H4 / D1, last SMT divergence, open FVG / IFVG, current kill zone with countdown. Dark and light theme (automatic from the chart), English / German, size 90-150 %, can be moved and collapsed. The switch bar turns pools, sweeps, CRT, SMT, FVG and kill zones on or off.
Alerts
Popup, sound, push and e-mail for: liquidity sweep, confirmed CRT setup, SMT divergence, new inverse FVG. Every alert fires once, on a closed candle, with a cooldown per type.
No Repainting On Closed Candles
Everything is calculated from closed candles only, each candle once, in time order. A swing point is confirmed N candles later and is then never moved. What can still change is only the state of an object (active -> swept, open -> filled -> inverse, CRT active -> target / invalid), decided by later closed candles.
Before release this was checked with a self test on 7 symbols / timeframes (EURUSD H1, XAUUSD M15, BTCUSD M15, US500 M5, GBPJPY H4, AAPL H1, EURUSD M15 free edition): replay of the history cut at 20 points against the full history - 0 differences in every state after every candle, every sweep, CRT setup and SMT mark; every pool outcome recounted by brute force - 0 differences; PDH / PDL against the broker's daily candles and CRT setups against the broker's H1 / H4 / D1 candles - 0 differences; EA buffers against a fresh calculation - 0 differences.
For EA Developers: 14 Buffers (iCustom / CopyBuffer)
The value on a candle is the state that was known when this candle opened (no look-ahead in backtests).
0 nearest buy-side pool above (price), 1 nearest sell-side pool below
2 sweep on the last closed candle: +1..+3 sell-side swept, -1..-3 buy-side swept, 0 none
3 CRT state of the chart CRT timeframe: +2 / -2 setup active, +1 / -1 one side swept (waiting), 0 none
4 CRT target price, 5 50 % of the current CRT range
6 last SMT divergence (+1 bullish, -1 bearish), 7 candles since it was confirmed
8 last close inside: bit 1 bullish FVG, 2 bearish FVG, 4 bullish IFVG, 8 bearish IFVG
9 kill zone / session of the candle: bit 1 Asia, 2 London, 4 New York
10 previous day high, 11 previous day low
12 pool type of the last sweep (0 EQH, 1 EQL, 2 PDH, 3 PDL, 4 PWH, 5 PWL, 6-11 session highs / lows), 13 candles since the last sweep
Good To Know (honest limits)
- These are analysis tools. They show where liquidity is likely resting and what price did there. They do not predict the next move and are not a trading signal.
- SMT needs the second symbol at your broker with history on the same timeframe. If it does not exist, the panel says so and everything else keeps working.
- CRT candles are built from the chart's candles on the server clock (like the broker's H1 / H4 / D1). The CRT timeframe must be higher than the chart.
- Session pools and kill zones are shown on charts up to H1; PDH / PDL below D1.
- Equal highs / lows and SMT appear when the swing is confirmed (default 5 / 3 candles later), never earlier.
- Works on forex, metals, indices, crypto and stocks. No DLL, no web requests.
Free edition to try first: Sweepwell One (equal highs / lows, PDH / PDL, sweeps with strength, same look).