Unda
- Indicateurs
- Pavel Gotkevitch
- Version: 1.3
- Mise à jour: 24 mars 2022
- Activations: 5
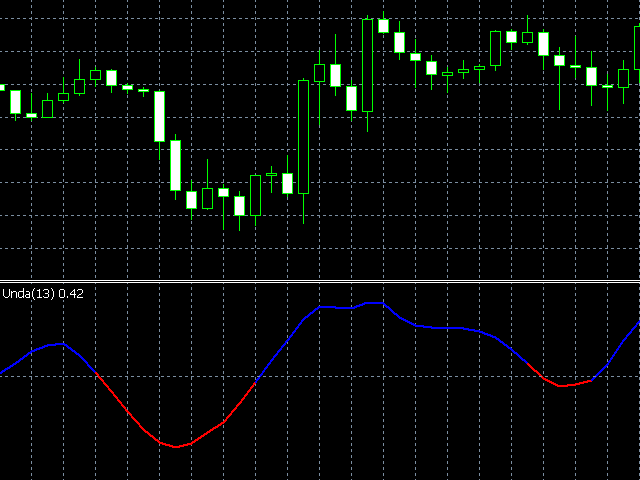
The Unda indicator determines the trend direction and strength, as well as signals about trend changes.
The indicator uses price extremums for the previous periods and calculates the ratio between the current price and extremums.
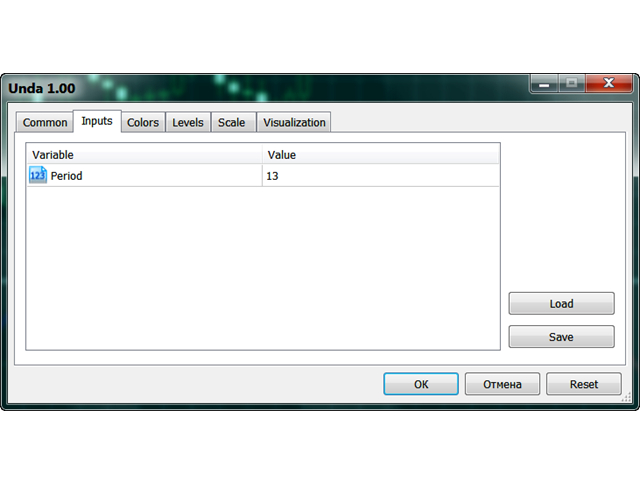
Therefore, the only parameter is Period (default = 13), which sets the number of bars to determine extremums.
The higher the Period, the less the number of signals about trend changes, but the greater the indicator delay.
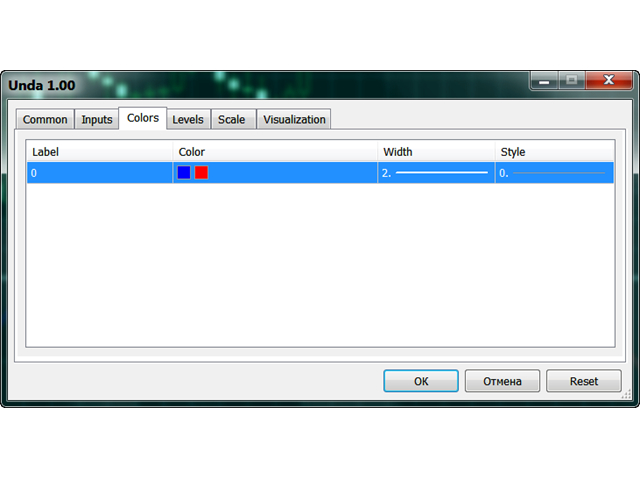
Uptrends are shown by blue color of the indicator line, downtrends by the red color.
The Inputs tab of the indicator allows to select the indicator period.
The Colors tab allows to choose the color, width and line style of the indicator.
Parameter of the Unda indicator
- period - the number of bars used for the indicator calculations.


L'utilisateur n'a laissé aucun commentaire sur la note