• Aperçu
  • Avis (17)
  • Commentaires (91)
  • Nouveautés

MIDAS Trading Tools

4.67

The introduction of the MIDAS Trading Tools indicator represents the culmination of my trading expertise and innovative application. By incorporating new concepts and collaborating with fellow traders like Robert Young (US), we have enriched and enhanced this indicator. In the sections below, you'll find detailed descriptions of the variables comprising this indicator.

MIDAS which is an acronym for Market Interpretation/Data Analysis System is the innovative work of the late technical analyst Paul Levine. Levine strongly believed that the dynamic interplay of support and resistance and accumulation and distribution are the ultimate determinants of price behavior. After examining and rejecting all of the standard technical analysis techniques for determining support and resistance, he came up with a new approach - MIDAS!

MIDAS Trading Tools consists of two standalone indicators tailored for different market environments:

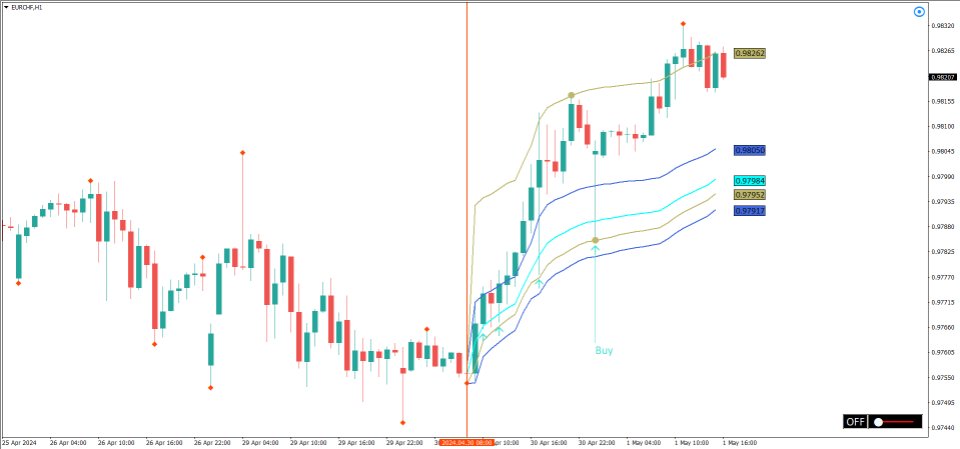
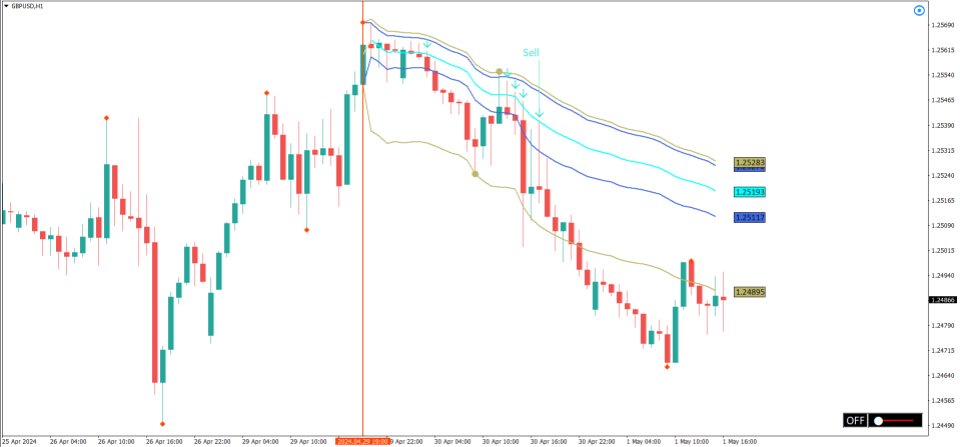
1. MIDAS Support/Resistance Curves: Unveils potent support and resistance levels while providing a method to assess the relative strength of a prevailing trend.
2. MIDAS Top-Bottom Finder Algorithm: Monitors the available "fuel" within an accelerating trend to anticipate potential tops or bottoms based on cumulative volume.

Basic Strategy & Concept

1. Identify a trend in any market.
2. Attach MIDAS Trading Tools to your chart.

3. Click on the red vertical line and drag it to a recommended anchor point ◆.
4. Activate the Buy/Sell Alert System by clicking the circled button in the top right corner. White = OFF / Blue = ON.
5. Wait for the price to retract to the MIDAS Support/Resistance curve, signaling a buy or sell opportunity.
6. Enter the market when a signal is generated, ensuring a minimum risk-to-reward ratio of 1:1+.
7. If the price accelerates away before fully retracing to the MIDAS Curve, launch and adjust the Top-Bottom Finder to the current pullback(s) by manipulating the cumulative volume in the bottom right corner to predict potential tops or bottoms.
8. When the Top-Bottom Finder reaches 100%, a retracement to the MIDAS Support/Resistance curve becomes probable.


For those new to the MIDAS Trading System and eager to explore the powerful trading methodology pioneered by the late Paul Levine, I suggest delving into "MIDAS Technical Analysis: A VWAP Approach to Trading and Investing in Today's Markets." The authors guide you through the fascinating MIDAS universe, elucidating its variations with abundant charts and examples. Start by perusing the introductory chapters, then dive into the practical, profit-oriented Chapter 8 to apply these principles firsthand.

Parameters

  • Show Recommended Anchor Points: True/False
  • Show Displacement Curves: Yes/No
  • Top-Bottom Finder Fuel Step (Cumulative Volume): 5
  • Show Signal: Yes/No
  • Show Signal for...: All/Retracement/Break
  • Signal Color: Yellow
  • Pop-Up Alert: Yes/No
  • Pop-Up Alert Sound: ok.wav
  • Push Notification: Yes/No
  • Email Message: Yes/No


Avis 17
Epsilon Hogas
1497
Epsilon Hogas 2022.06.16 05:22 
 

Its a good indicator for identifying pullback buy position, thank you

Dapo01
366
Dapo01 2022.05.11 21:12 
 

Very effective Indicator for predicting price reversal. It is quite precise. Very supportive telegram group. Great trade with precise entry today. Highly recommended.

Irfan
590
Irfan 2022.05.11 18:20 
 

It is really a very effective trading tool. Also great support and guidance from the author.

Produits recommandés
Reversal Pattern Pro
Boonyapagorn Rodvattanajinda
Reversal Patterns Pro Reversal Patterns Pro is a Price Action (PA) analytical tool that scans the reversal patterns.  - Finds and marks the most dependable Japanese candlestick patterns in real-time. - Supports all time frames (Best for Scalping) - Doesn't repaint making it an exceptional indicator for Expert Advisors. Input parameters : - Support & Resistance Mode ( true or false ) for enabling advanced filtering - Donchian Period - RSI Period - RSI Oversold Level - RSI Overbought Level - 
Fibonacci SR Indicator This indicator creates support and resistance lines. This indicator is based on Fibonacci Retracement and Extension levels. It will consider many combinations of the Fibonacci levels and draw support/resistance lines based on these. This indicator uses tops and bottoms drawn by the ZigZag indicator in its calculations. The ZigZag can also be drawn on the chart, if necessary. The indicator considers many combinations of past reversal points and Fibonacci ratio levels, and
FREE
COG LR Osc AM
Andriy Matviyevs'kyy
The presented indicator allows you to determine potential entry points into the market and set protective orders at reasonable levels. This product can be useful for both beginners and experienced traders. The indicator is based on calculation methods proven by time and practicing traders. The indicator is calculated in two stages: At the first stage, linear regression (LR) of the selected price type is determined for a given number of chart periods. At the second stage, the obtained data is p
Day Pattern
Oleksandr Martsynyshen
Description: - D ay Pattern - an indicator that helps to identify patterns of price changes for the development of trading algorithms and strategies. For whom this tool? - For developers of trading strategies and algorithms. - Medium- and long-term traders. Time frames H1-W1. Features of the indicator: - There is a function of exporting indicator values to a file of the csv format. - Using the information panel, you can conduct an express analysis of trading tool. - The indicat
Bigger chart labels would allow the user to be entirely aware of which chart he/she is on. Each chart window is unique, containing different patterns and economic motives so acknowledging the chart window would be absolutely essential! There are well known Economic Time Zones included in clear view, by choice!    Simple does it! Use your computing mouse scroller, clicking with the right finger on the label, in order to customize the label properties. From there, choose your preferred color, fon
FREE
Introduction to X3 Chart Pattern Scanner X3 Cherart Pattern Scanner is the non-repainting and non-lagging indicator detecting X3 chart patterns including Harmonic pattern, Elliott Wave pattern, X3 patterns, and Japanese Candlestick patterns. Historical patterns match with signal patterns. Hence, you can readily develop the solid trading strategy in your chart. More importantly, this superb pattern scanner can detect the optimal pattern of its kind. In addition, you can switch on and off individu
Fibonacci retracement is one of the most reliable and used technical analysis tools for trading. It uses the so called “golden ratio” to predict certain levels of support (price movement reverses from downward to upward) and resistance (price movement reverses from upward to downward) which is a mathematical pattern seen through out nature and even the universe. Because so many traders make use of this trading strategy and watch these price levels, more often than not the Fibonacci levels become
Le Capteur de Tendance : La Stratégie du Capteur de Tendance avec Indicateur d'Alerte est un outil d'analyse technique polyvalent qui aide les traders à identifier les tendances du marché et les points d'entrée et de sortie potentiels. Elle présente une stratégie dynamique de Capteur de Tendance, s'adaptant aux conditions du marché pour une représentation visuelle claire de la direction de la tendance. Les traders peuvent personnaliser les paramètres selon leurs préférences et leur tolérance
FREE
TLM Map AM
Andriy Matviyevs'kyy
TLM Map AM (Trend Line Momentum Map) is an indicator developed based on a set of digital technical analysis indicators described in the article by Vladimir Kravchuk: " Digital indicators in the technical analysis of financial markets ". The indicator displays in a separate window a complex of digital technical analysis indicators such as FTLM and STLM. Recommended for use in conjunction with the RTL Map AM (Reference Trend Line Map) indicator. The indicator has no customizable parameters.
L'indicateur construit les cotations actuelles, qui peuvent être comparées aux cotations historiques et, sur cette base, faire une prévision de l'évolution des prix. L'indicateur dispose d'un champ de texte pour une navigation rapide jusqu'à la date souhaitée. Option : Symbole - sélection du symbole que l'indicateur affichera ; SymbolPeriod - sélection de la période à partir de laquelle l'indicateur prendra des données ; IndicatorColor - couleur de l'indicateur ; HorisontalShift -
ZigZag Professional
Dmitriy Kashevich
5 (1)
the zigzag indicator draws lines on the chart from the highest point to the lowest There are built-in fibonacci levels built-in sound alert the indicator highlights trends on small timeframes with a thin line and trends highlights with a coarse line Fibonacci levels can be turned on and off in the settings settings are very simple and clear the same sound alert can be turned on and off, you can change the colors of the lines.
The main idea of this indicator is rates analysis and prediction by Fourier transform. Indicator decomposes exchange rates into main harmonics and calculates their product in future. You may use the indicator as a standalone product, but for better prediction accuracy there is another related indicator - FreqoMaster - which uses FreqoMeterForecast as a backend engine and combines several instances of FreqoMeterForecast for different frequency bands. Parameters: iPeriod - number of bars in the ma
Trend Ray
Andriy Sydoruk
The indicator shows the potential trend direction by cyclical-wave dependence. Thus, all the rays of the intersection will be optimal rays, in the direction of which the price is expected to move, taking into account the indicator period. Rays can be used as a direction for potential market movement. But we must not forget that the approach must be comprehensive, the indicator signals require additional information to enter the market.
VR Grid
Vladimir Pastushak
4.57 (7)
L'indicateur VR Grid est conçu pour créer une grille graphique avec des paramètres définis par l'utilisateur. Contrairement à la grille standard , VR Grid est utilisée pour créer des niveaux circulaires . Selon le choix de l'utilisateur, le pas entre les niveaux ronds peut être arbitraire. De plus, contrairement à d'autres indicateurs et utilitaires, VR Grid maintient la position de la grille même lorsque la période de temps change ou que le terminal est redémarré. Les paramètres, les fichiers d
FREE
Trend PA
Mikhail Nazarenko
5 (3)
The Trend PA indicator uses   Price Action   and its own filtering algorithm to determine the trend. This approach helps to accurately determine entry points and the current trend on any timeframe. The indicator uses its own algorithm for analyzing price changes and Price Action. Which gives you the advantage of recognizing, without delay, a new nascent trend with fewer false positives. Trend filtering conditions can be selected in the settings individually for your trading style. The indicator
Awesome Oscillator by Bill Williams with the ability to fine-tune and replace the averaging algorithms of the indicator, which significantly expands the possibilities of using this oscillator in algorithmic trading and brings it closer in its properties to such an indicator as the MACD. To reduce price noise, the final indicator is processed with an additional Smooth averaging. The indicator has the ability to give alerts, send mail messages and push signals when the direction of movement of th
The indicator detects and displays 3 Drives harmonic pattern (see the screenshot). The pattern is plotted by the extreme values of the ZigZag indicator (included in the resources, no need to install). After detecting the pattern, the indicator notifies of that by a pop-up window, a mobile notification and an email. The indicator highlights the process of the pattern formation and not just the complete pattern. In the former case, it is displayed in the contour triangles. After the pattern is com
Indicateur de scalping Forex qui ne redessine pas ses flèches. Cela fonctionne mieux sur les périodes M5, M15, M30, H1. Les paramètres par défaut sont pour la période M5. L'image ci-dessous montre un exemple de travail sur le graphique H1 avec la valeur du paramètre "period=0.35". Vous pouvez télécharger la version de démonstration et la tester vous-même. Maintenant, nous utilisons les signaux de cet indicateur dans presque toutes nos stratégies de scalping. D'après nos calculs, la précision de
Professional forex expert   Black Angel   (for EURUSD, GBPUSD pairs) alyzing the market using the Elliot Wave Index. Elliott wave theory is the interpretation of processes in financial markets through a system of visual models (waves) on price charts. The author of the theory, Ralph Elliott, identified eight variants of alternating waves (of which five are in the trend and three are against the trend). The movement of prices in the markets takes the form of five waves. Three of them (1, 3, 5)
Trendiness Index
Libertas LLC
5 (3)
"The trend is your friend" is one of the best known sayings in investing, because capturing large trendy price movements can be extremely profitable. However, trading with the trend is often easier said than done, because many indicators are based on price reversals not trends. These aren't very effective at identifying trendy periods, or predicting whether trends will continue. We developed the Trendiness Index to help address this problem by indicating the strength and direction of price trend
GJ Options
Sayan Vandenhout
GJ OPTIONS USES THE TREND WAVE INDICATOR AND IT CAN IDENTIFY THE BEGINNING AND THE END OF A NEW WAVE TREND MOVEMENT. AS AN OSCILLATOR, THE INDICATOR IDENTIFIES THE OVERBOUGHT AND OVERSOLD ZONES. IT WORKS GREAT TO CATCH THE SHORT TERM PRICE REVERSALS AND USES A MARTINGALE STRATEGY TO CLOSE ALL TRADES IN PROFIT. USE DEFAULT SETTINGS ON H1 OR HIGHER TIME FRAME ON ANY PAIR FOR MORE ACCURATE TRADES WHY THIS EA : Smart entries calculated by 5 great strategies The EA can be run on even a $20000 account
Smoking
Nadiya Mirosh
I suggest that everyone who is interested in the Smoking indicator try to trade. Smoking is a technical analysis tool that uses mathematical calculations to determine various aspects of price movement and is based on historical data. Smoking reveals special aspects of price movement and allows traders to make the right decision. All trading indicators analyze the price from different angles based on historical data. Therefore, it is not entirely correct to say that they can predict the future
PullbackMatrix provides the key information of the trading transactions when it finds the right market moment based on its built-in logic algorithm. The high accuracy signals including Trading Symbol, Entry Price, Entry Time, TakeProfit, Stoploss, and more. And that's all will be available instantly in your chart panel, drawing the position lines and also sending signal notification to email, mobile phone, and screen popup. More important is that also saves signals into a .csv file which is usef
The indicator for determining key patterns for the BBMA strategy will perfectly complement the Fibo Musang strategy, and can also be used as an independent tool. IMPORTANT! Contact me immediately after purchase to receive the second file! If you have any questions, I will help you deal with the indicator. Designed to save market analysis time; Sends push notifications to the phone when key moments of the strategy have arisen (Extrem A, Csak, cross the BB line with a candle) Advantages Easy to u
Mr Beast Cobertura
Luis Mariano Vazquez Marcos
Mr Beast Super Hedge Asesor experto diseñado para trabajar encerrando el precio entre 2 valores hasta que rompa en una dirección tanto de compra como de venta. Este robot de trading de Forex ha sido desarrollado por MRBEAST como una herramienta para facilitar el trading intradía. Tenga en cuenta que el uso de este robot implica ciertos riesgos y no garantiza ganancias consistentes en el mercado de divisas. El robot de trading se basa en algoritmos y estrategias que he diseñado, los cuales se han
TBP All in One
Dmitry Fedoseev
5 (2)
All patterns from Encyclopedia of Chart Patterns by Thomas N. Bulkowski in one indicator. It draws an up or down arrow whenever a pattern is identified. Patterns are selected in the drop-down list of the Pattern variable (located at the beginning of the properties window). The indicator has numerous external parameters, some of them apply to all patterns, while others are selective. To see more information on the parameters used for the selected pattern, enable the ShowHelp variable (located at
Anubis Skunk
Sayan Vandenhout
Anubis Skunk USES THE TREND WAVE INDICATOR AND IT CAN IDENTIFY THE BEGINNING AND THE END OF A NEW WAVE TREND MOVEMENT. AS AN OSCILLATOR, THE INDICATOR IDENTIFIES THE OVERBOUGHT AND OVERSOLD ZONES. IT WORKS GREAT TO CATCH THE SHORT TERM PRICE REVERSALS AND USES A MARTINGALE STRATEGY TO CLOSE ALL TRADES IN PROFIT. USE DEFAULT SETTINGS ON H1 OR HIGHER TIME FRAME ON ANY PAIR FOR MORE ACCURATE TRADES WHY THIS EA : Smart entries calculated by 5 great strategies The EA can be run on even a $
Vanglutio
Sayan Vandenhout
VANGLUTIO USES THE TREND WAVE INDICATOR AND IT CAN IDENTIFY THE BEGINNING AND THE END OF A NEW WAVE TREND MOVEMENT. AS AN OSCILLATOR, THE INDICATOR IDENTIFIES THE OVERBOUGHT AND OVERSOLD ZONES. IT WORKS GREAT TO CATCH THE SHORT TERM PRICE REVERSALS AND USES A MARTINGALE STRATEGY TO CLOSE ALL TRADES IN PROFIT. USE DEFAULT SETTINGS ON H1 OR HIGHER TIME FRAME ON ANY PAIR FOR MORE ACCURATE TRADES WHY THIS EA : Smart entries calculated by 5 great strategies The EA can be run on even a $200
MACD Divergence
Sergey Deev
2.5 (2)
The indicator detects divergence signals - the divergences between the price peaks and the MACD oscillator values. The signals are displayed as arrows in the additional window and are maintained by the messages in a pop-up window, e-mails and push-notifications. The conditions which formed the signal are displayed by lines on the chart and in the indicator window. Indicator Parameters MacdFast - fast MACD line period MacdSlow - slow MACD line period MacdSignal - MACD signal line period MacdPri
Chart Patterns Detect 15 patterns (Ascending Triangle, Descending Triangle, Rising Wedge, Falling Wedge, Bullish Flag, Bearish Flag, Bullish Rectangle, Bearish Rectangle Symmetrical triangle, Head and Shoulders, Inverted Head and Shoulders, Triple top, Triple Bottom, Double Top, Double Bottom) Use historical data to calculate the probability of each pattern to succeed (possibility to filter notification according to the chance of success) gives graphic indication about the invalidation level and
Les acheteurs de ce produit ont également acheté
Gann Made Easy
Oleg Rodin
4.93 (73)
Gann Made Easy est un système de trading Forex professionnel et facile à utiliser qui est basé sur les meilleurs principes de trading en utilisant la théorie de mr. WD Gann. L'indicateur fournit des signaux d'ACHAT et de VENTE précis, y compris les niveaux Stop Loss et Take Profit. Vous pouvez échanger même en déplacement en utilisant les notifications PUSH. S'il vous plaît contactez-moi après l'achat! Je partagerai avec vous mes astuces de trading et d'excellents indicateurs bonus gratuitement!
Trend Punch
Mohamed Hassan
5 (9)
Manual guide:   Click here PROMO of  $79 for 2 copies left!  -- Next price is  $149 .  This indicator is unstoppable when combined with our other indicator called  Support & Resistance . After purchase, send us a message and you will get it   for  FREE as a BONUS! I like to use Trend Punch on XAUUSD & BTCUSD on the M1 timeframe!  Introducing Trend Punch , the revolutionary forex trend indicator that will transform the way you trade! Trend Punch is uniquely designed to provide preci
Atomic Analyst
Issam Kassas
5 (3)
Tout d'abord, il convient de souligner que cet indicateur de trading n'est ni repainting, ni redrawing et ne présente aucun délai, ce qui le rend idéal à la fois pour le trading manuel et automatisé. Manuel de l'utilisateur : réglages, entrées et stratégie. L'Analyste Atomique est un indicateur d'action sur les prix PA qui utilise la force et le momentum du prix pour trouver un meilleur avantage sur le marché. Équipé de filtres avancés qui aident à éliminer les bruits et les faux signaux, et à
Scalper Inside PRO
Alexey Minkov
4.74 (58)
An exclusive indicator that utilizes an innovative algorithm to swiftly and accurately determine the market trend. The indicator automatically calculates opening, closing, and profit levels, providing detailed trading statistics. With these features, you can choose the most appropriate trading instrument for the current market conditions. Additionally, you can easily integrate your own arrow indicators into Scalper Inside Pro to quickly evaluate their statistics and profitability. Scalper Inside
ACTUELLEMENT 26% DE RÉDUCTION La meilleure solution pour tout débutant ou trader expert ! Cet indicateur est un outil de trading unique, de haute qualité et abordable car nous avons incorporé un certain nombre de caractéristiques exclusives et une nouvelle formule. Avec seulement UN graphique, vous pouvez lire la force de la devise pour 28 paires Forex ! Imaginez comment votre trading va s'améliorer parce que vous êtes capable de repérer le point de déclenchement exact d'une nouvelle tendan
Actuellement 20% de réduction ! La meilleure solution pour tout débutant ou trader expert ! Ce logiciel de tableau de bord fonctionne sur 28 paires de devises. Il est basé sur 2 de nos principaux indicateurs (Advanced Currency Strength 28 et Advanced Currency Impulse). Il donne un excellent aperçu de l'ensemble du marché Forex. Il montre les valeurs de l'Advanced Currency Strength, la vitesse de mouvement des devises et les signaux pour 28 paires de devises dans tous les (9) délais. Imagine
Advanced Supply Demand
Bernhard Schweigert
4.92 (312)
CURRENTLY 26% OFF !! Best Solution for any Newbie or Expert Trader! This indicator is a unique, high quality and affordable trading tool because we have incorporated a number of proprietary features and a new formula. With this update, you will be able to show double timeframe zones. You will not only be able to show a higher TF but to show both, the chart TF, PLUS the higher TF: SHOWING NESTED ZONES. All Supply Demand traders will love it. :) Important Information Revealed Maximize the potenti
Tout d'abord, il convient de souligner que cet outil de trading est un indicateur non repeint, non redessiné et non retardé, ce qui le rend idéal pour le trading professionnel. Cours en ligne, manuel utilisateur et démonstration. L'indicateur Smart Price Action Concepts est un outil très puissant à la fois pour les nouveaux et les traders expérimentés. Il regroupe plus de 20 indicateurs utiles en un seul, combinant des idées de trading avancées telles que l'analyse du trader Inner Circle et les
TPSpro RFI Levels
Roman Podpora
4.83 (18)
Reversal First Impulse levels (RFI)    INSTRUCTIONS        RUS       -       ENG              R ecommended to use with an indicator   -   TREND PRO -  Version MT5 A key element in trading is zones or levels from which decisions to buy or sell a trading instrument are made. Despite attempts by major players to conceal their presence in the market, they inevitably leave traces. Our task was to learn how to identify these traces and interpret them correctly. Main functions: Displaying active zones
Auto Order Block with break of structure based on ICT and Smart Money Concepts (SMC) Futures Break of Structure ( BoS )             Order block ( OB )            Higher time frame Order block / Point of Interest ( POI )    shown on current chart           Fair value Gap ( FVG ) / Imbalance   -  MTF      ( Multi Time Frame )    HH/LL/HL/LH  -  MTF      ( Multi Time Frame )  Choch  MTF      ( Multi Time Frame )  Volume Imbalance     ,  MTF          vIMB Gap’s Power of 3 Equal High
TPSproTREND PrO
Roman Podpora
4.78 (18)
TPSpro TRENDPRO  - is a trend indicator that automatically analyzes the market and provides information about the trend and each of its changes, as well as giving signals for entering trades without redrawing! The indicator uses each candle, analyzing them separately. referring to different impulses - up or down impulse. Exact entry points into transactions for currencies, crypto, metals, stocks, indices!  -  Version MT5               DETAILED DESCRIPTION                R ecommended to use with
Découvrez le secret pour réussir le trading Forex avec notre indicateur MT4 personnalisé! Vous êtes-vous déjà demandé comment réussir sur le marché du Forex, gagnant régulièrement des bénéfices tout en minimisant les risques? Voici la réponse que vous avez recherchée! Permettez-nous d'introduire notre indicateur MT4 propriétaire qui révolutionnera votre approche du trading. Polyvalence unique Notre indicateur est spécialement conçu pour les utilisateurs qui préfèrent les formations de bou
Legacy of Gann
Pavel Zamoshnikov
4.83 (12)
The indicator very accurately determines the levels of the possible end of the trend and profit fixing. The method of determining levels is based on the ideas of W.D.Gann, using an algorithm developed by his follower Kirill Borovsky. Extremely high reliability of reaching levels (according to K. Borovsky  - 80-90%) Indispensable for any trading strategy – every trader needs to determine the exit point from the market! Precisely determines targets on any timeframes and any instruments (forex, met
Currency Strength Wizard est un indicateur très puissant qui vous offre une solution tout-en-un pour un trading réussi. L'indicateur calcule la puissance de telle ou telle paire de devises en utilisant les données de toutes les devises sur plusieurs périodes. Ces données sont représentées sous la forme d'un indice de devise facile à utiliser et de lignes électriques de devise que vous pouvez utiliser pour voir la puissance de telle ou telle devise. Tout ce dont vous avez besoin est d'attacher l'
ICT, SMC, SMART MONEY CONCEPTS, SMART MONEY, Smart Money Concept, Support and Resistance, Trend Analysis, Price Action, Market Structure, Order Blocks, BOS/CHoCH,   Breaker Blocks ,  Momentum Shift,   Supply&Demand Zone/Order Blocks , Strong Imbalance, HH/LL/HL/LH,    Fair Value Gap, FVG,  Premium  &   Discount   Zones, Fibonacci Retracement, OTE, Buy Side Liquidity, Sell Side Liquidity, BSL/SSL Taken, Equal Highs & Lows, MTF Dashboard, Multiple Time Frame, BigBar, HTF OB, HTF Market Structure, 
M1 Arrow
Oleg Rodin
5 (14)
Une stratégie intraday basée sur deux principes fondamentaux du marché. L'algorithme est basé sur l'analyse des volumes et des vagues de prix à l'aide de filtres supplémentaires. L'algorithme intelligent de l'indicateur ne donne un signal que lorsque deux facteurs de marché se combinent en un seul. L'indicateur calcule les vagues d'une certaine plage sur le graphique M1 en utilisant les données de la période la plus élevée. Et pour confirmer la vague, l'indicateur utilise une analyse en volume.
BullsEye Signal NoRepaint
Martin Alejandro Bamonte
BullseyeSignal – NoRepaint est un signal qui, comme son nom l'indique, ne se repeint jamais en aucune circonstance. Le signal est émis sur la même bougie observée dans l'image. Il est idéal pour les marchés hautement volatils tels que le forex, les cryptomonnaies, les actions, les indices et les futures. Vous ne verrez qu'une flèche verte pour l'achat et une flèche rouge pour la vente, mais il y a de nombreux indicateurs qui travaillent ensemble en arrière-plan pour fournir une expérience de tra
FX Power MT4 NG
Daniel Stein
5 (10)
Obtenez votre mise à jour quotidienne du marché avec des détails et des captures d'écran via notre Morning Briefing ici sur mql5 et sur Telegram ! FX Power MT4 NG est la nouvelle génération de notre très populaire indicateur de force des devises, FX Power. Et qu'est-ce que ce compteur de force de nouvelle génération offre ? Tout ce que vous avez aimé de l'original FX Power PLUS Analyse de la force de l'OR/XAU Des résultats de calcul encore plus précis Périodes d'analyse configurables individuel
TakePropips Donchian Trend Pro
Eric John Pajarillaga Aldana
4.82 (17)
TakePropips Donchian Trend Pro   (MT4) est un outil puissant et efficace qui détecte automatiquement la direction de la tendance à l'aide du canal Donchian et vous fournit des signaux de trading d'entrée et de sortie ! Cet indicateur multifonction comprend un scanner de tendance, des signaux de trading, un panneau statistique, un filtre, des sessions de trading et un tableau de bord de l'historique des alertes. Il est conçu pour vous fournir des signaux de trading et vous faire gagner des heures
FX Volume
Daniel Stein
4.6 (35)
Obtenez votre mise à jour quotidienne du marché avec des détails et des captures d'écran via notre Morning Briefing ici sur mql5 et sur Telegram ! FX Volume est le PREMIER et SEUL indicateur de volume qui fournit un VRAI aperçu du sentiment du marché du point de vue d'un courtier. Il fournit des informations impressionnantes sur la façon dont les acteurs institutionnels du marché, comme les courtiers, sont positionnés sur le marché des changes, bien plus rapidement que les rapports COT. Voir c
ACTUELLEMENT 31% DE RÉDUCTION ! ! La meilleure solution pour tout débutant ou Expert Trader ! Cet indicateur est un outil de trading unique, de haute qualité et abordable car nous avons incorporé un certain nombre de caractéristiques exclusives et une formule secrète. Avec seulement UN graphique, il donne des alertes pour les 28 paires de devises. Imaginez comment votre trading s'améliorera parce que vous serez capable de repérer le point de déclenchement exact d'une nouvelle tendance ou d'
Volatility Trend System - un système de trading qui donne des signaux pour les entrées. Le système de volatilité donne des signaux linéaires et ponctuels dans le sens de la tendance, ainsi que des signaux pour en sortir, sans redessiner ni retarder. L'indicateur de tendance surveille la direction de la tendance à moyen terme, montre la direction et son changement. L'indicateur de signal est basé sur les changements de volatilité et montre les entrées sur le marché. L'indicateur est équipé de
Break and Retest
Mohamed Hassan
4.43 (14)
New update to V.4 where  Break & Retest automatically draws the take profit & stop loss levels and you also have more signals per day! ‍You can visually backtest Break & Retest to see how it behaved in the past!     Manual guide:   Click here $60 for a very limited time. Next price is $120   This Indicator only places quality trades when the market is really in your favor with a clear break and retest. Patience is key with this price action strategy! If you want more alert s
TrendDecoder Premium
Christophe Pa Trouillas
5 (5)
Identifiez les ranges et les prochaines tendances fortes   |  Obtenez les premiers signaux et la force des tendances   |  Obtenez des TP clairs et RR favorable   |  Repérer les niveaux Fibo que le prix va tester Indicateur qui ne retrace pas, non retardé - idéal pour le trading manuel et automatisé - adapté à tous les actifs et à toutes les unités de temps Pour une durée limitée >>   -50% de réduction Après votre achat,   contactez-moi sur ce canal  pour obtenir les réglages recommandés. Version
TrendMaestro
Stefano Frisetti
5 (3)
note: this indicator is for METATRADER4, if you want the version for METATRADER5 this is the link:  https://www.mql5.com/it/market/product/108106 TRENDMAESTRO ver 2.4 TRENDMAESTRO recognizes a new TREND in the bud, he never makes mistakes. The certainty of identifying a new TREND is priceless. DESCRIPTION TRENDMAESTRO identifies a new TREND in the bud, this indicator examines the volatility, volumes and momentum to identify the moment in which there is an explosion of one or more of these data a
Ce tableau de bord affiche les derniers modèles harmoniques disponibles pour les symboles sélectionnés, ce qui vous permettra de gagner du temps et d'être plus efficace / version MT5 . Indicateur gratuit: Basic Harmonic Pattern Colonnes de l'indicateur Symbol : les symboles sélectionnés apparaissent Trend : haussière ou baissière Pattern : type de motif (gartley, papillon, chauve-souris, crabe, requin, cypher ou ABCD) Entry: prix d'entrée SL: prix du stop loss TP1: 1er prix de prise de pr
Scalper Vault
Oleg Rodin
5 (29)
Scalper Vault est un système de scalpage professionnel qui vous fournit tout ce dont vous avez besoin pour un scalpage réussi. Cet indicateur est un système de trading complet qui peut être utilisé par les traders de forex et d'options binaires. Le délai recommandé est M5. Le système vous fournit des signaux fléchés précis dans le sens de la tendance. Il vous fournit également des signaux supérieurs et inférieurs et des niveaux de marché Gann. Les indicateurs fournissent tous les types d'alertes
Italo Levels Indicator
Italo Santana Gomes
5 (8)
BUY INDICATOR AND GET EA FOR FREE AS A BONUS + SOME OTHER GIFTS! ITALO LEVELS INDICATOR  is the best levels indicator ever created, and why is that? Using high volume zones on the market and Fibonacci the Indicator works on all time-frames and assets, indicator built after 7 years of experience on forex and many other markets. You know many levels indicators around the internet are not complete, does not help, and it's difficult to trade, but the   Italo Levels Indicator is different , the Ital
AW Trend Predictor
AW Trading Software Limited
4.74 (39)
La combinaison des niveaux de tendance et de panne dans un seul système. Un algorithme d'indicateur avancé filtre le bruit du marché, détermine la tendance, les points d'entrée, ainsi que les niveaux de sortie possibles. Les signaux indicateurs sont enregistrés dans un module statistique, qui vous permet de sélectionner les outils les plus appropriés, montrant l'efficacité de l'historique des signaux. L'indicateur calcule les marques Take Profit et Stop Loss. Manuel et instruction ->   Ici   /
RelicusRoad Pro
Relicus LLC
4.76 (139)
Maintenant 147 $ (augmentant à 499 $ après quelques mises à jour) - Comptes illimités (PCS ou Mac) Manuel d'utilisation RelicusRoad + Vidéos de formation + Accès au groupe Discord privé + Statut VIP UNE NOUVELLE FAÇON DE REGARDER LE MARCHÉ RelicusRoad est l'indicateur de trading le plus puissant au monde pour le forex, les contrats à terme, les crypto-monnaies, les actions et les indices, offrant aux traders toutes les informations et tous les outils dont ils ont besoin pour rester renta
Plus de l'auteur
The Trap Play MT4
Carl Gustav Johan Ekstrom
5 (3)
Trap Play  refers to a market situation where price initially makes a new high or low, luring traders into believing a strong trend is forming. However, the price quickly reverses and invalidates the breakout, trapping those traders who entered positions based on the initial move. This sudden reversal often results in a rapid exit of positions, leading to significant price movement in the opposite direction.  Trap plays  can occur in various financial markets and timeframes and are characterized
Breakout Lines MT4
Carl Gustav Johan Ekstrom
The   Breakout Line   in technical analysis serves as a crucial tool for understanding market dynamics and potential shifts in price direction. It's designed to highlight rapid accelerations or declines in the market's trajectory. Unconventional Analysis : The Breakout Line is not your typical technical indicator; it's tailored to capture swift market movements, offering a unique perspective on price trends. Angle of the Breakout Line : The sharper the angle formed by the Breakout Line, the stro
Breakout Lines MT5
Carl Gustav Johan Ekstrom
5 (1)
The Breakout Line in technical analysis serves as a crucial tool for understanding market dynamics and potential shifts in price direction. It's designed to highlight rapid accelerations or declines in the market's trajectory. Unconventional Analysis : The Breakout Line is not your typical technical indicator; it's tailored to capture swift market movements, offering a unique perspective on price trends. Angle of the Breakout Line : The sharper the angle formed by the Breakout Line, the stronger
The Trap Play MT5
Carl Gustav Johan Ekstrom
5 (1)
Trap Play  refers to a market situation where price initially makes a new high or low, luring traders into believing a strong trend is forming. However, the price quickly reverses and invalidates the breakout, trapping those traders who entered positions based on the initial move. This sudden reversal often results in a rapid exit of positions, leading to significant price movement in the opposite direction.  Trap plays  can occur in various financial markets and timeframes and are characterized
Trading Cycle Array MT4
Carl Gustav Johan Ekstrom
I'm excited to introduce you to the fifth bar on   Martin Armstrong's  Forecast Array - The Trading Cycle . This innovative tool represents a transverse form of cyclical frequency analysis, offering a unique perspective on market trends. The model employs a color-coded system for easy interpretation. In this model, green signals the ideal timing for highs, red indicates ideal lows, and yellow signifies a convergence of highs and lows occurring simultaneously. This intuitive approach allows
Trading Cycle Array MT5
Carl Gustav Johan Ekstrom
5 (1)
I'm excited to introduce you to the fifth bar on   Martin Armstrong's  Forecast Array - The Trading Cycle . This innovative tool represents a transverse form of cyclical frequency analysis, offering a unique perspective on market trends. The model employs a color-coded system for easy interpretation. In this model, green signals the ideal timing for highs, red indicates ideal lows, and yellow signifies a convergence of highs and lows occurring simultaneously. This intuitive approach allows
The 5 Trend Lines Rule
Carl Gustav Johan Ekstrom
5 (1)
After analyzing a numerous significant bear and bull markets, a peculiar principle has surfaced, dubbed the  5 Trend Lines Rule . It suggests that within a major bear or bull market, there are typically five false breakouts before the sixth breakout proves significant. Parameters Trend Line #1 Color:  Magenta Trend Line #2 Color:  Magenta Trend Line #3 Color:  Magenta Trend Line #4 Color:  Magenta Trend Line #5 Color:  Magenta #1 Color:  Yellow #2 Color:  Yellow #3 Color:  Yellow #4 Color: Ye
Martin Armstrong Cycles
Carl Gustav Johan Ekstrom
5 (2)
Martin Armstrong Cycles employs an unconventional form of technical analysis on your charts aimed at capturing market angles, swift market movements, price reversals, and early trend shifts. I strongly advise all traders to integrate cyclical analysis into their charting methods, as it unveils the inherent rhythms of markets. Every element in the universe follows a cycle, and so does price! Analytical Benefits of Cyclical Analysis The angle of the cycle provides a roadmap for anticipating fu
Filtrer:
Robert
629
Robert 2023.05.13 13:07 
 

L'utilisateur n'a laissé aucun commentaire sur la note

Carl Gustav Johan Ekstrom
4263
Réponse du développeur Carl Gustav Johan Ekstrom 2023.05.13 13:15
Thank you! :)
faithdefender
1726
faithdefender 2022.07.26 23:47 
 

I think if you are going to sell an indicator for a certain strategy after a person, you should be able to help guide the customer through the concept. Not just sending a twelve page document filled with YOUR indicators with limited pages dealing with the Midas indicator. While in the Telegram group, I asked for help with identifying placement of the indicator. It was a sincere question. Answer? "Isolated highs and lows are the best place to anchor MIDAS." He also said he would show how in the following text. But, he removed that text and has never responded. If things work out, I will update my review. But this speaks volumes when someone offers minimum help on an expensive indicator. UPDATE 8-23-22. Still not able to find the "isolated highs" where i was instructed toplace the indicator. Never heard back from the Vendor. I think the indicator could be be a tool if it had training where to place the points, but as I said, I have tried to take the indicator and place it at multiple spots where it may come and touch, but it does not. It is a bummer I didnt read the review by Hadi below that says "A supporting group with promising indicators. The author is more than welcome for us to learn more and the theory." What does that tell the customer when someone writes 'with promising indicators....'? Promising what? Did he even try the indicator? 10-6-22 I am upgrading my review to 4 stars. While I am still trying to figure it out, it has always been my conviction that quality AND price should be considered when writing a review. In fairness to the Vendor, this indicator is affordable and for that reason this should mitigate the review. I am still lost using it, but I do think someone with knowllege of VWAP may benefit. For this reason I want to remain positive. Update. 10-28-22 The indicator does not consistently work. When you apply it to the chart the vertical line is visible, but wherever you post it, the three lines will not display. I have sent a note to the Vendor. I have had to reduce the rating unless it is repaired. UPDATE 5-12-23 As you can see the Vendor has made some instructive and beneficial changes and I want to update the rating to four stars. He has designed it for people learning to use MIDAS and this most certainly helps me. I will continue to evaluate, but for now I have no problem with a recommendation. Thank you

Carl Gustav Johan Ekstrom
4263
Réponse du développeur Carl Gustav Johan Ekstrom 2023.05.11 10:25
Thank you for your extensive review. I have sent you a PM to try resolve the issue. Update: Please download the latest version (4.60) to find recommended anchor points :)
Epsilon Hogas
1497
Epsilon Hogas 2022.06.16 05:22 
 

Its a good indicator for identifying pullback buy position, thank you

Carl Gustav Johan Ekstrom
4263
Réponse du développeur Carl Gustav Johan Ekstrom 2023.03.10 13:24
Thank you
cattledog
255
cattledog 2022.05.18 11:01 
 

indicator not working and no way to reach seller.

Carl Gustav Johan Ekstrom
4263
Réponse du développeur Carl Gustav Johan Ekstrom 2022.07.09 16:50
You rented the indicator and immediately left a bad review. You haven't tried to contact me in any way.
Dapo01
366
Dapo01 2022.05.11 21:12 
 

Very effective Indicator for predicting price reversal. It is quite precise. Very supportive telegram group. Great trade with precise entry today. Highly recommended.

Carl Gustav Johan Ekstrom
4263
Réponse du développeur Carl Gustav Johan Ekstrom 2023.03.10 13:24
Thank you
Irfan
590
Irfan 2022.05.11 18:20 
 

It is really a very effective trading tool. Also great support and guidance from the author.

dkaramarko
237
dkaramarko 2022.05.11 11:40 
 

very useful and recommended and author is highly friendly and always prepared to help

Carl Gustav Johan Ekstrom
4263
Réponse du développeur Carl Gustav Johan Ekstrom 2023.03.10 13:24
Thanks
Vasileios Kapsis
180
Vasileios Kapsis 2022.05.05 20:47 
 

This is a first review concerning the MIDAS approach. As I gain experience I will keep adding more information. It looks like a very interesting tool. It requires some trading knowledge and you need to do your homework. It is not a black box that calls trades. It is a real trading tool. It is very easy to install and Carl-Gustav (the author) has a Telegram channel to assist members. Carl-Gustav is a professional trader and not some programmer that converted a trading system to an indicator. Overall the value for money is excellent and the support is outstanding.

Carl Gustav Johan Ekstrom
4263
Réponse du développeur Carl Gustav Johan Ekstrom 2023.03.10 13:24
Thank you :) :)
Sofwan Hadi
238
Sofwan Hadi 2022.04.26 09:06 
 

A supporting group with promising indicators. The author is more than welcome for us to learn more and the theory.

Carl Gustav Johan Ekstrom
4263
Réponse du développeur Carl Gustav Johan Ekstrom 2023.03.10 13:25
Thank you
Joao Flores Neto
2144
Joao Flores Neto 2018.01.16 17:51 
 

One of the best indicators, congrats, good job, guy.

Carl Gustav Johan Ekstrom
4263
Réponse du développeur Carl Gustav Johan Ekstrom 2023.03.10 13:25
Thanks
sateeqpal
23
sateeqpal 2017.10.26 19:04 
 

Ideal Indicator and Perfect Supportive Author.

I believe all types of traders will love it too much, since all of them are using the classic way along with their strategies.

If you like to have the indicator helps you for accurate entries, this one is ideal

it's really amazing for following the trends and wow for scalping.

My advice take it and try it, you will not regret (((along with that try to read the e-book if like to become a professional trader)))

Carl Gustav Johan Ekstrom
4263
Réponse du développeur Carl Gustav Johan Ekstrom 2023.03.10 13:25
Thank you
spacejockey
161
spacejockey 2017.10.13 13:05 
 

Great Indi

Carl Gustav Johan Ekstrom
4263
Réponse du développeur Carl Gustav Johan Ekstrom 2023.03.10 13:25
Thank you :)
jackhammer42
303
jackhammer42 2017.09.09 15:42 
 

Very good indicator and supportive developer!

Carl Gustav Johan Ekstrom
4263
Réponse du développeur Carl Gustav Johan Ekstrom 2023.03.10 13:25
Thank you :)
Bazi Siguqa
573
Bazi Siguqa 2017.08.24 00:38 
 

This is the first time where I am giving a good review because the product really works, other wise its always been about "the author asked me to give a good one". This is boss indicator I mean BOSS product!! I recommend u read the whole book by Andrew Coles and Hawkins

The best part is the support from developer!

Carl Gustav Johan Ekstrom
4263
Réponse du développeur Carl Gustav Johan Ekstrom 2023.03.10 13:25
Thank you very much :)
ZHE WEI
1240
ZHE WEI 2017.08.21 09:12 
 

L'utilisateur n'a laissé aucun commentaire sur la note

fellan
35
fellan 2017.08.08 12:50 
 

L'utilisateur n'a laissé aucun commentaire sur la note

Carl Gustav Johan Ekstrom
4263
Réponse du développeur Carl Gustav Johan Ekstrom 2023.03.10 13:26
Thank you
sbashir
266
sbashir 2016.08.18 00:07 
 

Simple effective and best. it requires some deep knowledge about swings, candle stick patterns. what i feel is if you learn it you will never be in the need of any other indicator. Above all the author is one of the nicest person i have ever encountered with on mql5. Great Job

Carl Gustav Johan Ekstrom
4263
Réponse du développeur Carl Gustav Johan Ekstrom 2023.03.10 13:26
Thank you
Répondre à l'avis
Version 4.70 2024.05.01
Enhancements to visual appearance.
Version 4.60 2023.05.11
Major Update!

+ Visual improvements
+ Top-Bottom Finder algorithm improved
+ Indicator response time improved
+ Recommended anchor points
+ Price labels
+ Alert system
+ Buy and Sell signals
+ MIDAS displacement curves (adjustable)

Version 4.50 2022.07.01
Minor Fixes.
Version 4.40 2022.06.17
Minor Fixes.
Version 4.30 2022.06.17
Major Upgrade include the following,

+ Buy/Sell Signals added.
+ On Chart Signal Button added.
+ Displacement Curves added.
+ Time Frame Memory added.
+ Pop-Up Alert added.
- Top-Bottom Finder Removed.

Version 4.20 2022.04.26
Minor Update

- It is now possible to adjust the T-B Finder Percent (%) Comment under "Percent Distance)
Version 4.10 2022.04.21
Minor Adjustment: Made T-B Finder "False" by default so that you can make it "True" when you spot an accelerated trend.

Version 4.0 2022.04.11
Version 4.00: Improved User Experience!

- I have temporarily removed the Shifted VWAP. It will be back when further improved.

- Chart ID have been added, now you can have several copies on the chart.

- Visual aspects have been improved and enlarged.
Version 3.99 2018.02.14
Version 3.99 - Back to Original MIDAS + Improvements (Paul Levine Indicator)

- Top/Bottom Finder (TB-F) have been added back on and users will be able to adjust to the correct volume or "fuel" necessary to fit the TBf Curve to point D directly on the chart. You no longer have to go back and forth in the settings.

- Shifted VWAP1 and VWAP2 have been added back on as well but with no adjustments as it is better for users to be able to fit and select high/lows of their interest, and not automatically.

- TD Relative Retracement have been removed, it is now available to download for free here: https://www.mql5.com/en/market/product/26640

Signals are discontinued until version 4.0 as major improvements are needed.
Version 3.95 2018.01.16
Version 3.95

Whats New?

- Buy and Sell Signals
- Break Signals


Version 3.90 2018.01.12
TD RRET + MIDAS v3.9 !

>>Read below before upgrading!<<

This version is merged with TD Relative Retracement (TD RRET) by Thomas DeMark.
This version mechanically determines the correct levels and anchor point, simply select high/low.


Important Notes:

1. I have decided to exclude the Top/Bottom Finder from this version until I can make point D be mechanically determined. I will also included a Top/Bottom Finder Price Projection in later versions.


2. I have decided to exclude the MDC from this version as well until I can make it mechanically determine the correct high/low to use, for better user experience and consistent analysis.
Version 3.50 2017.08.14
MIDAS Trading Tools Version 3.50 contains;

-Drag and Drop features for easy adjustment and better user experience

-MIDAS + High + Low Curves

-Two Displacement Curves

-Magic Number; You need to assign a unique number to each copy that is launched to any chart or profile in your MT4 Terminal.