ZigZag Global
- Indicateurs
- Igor Semyonov
- Version: 1.24
- Mise à jour: 31 mars 2020
- Activations: 5
Description
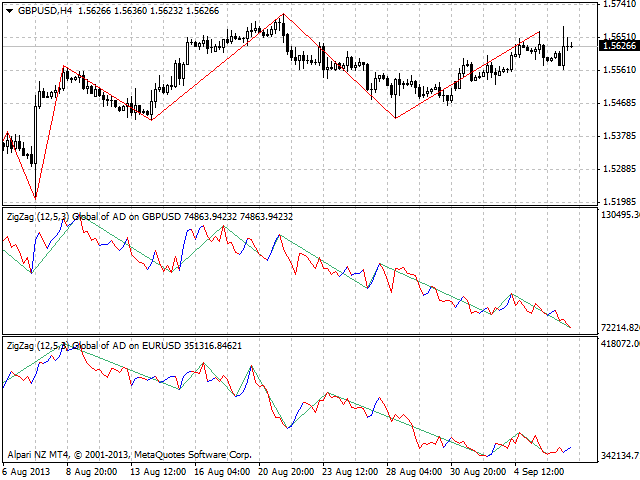
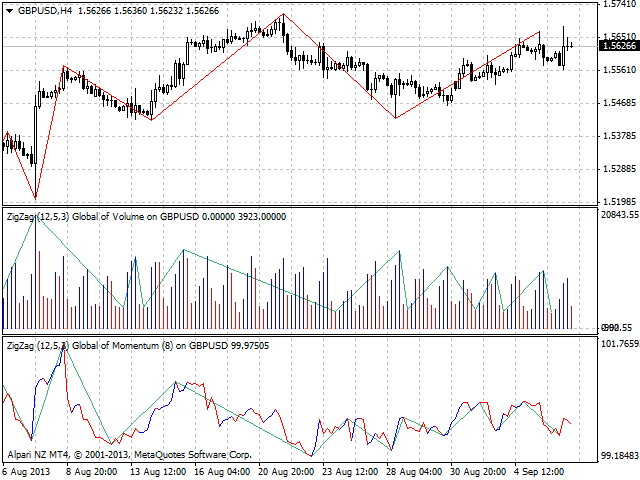
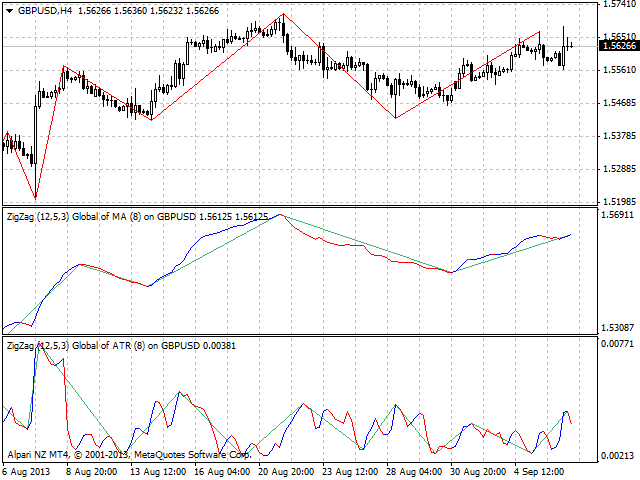
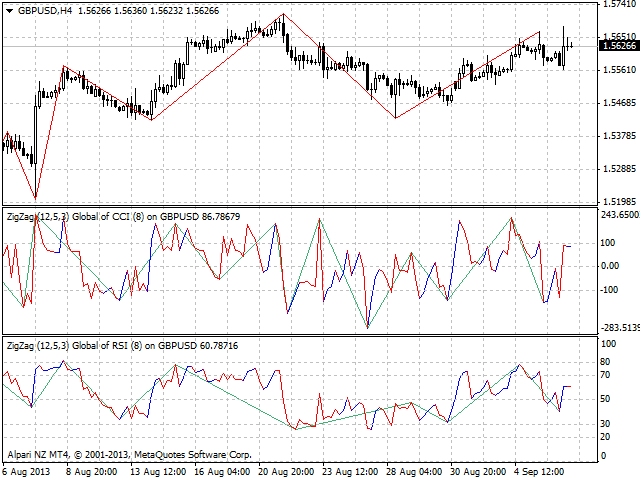
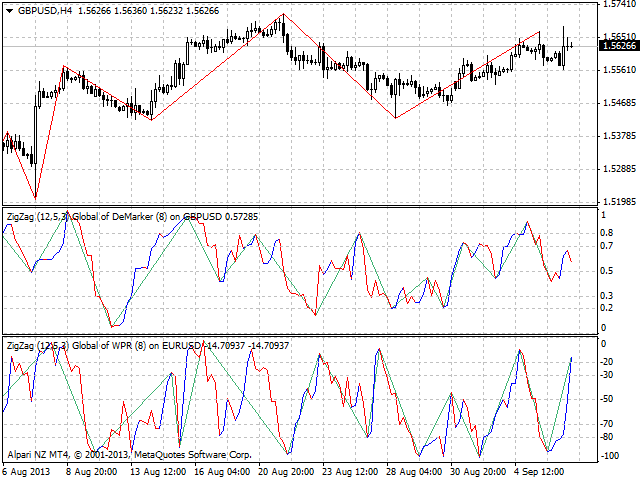
A colored universal multicurrency/multi-symbol indicator ZigZag to be drawn in a separate window below the main financial instrument.
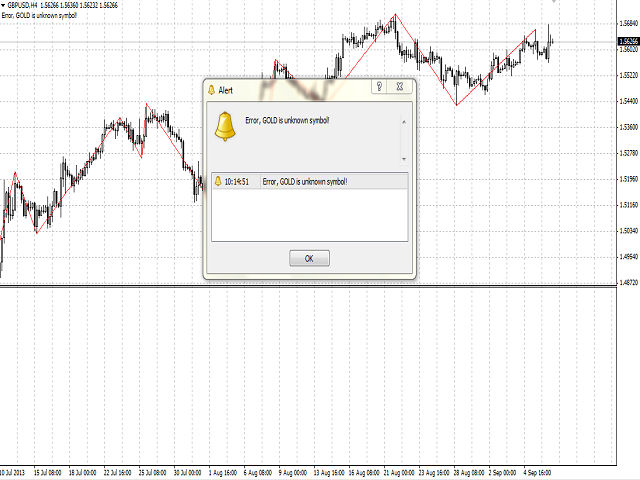
The indicator may be used with any broker, irrespective of the name of the financial instrument since it is necessary to manually enter the name as an input parameter. If you enter a non-existent or incorrect name of a financial instrument, you will receive an error message that this financial instrument is unknown (does not exist).
The indicator can be calculated based on one of the thirteen basic indicators included in the standard package of the MetaTrader 4 terminal:
- AD - an indicator of accumulation and distribution of volume.
- OBV - On Balance Volume.
- Volume - tick volume indicator.
- Force - Force Index indicator.
- MFI - Money Flow Index.
- ATR - Average True Range.
- Momentum.
- Moving Average.
- CCI - Commodity Channel Index.
- RSI - Relative Strength Index.
- ADX - Average Directional Movement indicator.
- DeMarker.
- Standard Deviation.
- WPR - Bill Williams oscillator.
The default indicator is AD - an indicator of accumulation and distribution of volume.
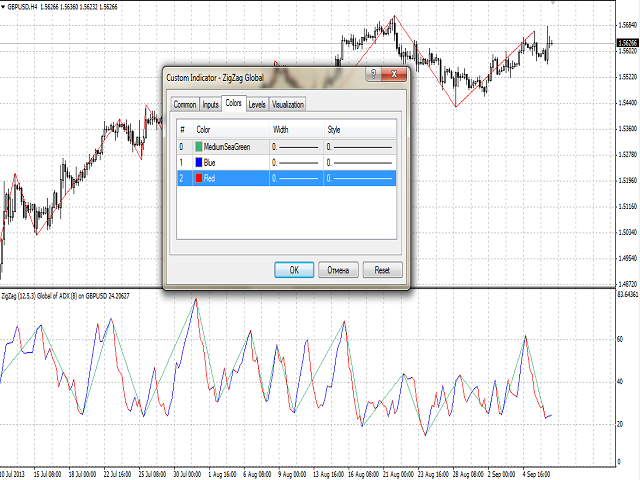
The ZigZag line and the rising and falling lines of the basic indicator can be colored.
Purpose
The indicator can be used for manual or automated trading in an Expert Advisor. Values of indicator buffer of the double type can be used for automated trading:
- The line of the ZigZag indicator - buffer 0.
- The bullish line of the basic indicator - buffer 1, must not be equal to zero.
- The bearish line of the basic indicator - buffer 2, must not be equal to zero.
- The main line of the basic indicator - buffer 3.
For a more in-depth analysis the indicator can be used in combination with the ZigZag indicator of the main chart.
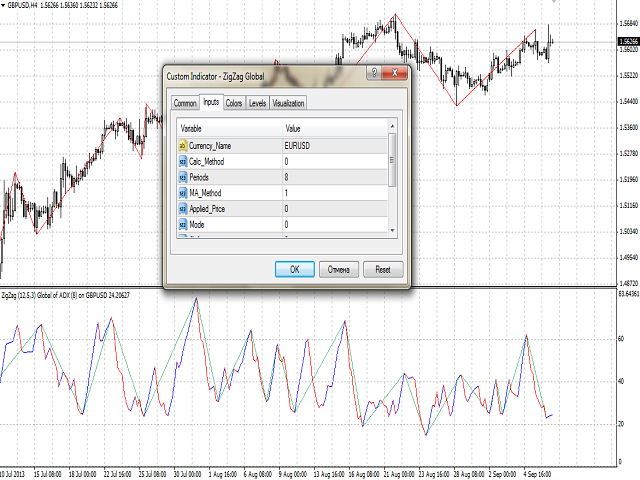
Inputs
- Currency_Name - the name of the financial instrument.
- Calc_Method - the index of the indicator, based on which the ZigZag indicator will be calculated (0 to 13). By default, i.e. more than 13 - based on the AD indicator.
- Periods - the period for calculating the basic indicator, based on which the ZigZag indicator will be calculated.
- MA_Method - averaging method for the MA of the basic indicator:
- MODE_SMA - 0.
- MODE_EMA - 1.
- MODE_SMMA - 2.
- MODE_LWMA - 3.
- Applied_Price - the used price of the basic indicator:
- PRICE_CLOSE - 0.
- PRICE_OPEN - 1.
- PRICE_HIGH - 2.
- PRICE_LOW - 3.
- PRICE_MEDIAN - 4.
- PRICE_TYPICAL - 5.
- PRICE_WEIGHTED - 6.
- Mode - the index of the line (MAIN - 0 or SIGNAL - 1) of the basic indicator, based on which ZigZag will be calculated.
- Shift - the sift of the basic and calculation indicator relative to the price chart.
- ExtDepth - the minimum bars, for which the second minimum or maximum will not be constructed, if the last one is ExtDeviation greater than or less than the previous one by.
- ExtDeviation - the minimum number of points as a percentage between the maximum and minimum of two neighboring bars to form a local maximum or minimum.
- ExtBackstep - the minimum number of bars between the local maximal or minimal values.
Plotting
For some basic indicators, internal horizontal lines are constructed between the maximum and minimum. The lines of the maximum and minimum must be set manually. For example, for RSI - 0 and 100, for DeMark - 0 and 1.
When you change, that is recalculate indicators,maximum and minimum lines of the previous indicator should be changed or disabled, internal lines should be deleted.
The simple procedure is shown in the video. To simplify the procedure, remove the previous indicator from the window and attach the new one.