VolatilityVision
- Indicateurs
- Yury Smagin
- Version: 1.0
- Activations: 5
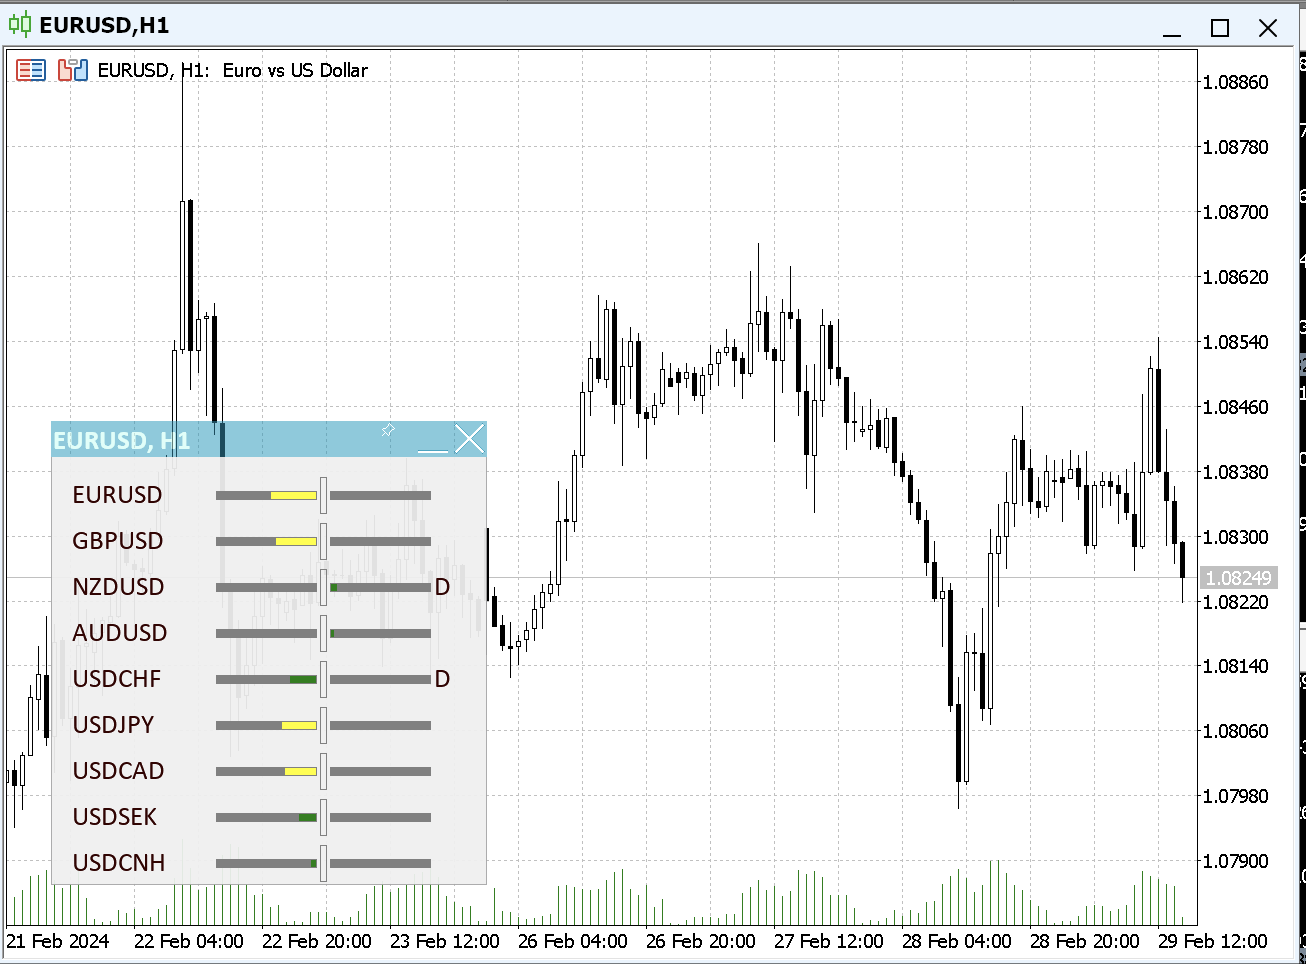
Scanner de Volatilité Multidevises en Temps Réel
Bonjour, traders.
Je vous présente une solution unique : le Scanner de Volatilité Multidevises en Temps Réel. Cet indicateur est l'un des résultats de mes observations personnelles du marché depuis de nombreuses années. Il aborde plusieurs points clés auxquels sont confrontés les traders :
- Suivi de la Volatilité en Temps Réel : Élimine le besoin de mettre constamment à jour ou de changer de graphiques pour voir où se produisent des mouvements significatifs. 🔄
- Compréhension des Corrélations Internationales : Identifie automatiquement comment le mouvement d'une paire de devises peut signaler des changements chez d'autres, simplifiant ainsi la prédiction du marché. 🔍
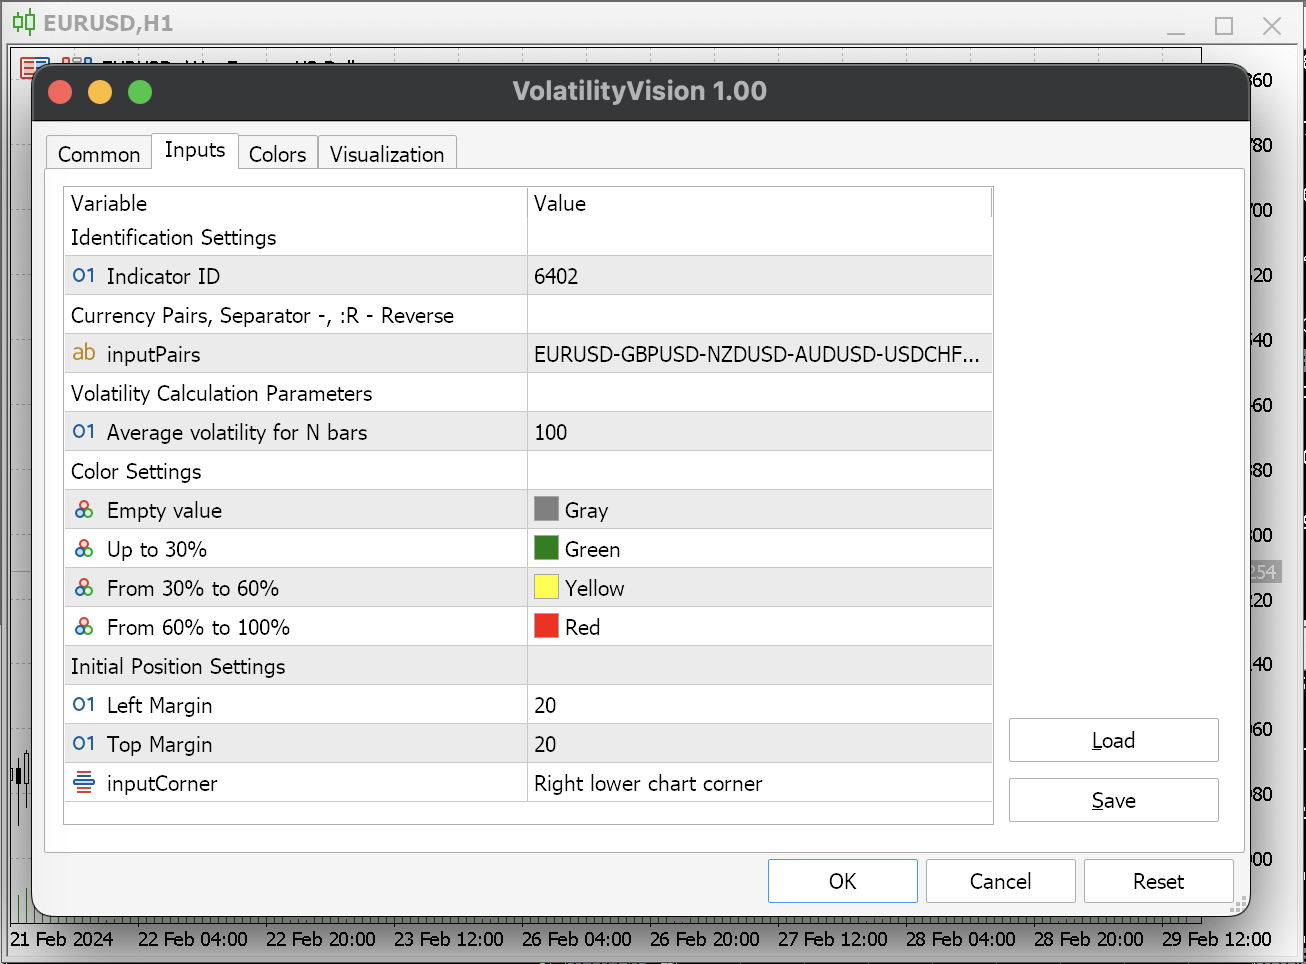
- Simplification de l'Espace de Travail : Le scanner élimine le besoin d'ouvrir plusieurs fenêtres et onglets, regroupant tout dans une interface pratique. 🖥️
- Détection des Divergences : Aide les traders à identifier les retournements potentiels et le début des tendances grâce à l'analyse des divergences entre les paires de devises. 📉📈
- Économie de Temps : Réduit le temps passé à l'analyse et à la surveillance du marché, permettant aux traders de se concentrer sur le développement et l'exécution de stratégies. ⏰
- Renforcement de la Confiance dans la Prise de Décision : Fournit aux traders des données et des informations supplémentaires nécessaires à des décisions commerciales plus éclairées. 📊
- Intégration Facile avec les Stratégies de Trading : Le scanner peut facilement s'intégrer à toute stratégie de trading existante, ajoutant des données précieuses sans nécessiter de modifications majeures. 🛠️
Cet outil est conçu pour rendre le trading plus intuitif, efficace et rentable pour les traders de tous niveaux.