Hydra Trend Rider
- Indicateurs
- INTRAQUOTES
- Version: 1.5
- Mise à jour: 1 mars 2025
- Activations: 5
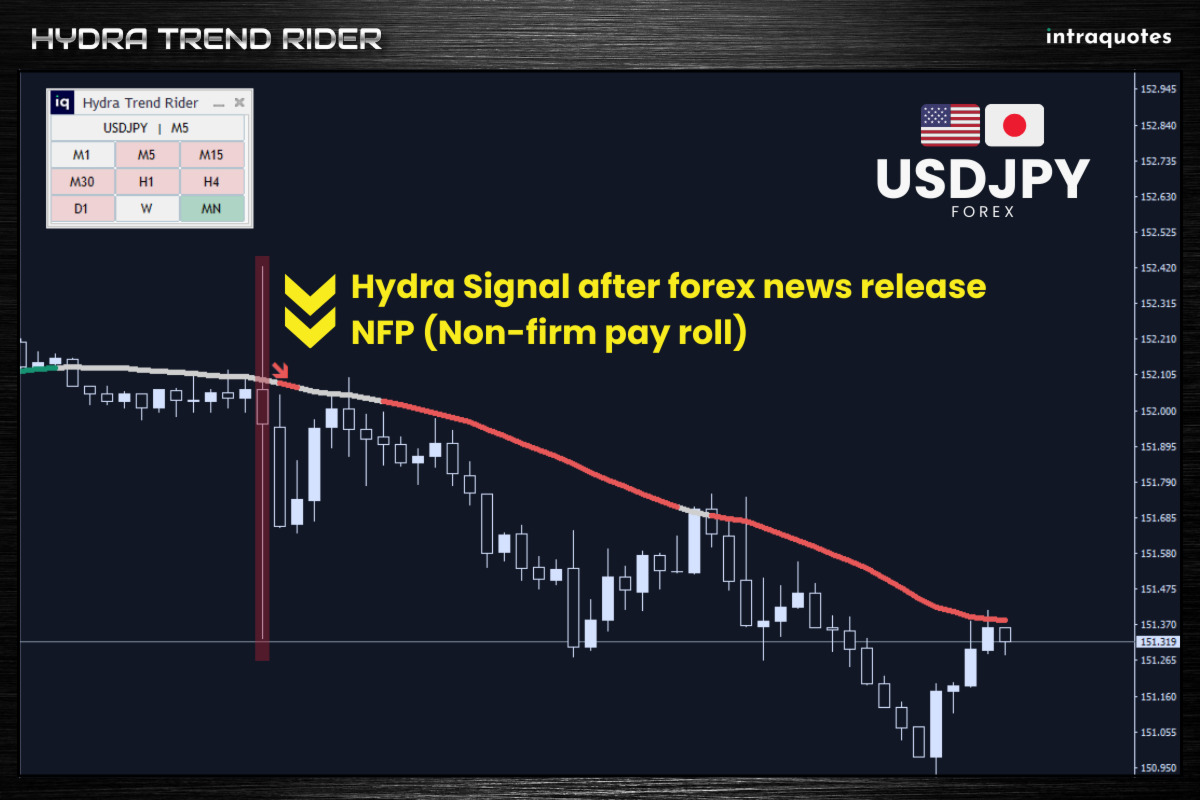
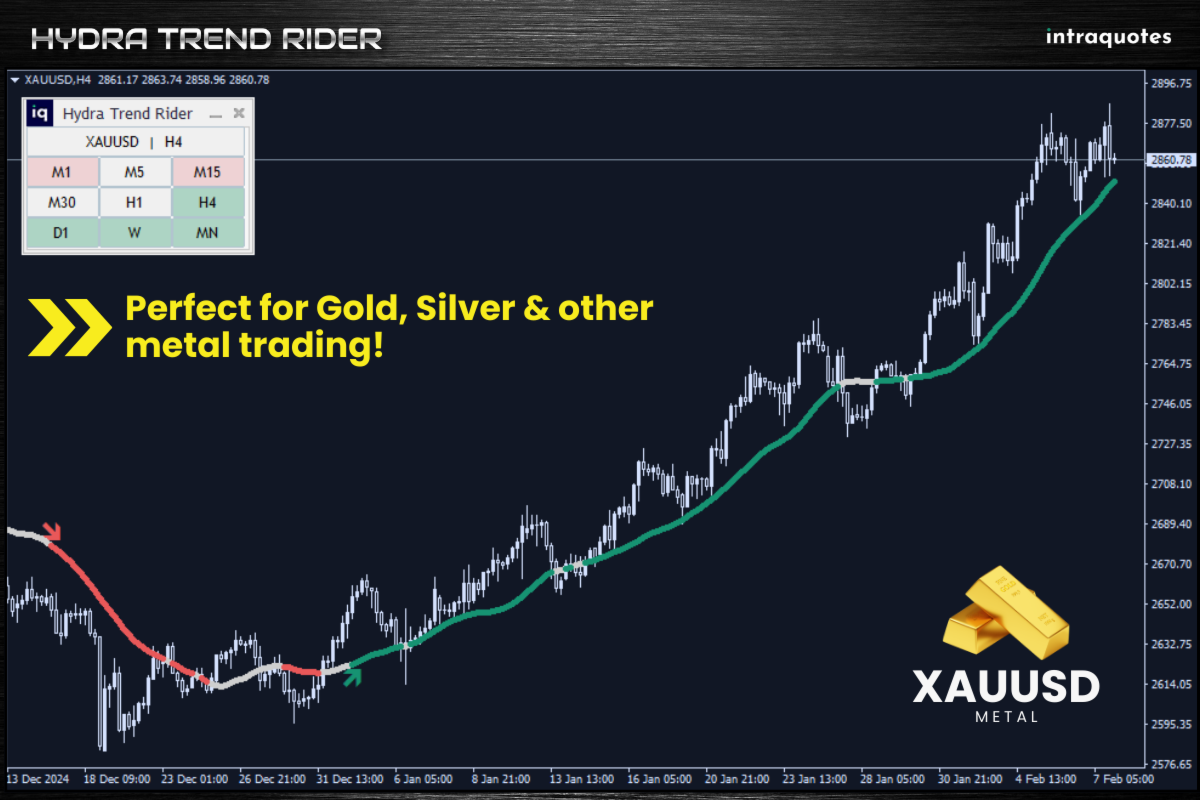
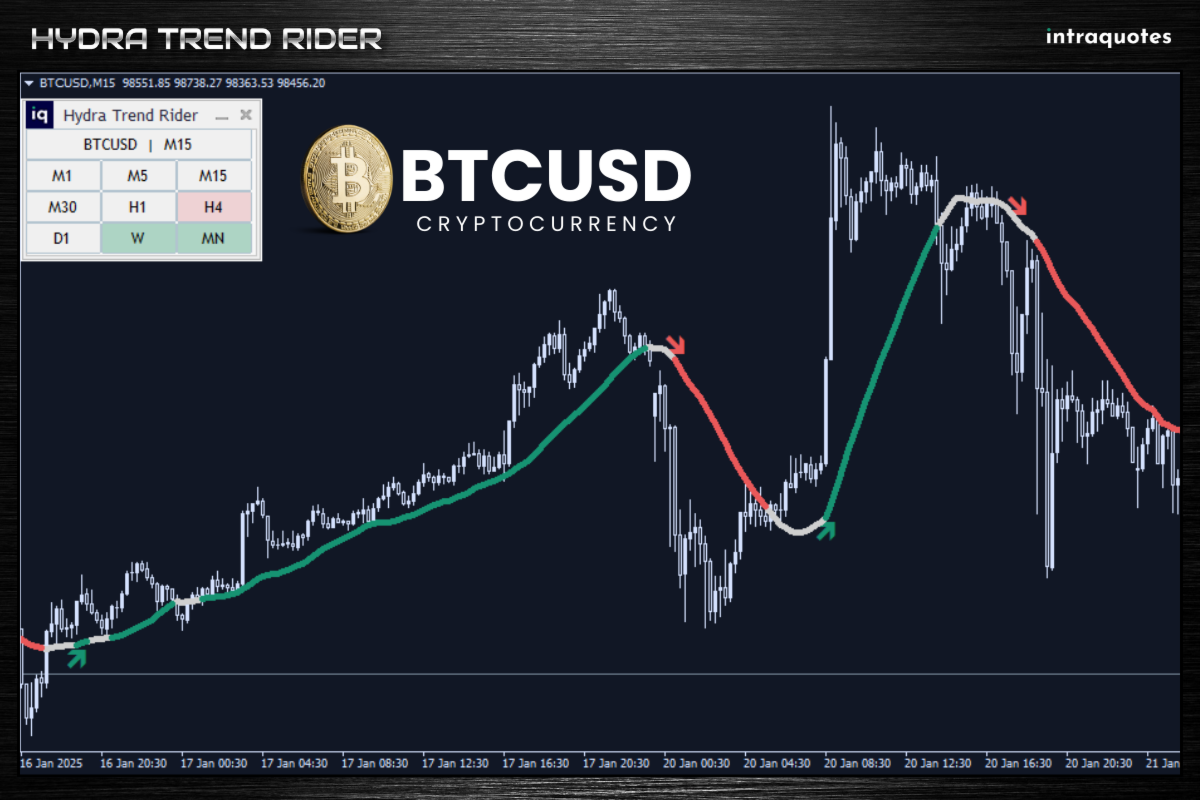
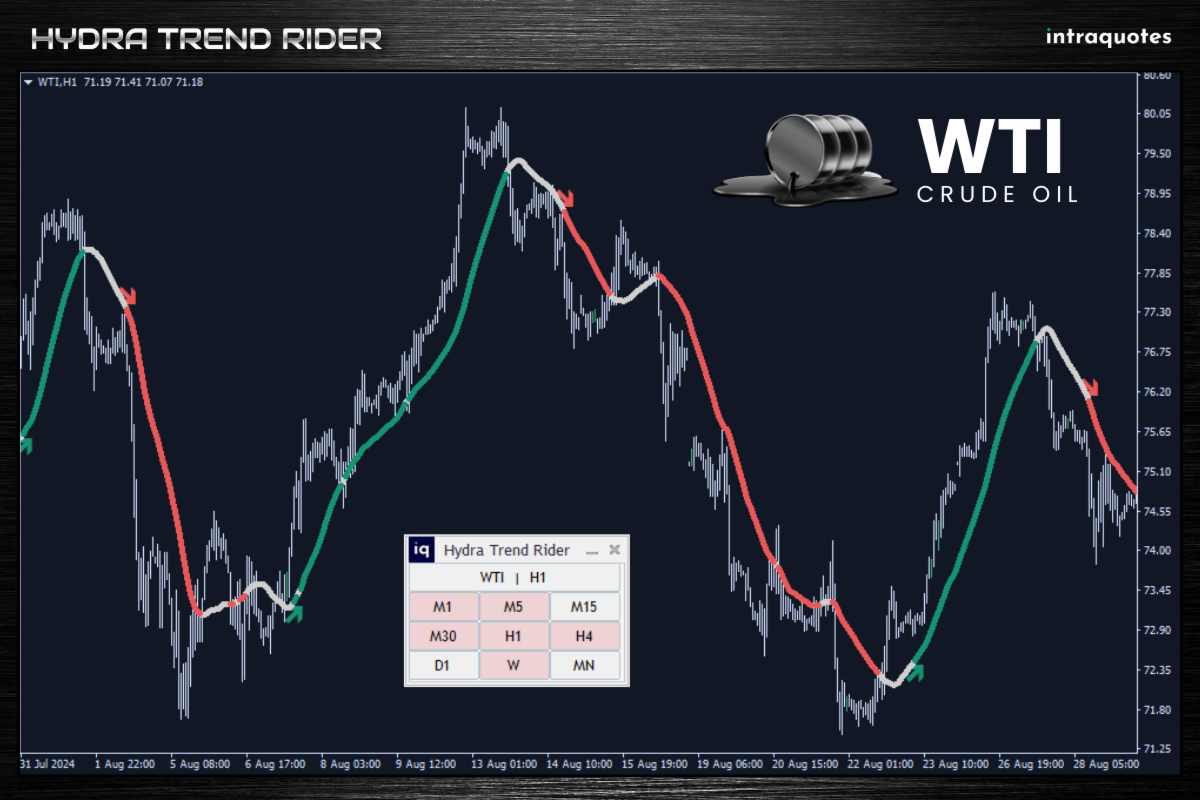
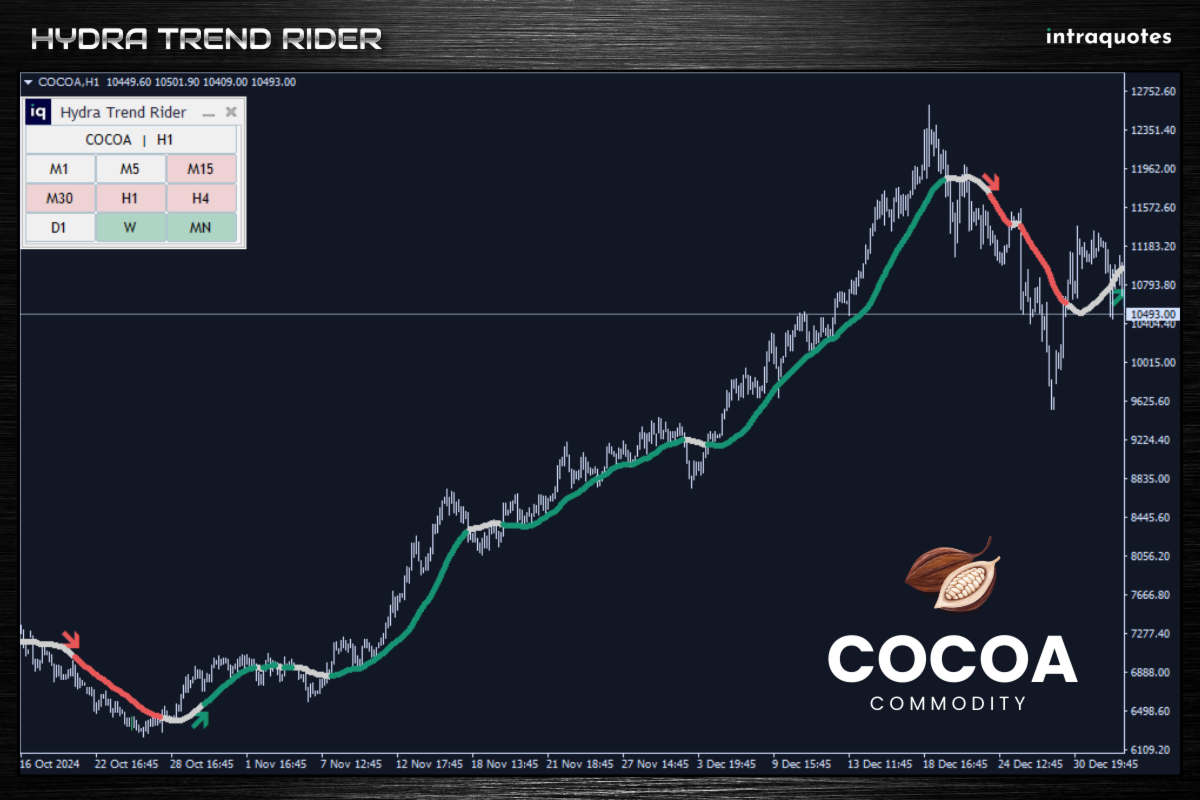
Hydra Trend Rider is a non-repainting, multi-timeframe trend indicator that delivers precise buy/sell signals and real-time alerts for high-probability trade setups. With its color-coded trend line, customizable dashboard, and mobile notifications, it's perfect for traders seeking clarity, confidence, and consistency in trend trading.
- Download the Metatrader 5 Version
- Message us here after purchase to get the Indicator Manual.
- Download Now! Offer valid only for next 10 Buyers. Price will increase gradually!
Disclaimer:
- Due to regulatory restrictions, our service is unavailable in certain countries such as India, Pakistan, and Bangladesh.
- Our products are available only on mql5.com.
- We never contact anyone or sell our products privately.
- We do not provide any personal trading advice.
- We do not sell any of the Intraquotes products on Telegram or any other platform, or website.
Quick Overview
- Multiple Timeframe Dashboard – Analyze trends across M1 to MN timeframes in a single view.
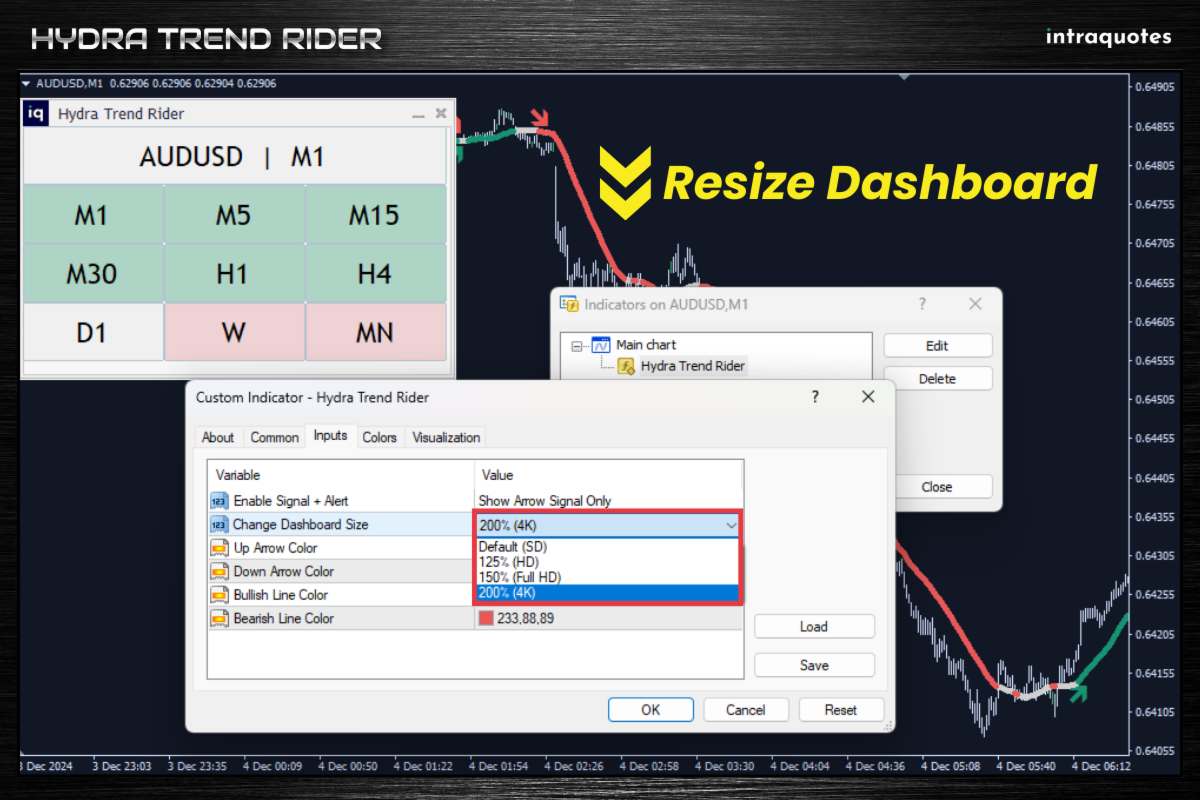
- Dashboard Resizing – Adjustable for SD, HD, Full HD, and 4K monitors.
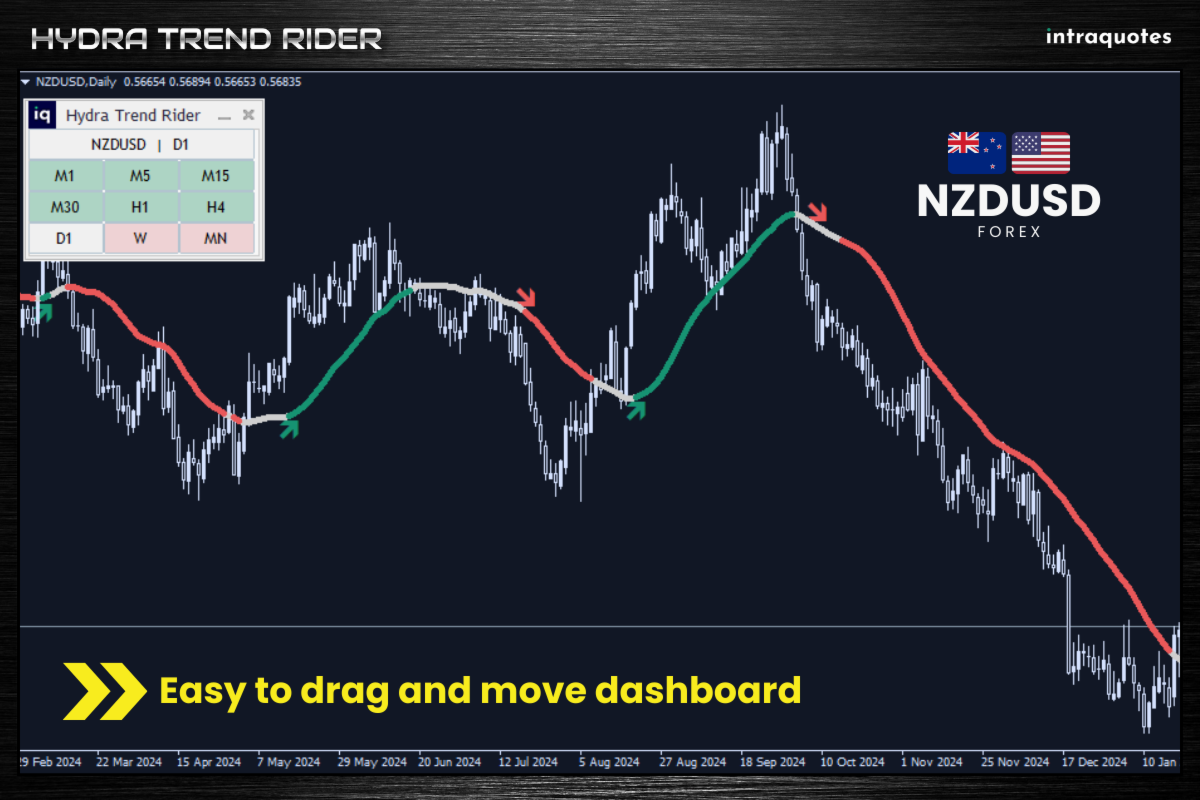
- User-Friendly Design – Move, minimize, and customize the dashboard for an optimized chart experience.
- 5 PC Activation – Use on up to 5 different PCs across multiple brokers for flexible trading.
NOTE: This indicator is compatible with the IQ FX GANN Levels, and can be used together on the same chart for an optimal trading setup.
1. Why is the Hydra Trend Rider Indicator Extremely Useful?
- Precision Buy/Sell Signals – The Hydra Arrow provides clear trade entry signals, reducing guesswork.
- Smart Trend Analysis – The Hydra Line changes color to indicate bullish, bearish, or correction phases, helping you follow trends with confidence.
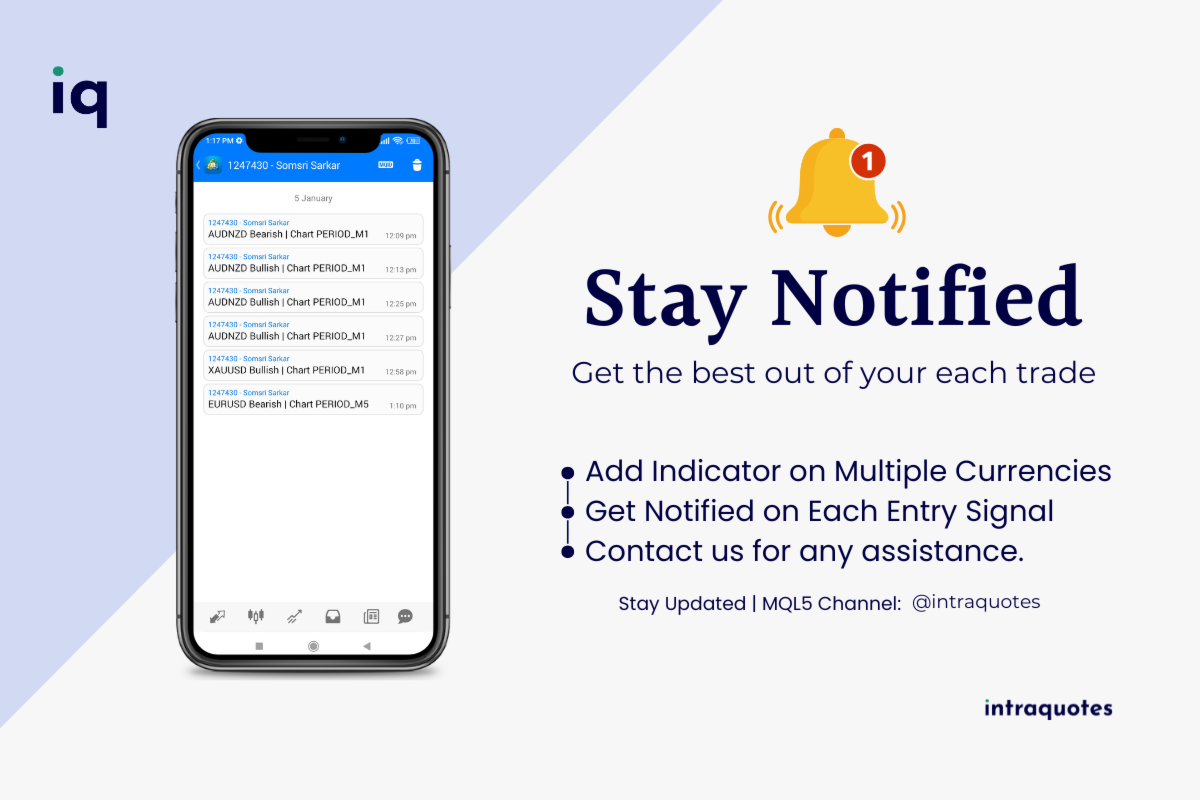
- Mobile Alerts for Convenience – Stay informed with push notifications when a strong trade setup appears, even when you're away from the screen.
2. Who is This Indicator For?
Hydra Trend Rider is designed for traders of all levels—scalpers, intraday traders, and swing traders—who need an easy-to-use, highly accurate tool to identify trends, avoid false signals, and trade with confidence.
3. Supported Symbols List
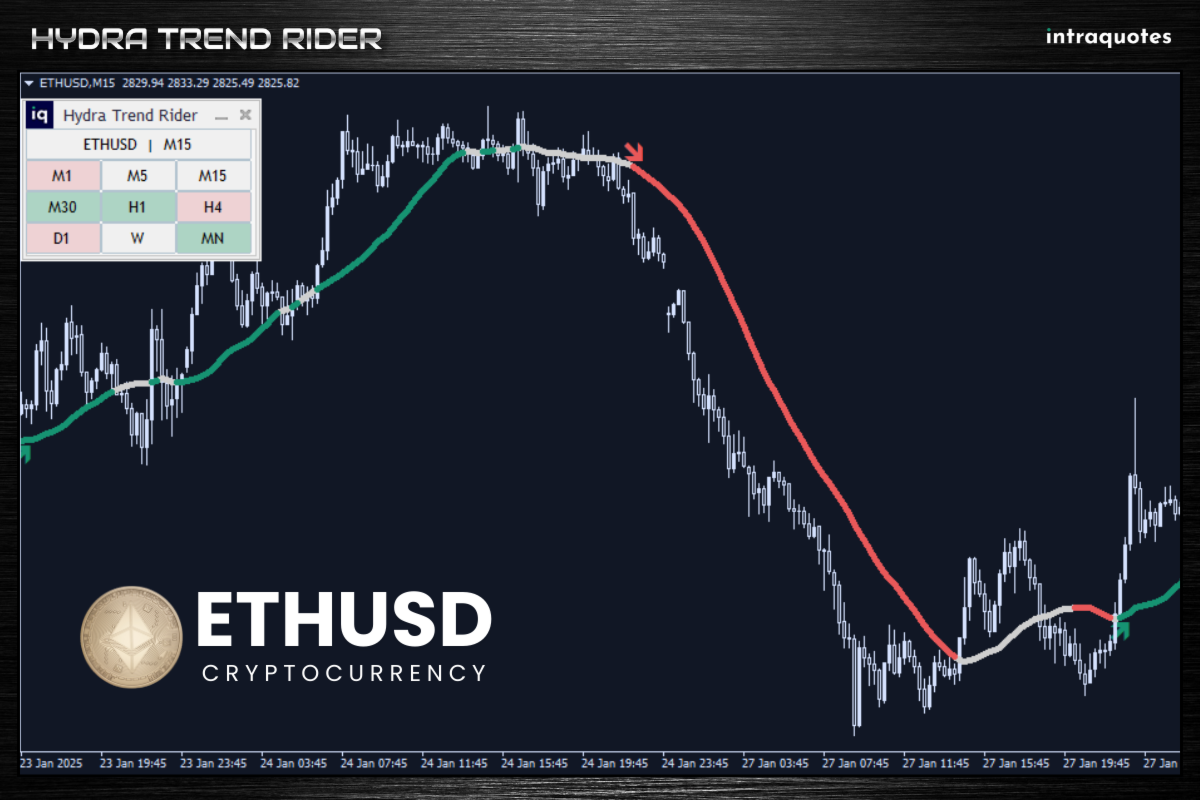
Works with all trading assets, including forex (major & minor pairs), metals, indices, cryptocurrencies, oil, and more.
4. How Does Hydra Trend Rider Work?
- Tracks Multiple Timeframes – Confirms trend strength by analyzing multiple timeframes in real-time.
- Generates Clear Entry Signals – Buy/Sell arrows indicate optimal trade opportunities.
- Hydra Line Trend Confirmation – A color-changing trend line helps determine the trend direction.
- Identifies Trend Corrections – Detects price corrections, helping traders time their re-entries.
- Real-Time Dashboard Updates – Provides instant market insights at a glance.
- Customizable Alerts – Set up mobile notifications to receive alerts on potential trade setups.
5. Trading Strategies with Hydra Trend Rider
Multiple Timeframe Strategy
Enhance your analysis by observing market behavior across multiple timeframes. This strategy allows you to confirm trends and make more accurate trading decisions.
Trend Following
Utilize our trend-following feature as explained in the user guide to identify and follow market trends. This approach helps you to stay in profitable trades longer and maximize your gains.
Trail Position
Optimize your exit plan with our trail position strategy. We will teach you how to adjust your stop-loss levels as the market moves in your favor, protecting your profits and minimizing risks.
Spotting a Good Entry Signal
Our indicator excels in spotting optimal entry signals. This strategy enables you to enter trades at the most advantageous points, enhancing your potential for success.
Entering a Trade After Correction
Powerful trends often corrects them before going even further. Hydra indicator can help you identify correction zones easily.
Merging with Other Indicators
For enhanced trend confirmation, observe market price action and consider combining our indicator with others in your toolkit.
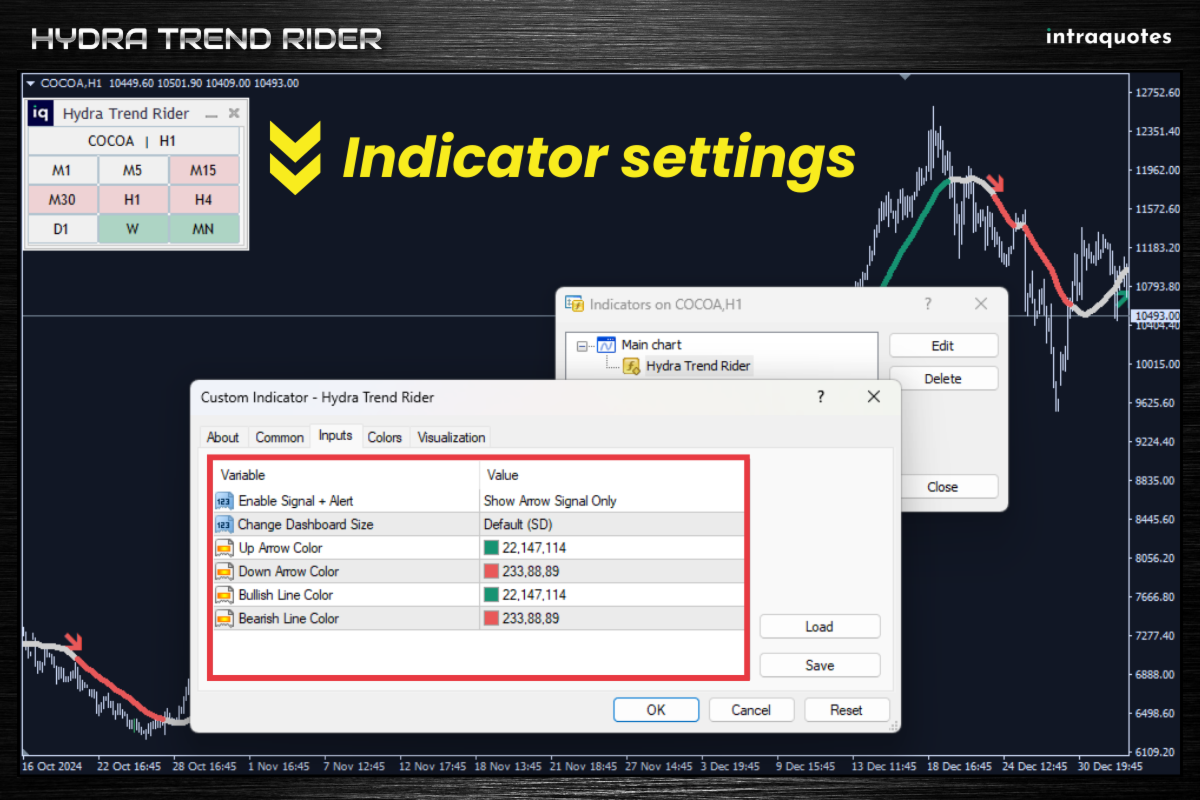
6. Customize Indicator Settings
- Dashboard Customization – Resize, move, and minimize for a personalized setup.
- Hydra Line & Arrow Colors – Customize colors for better visibility.
- Signal Preferences – Choose to display only arrow signals or enable mobile alerts along with the arrow signals.
- Mobile Push Notifications – Get real-time alerts when market conditions align with your strategy.
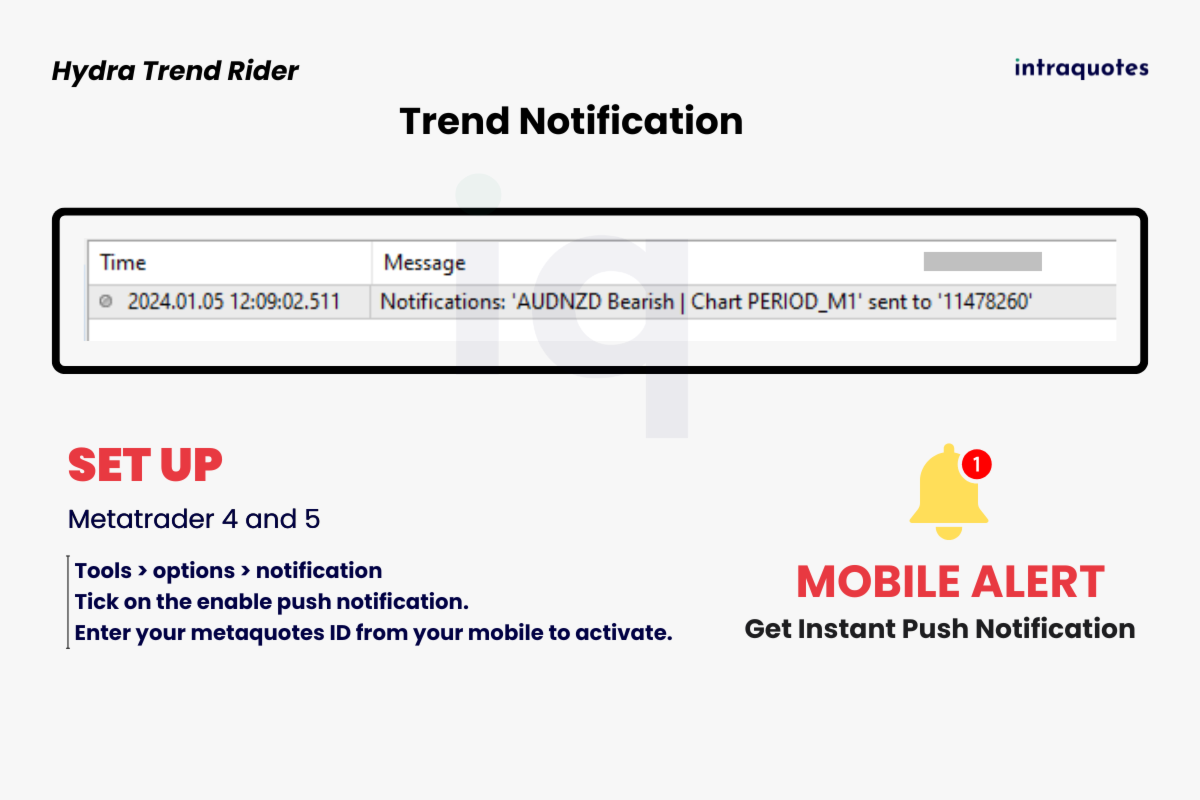
7. Note for Mobile Alert
To receive mobile alerts for this indicator, enable push notifications in MetaTrader 4 by pressing Ctrl + O (or accessing Options) and navigating to the Notifications tab. Enter your MetaQuotes ID from the MetaTrader app on your mobile device to link it with your platform. Once connected, test the setup to ensure alerts are working. If you face any issues, contact our support team for assistance.
8. FAQ
Q: Does it repaint?
A: Never!
Q: Is there any trial option available?
A: Yes! You can download the demo and backtest.
9. Indicator Troubleshooting
The user guide which you will receive after purchasing the indicator covers all the topics comprehensively. Contact us after you purchase the indicator successfully.
10. Support & Updates:
- For assistance, send us a direct message on MQL5.
- Follow our channel for updates and market insights.
- If you encounter any technical issues with the indicator, contact us directly on MQL5.
Risk Disclosure:
Trading financial markets carries inherent risks and may not be suitable for every investor. This indicator is designed as a tool to assist in trading decisions but does not guarantee profits or prevent losses, which could exceed your initial investment. Past performance is not a reliable indicator of future outcomes. Users are encouraged to fully understand the risks and seek independent financial advice if needed. Any trading decisions made using this indicator are at the user's discretion and responsibility.
Related topics:
Trend analysis, multiple timeframe trend analysis, candlestick charts, bar chart, trend dashboard, scalping, day trading, position trading, swing trading, trade following, trend riding, indicator, trend following, trend reversal, MetaTrader software, currency pairs, market analysis, chart window, mobile alert, trading strategy, multiple timeframe, dashboard, 4K monitors, risk disclosure, market price action, trading decisions, lag-free, range-bound conditions, bearish signal, bullish signal, correction, higher highs, lower lows, entry signals, downtrend, uptrend, manual, strategy examples, legal restrictions, responsible trading, eurusd, gbpusd, bitcoin.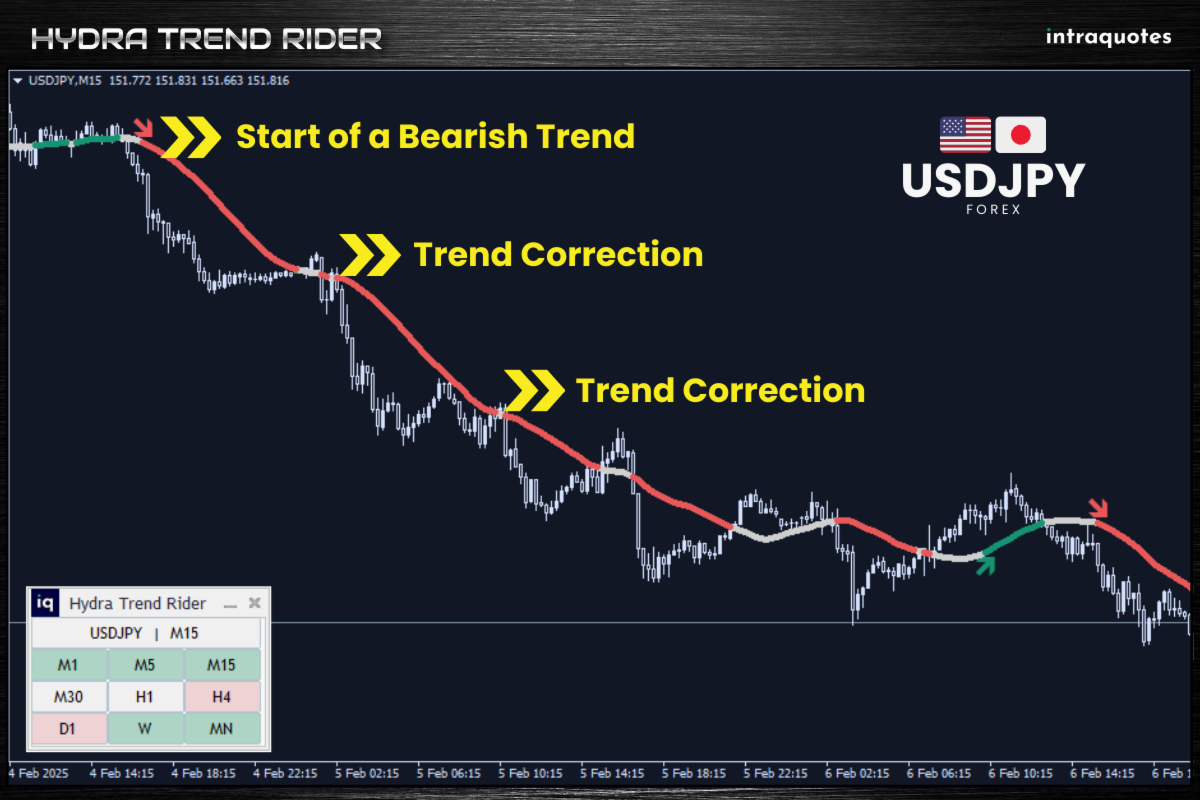


I've been using this indicator for a week, this indicator always deliver reliable entry and exit signals. Further, with the multi-timeframe analysis, it can give an extra confirmation for trade decisions. Excellent indicator.