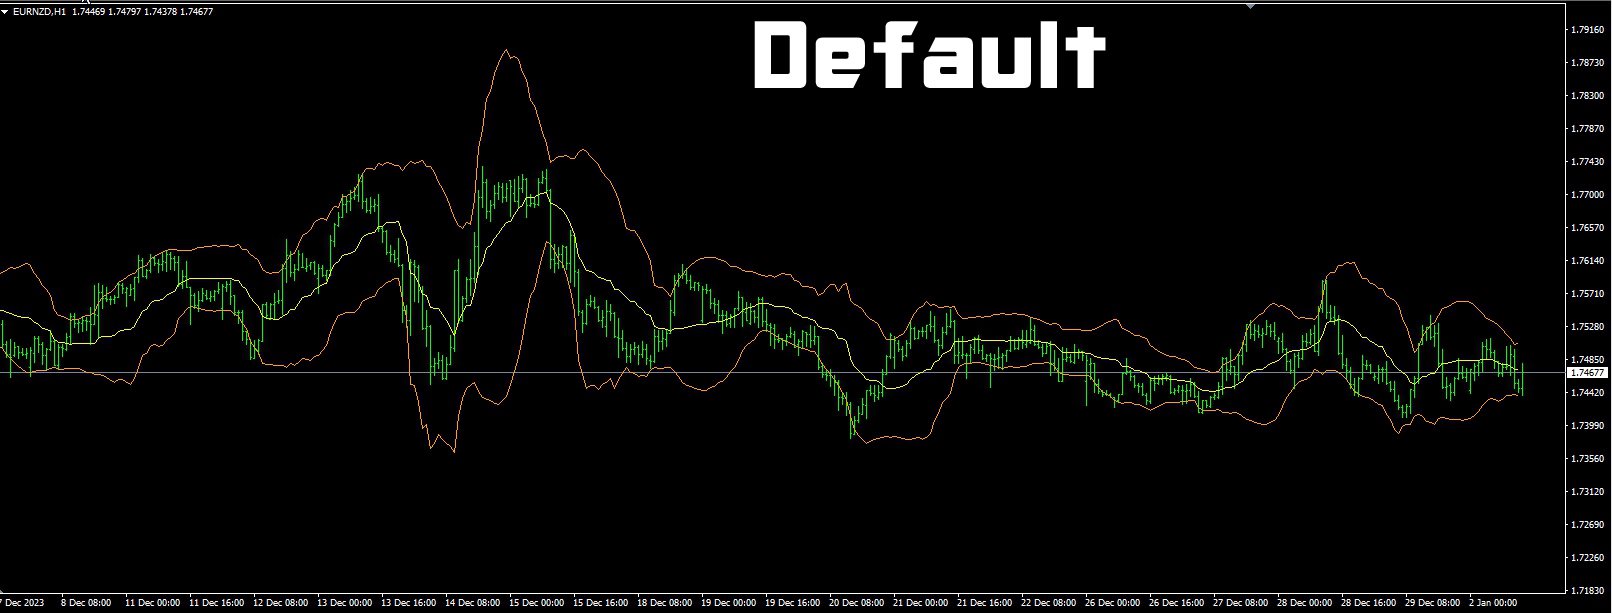
LLAMA Bollinger Bands
- Indicateurs
- Jean Francois Le Bas
- Version: 1.1
- Activations: 20
LLAMA BB has been made from the same formula that creates regular BB.
The only difference is that the smoothing alogrithms have been replaced by the LLAMA (LagLess Adaptive Moving Average)
Main parameters are the same :
2) LLAMA Period
1) STDDEV Period
3) STDDEV Multiplier
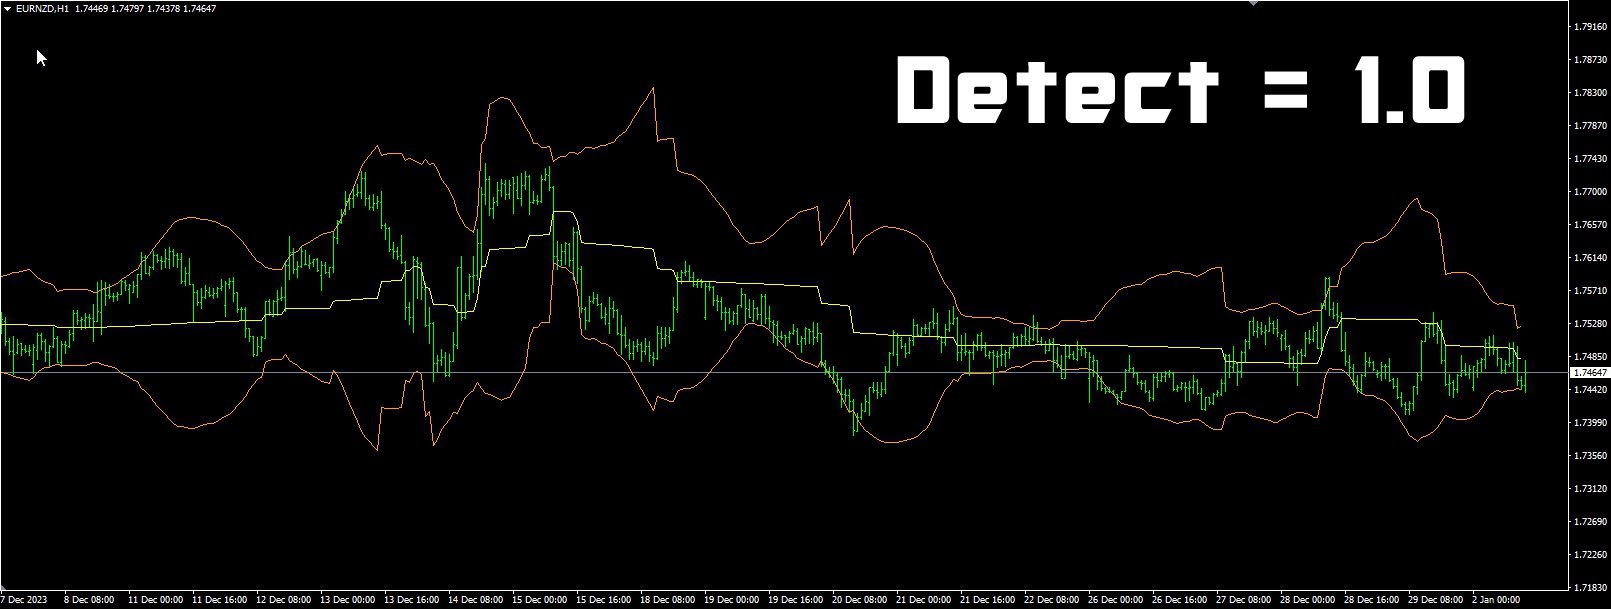
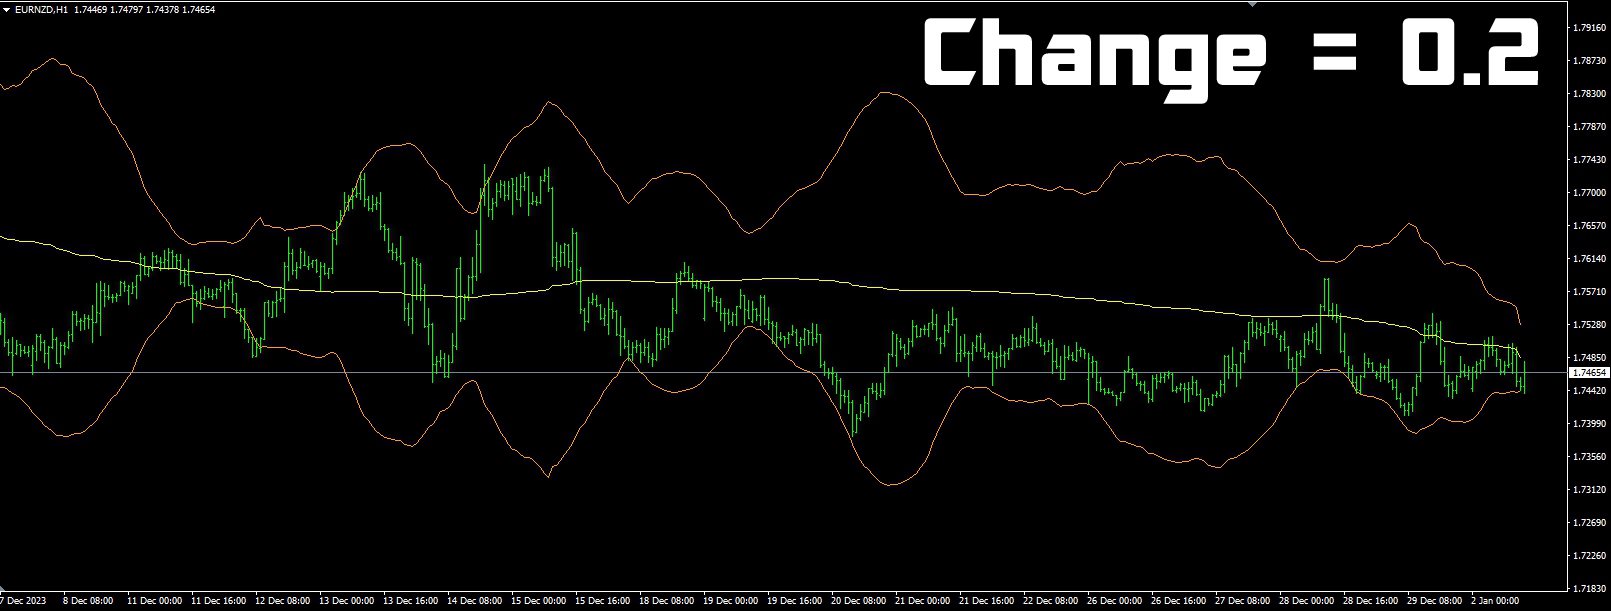
and the LLAMA Parameters are the same as with the single AMA:
1) ActiveBar : computes last bar as well in Realtime (higher CPU usage)
2) ATRPeriod
3) ATRDistMul =: Multiplier1 (Detect)
4) ATRDistMul2 : Multiplier2 (Change)
you can see on the screenshots how each setting of the indicator changes the way price data is transformed