• Aperçu
  • Avis (1)
  • Commentaires (1)

Trading In The Zone

Cela nécessite qu'une fractale se ferme encore afin que l'indicateur calcule à nouveau si la fractale est commutée et ne s'est pas fermée. C'est juste la nature d'une fractale.

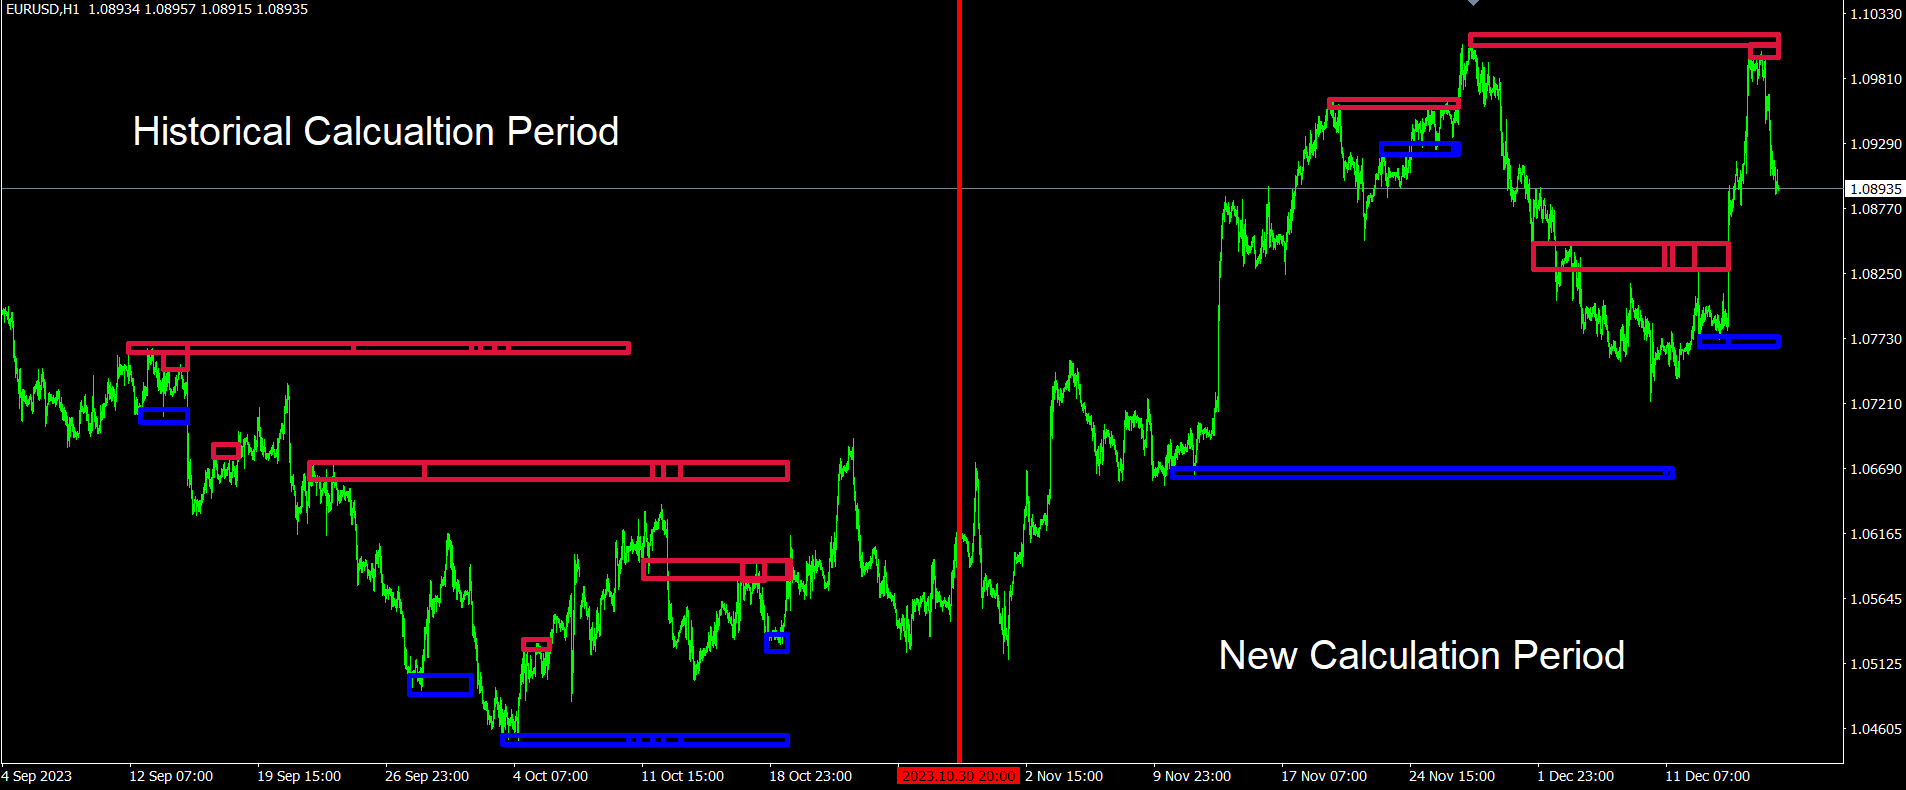
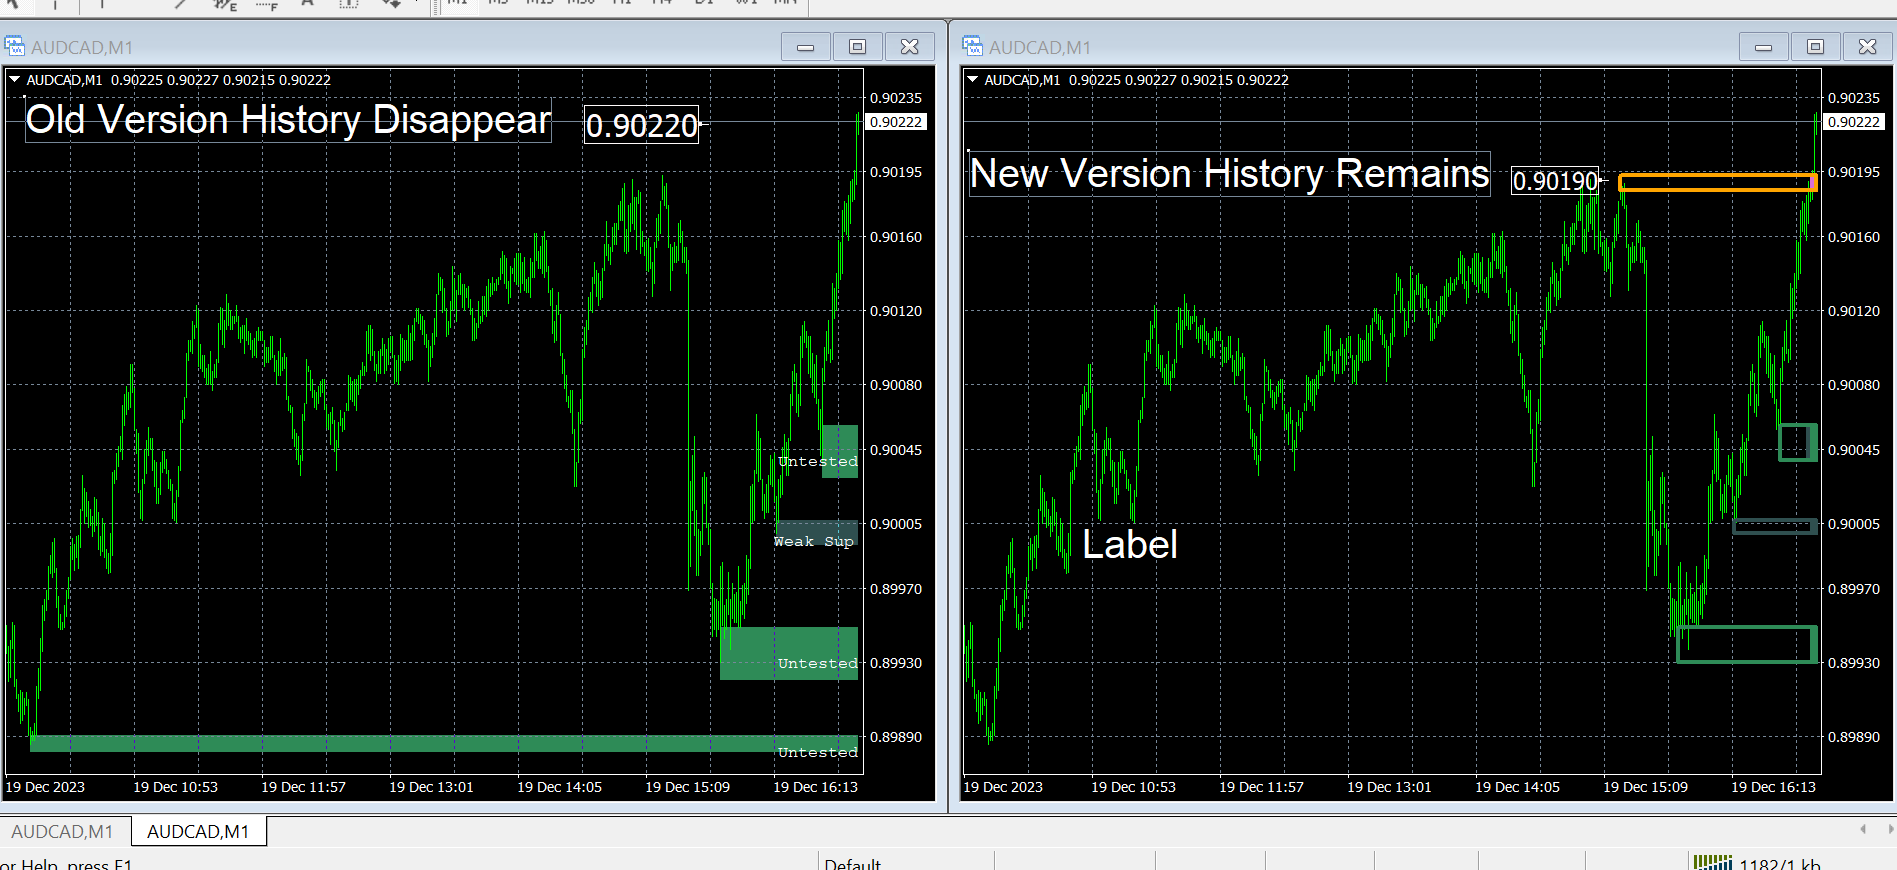
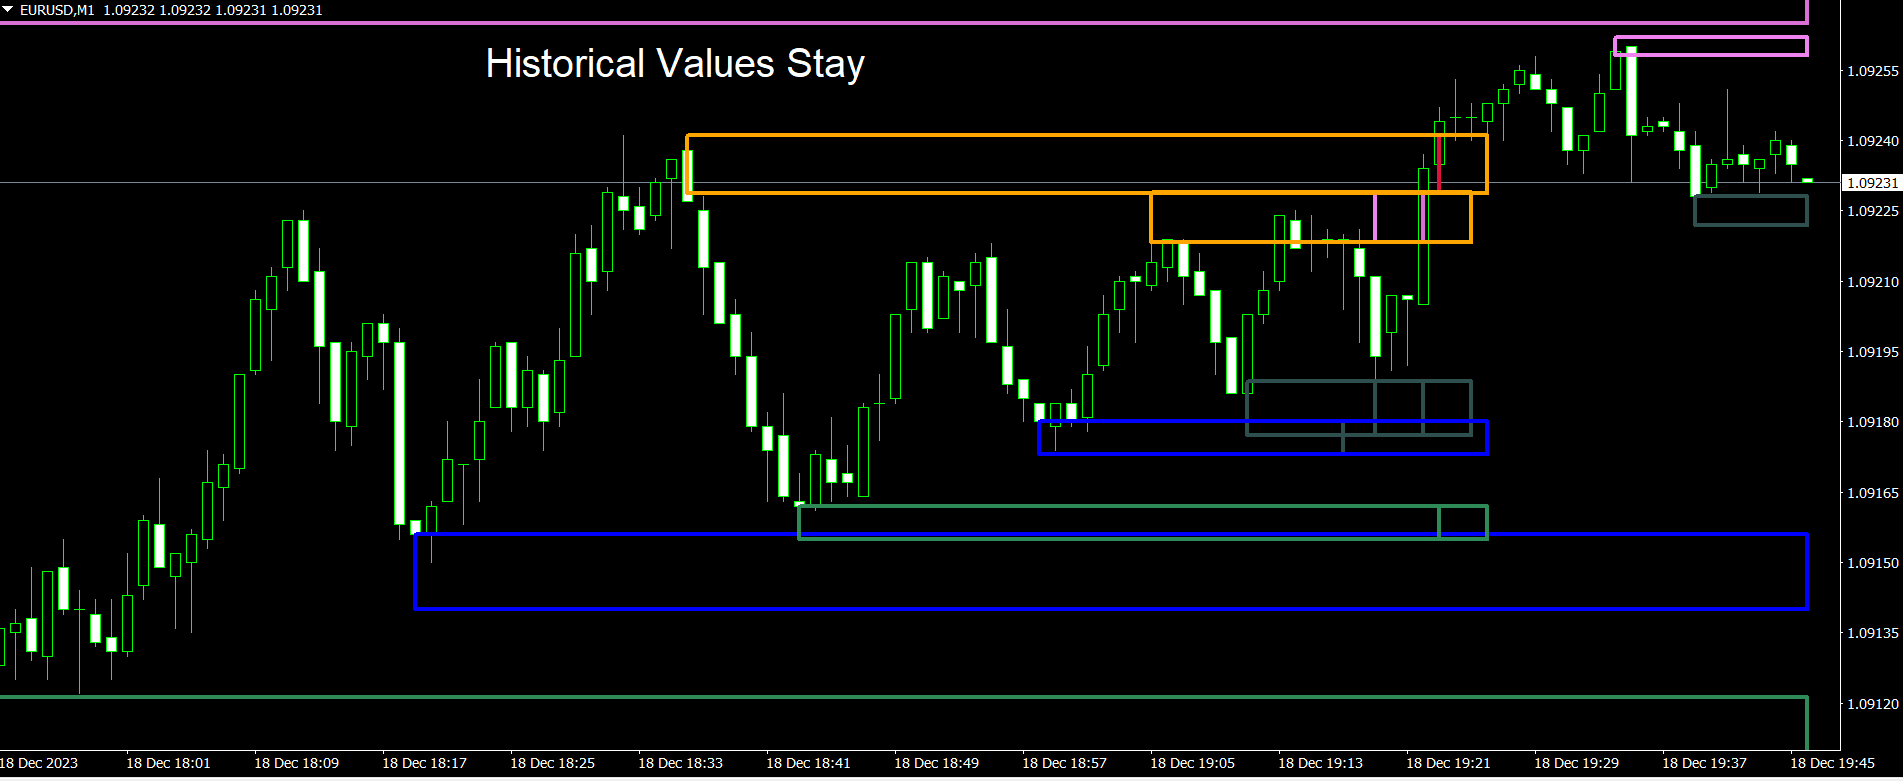
Le trading dans la zone est un indicateur d'offre et de demande très recherché, réputé pour son efficacité à identifier les zones commerciales clés au sein des marchés financiers. Contrairement à la version originale de cet indicateur, qui rencontrait souvent des problèmes de repeinture et d'effacement des zones précédemment identifiées, cette itération améliorée garantit que les zones restent visibles dans les données historiques, offrant aux traders un avantage distinct pour identifier les niveaux de support et de résistance cruciaux.


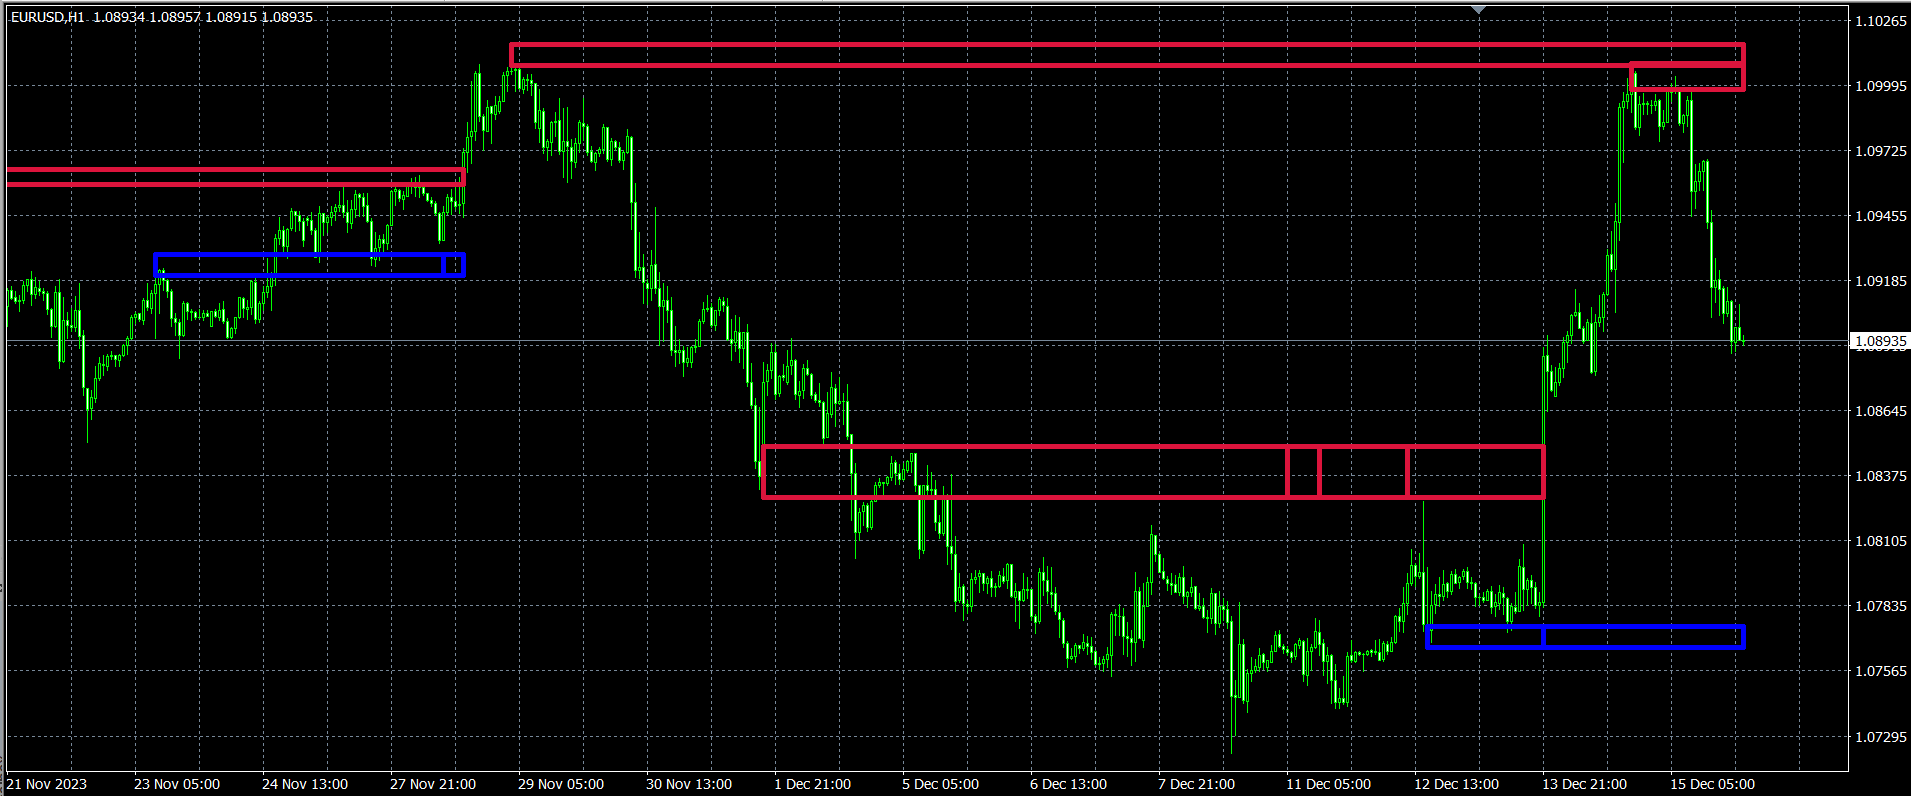
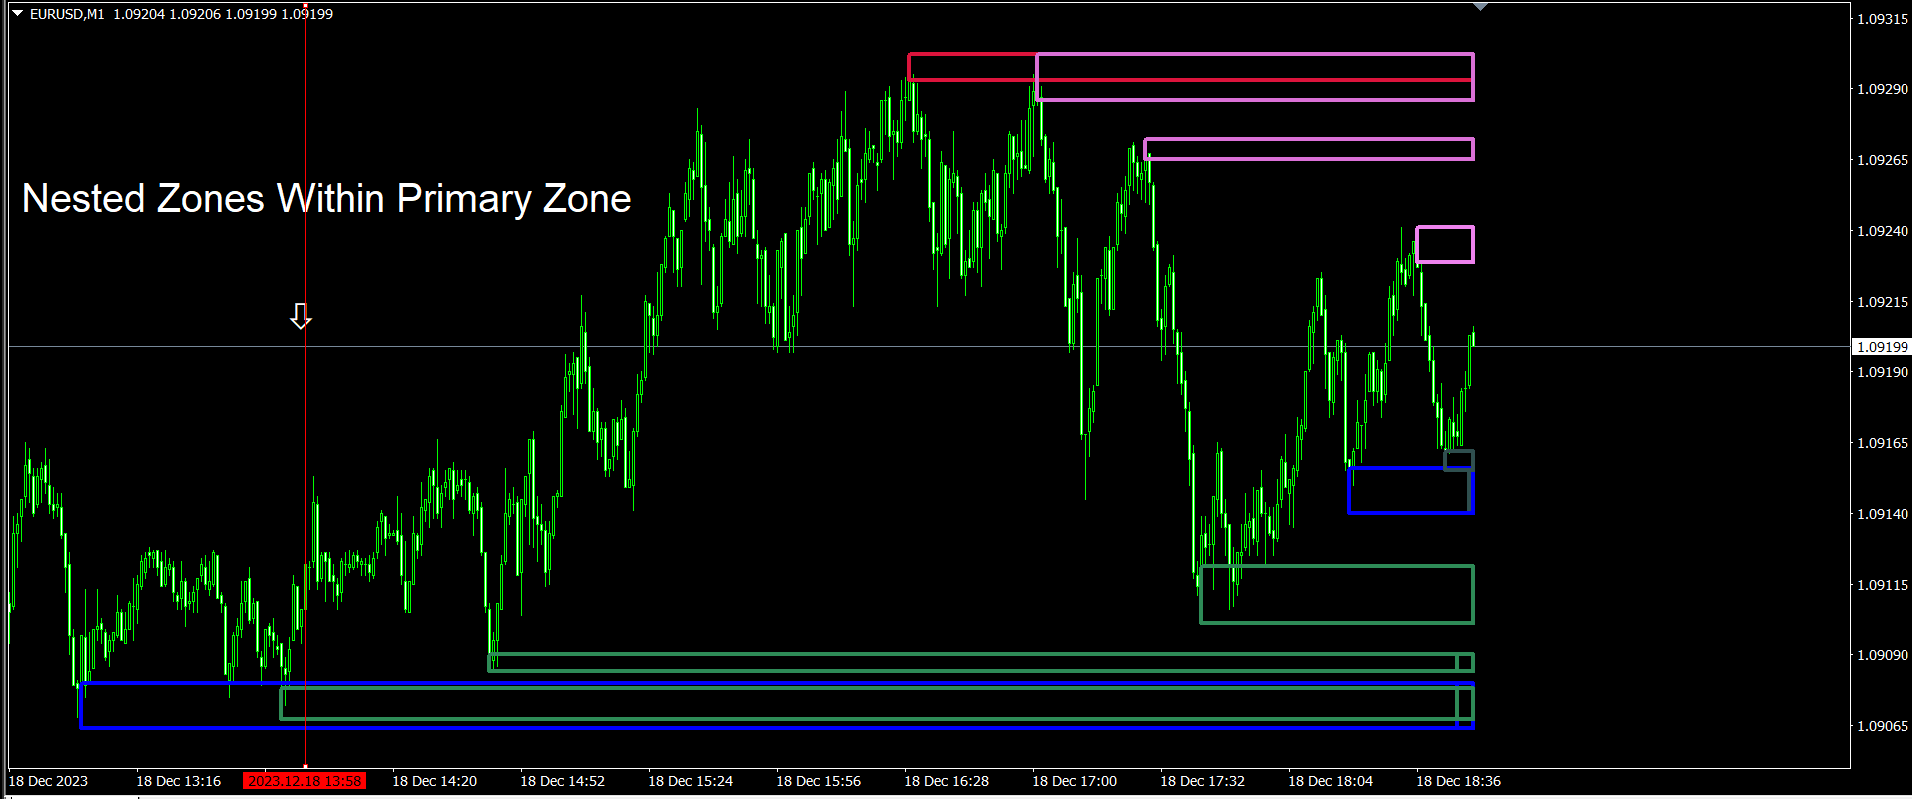
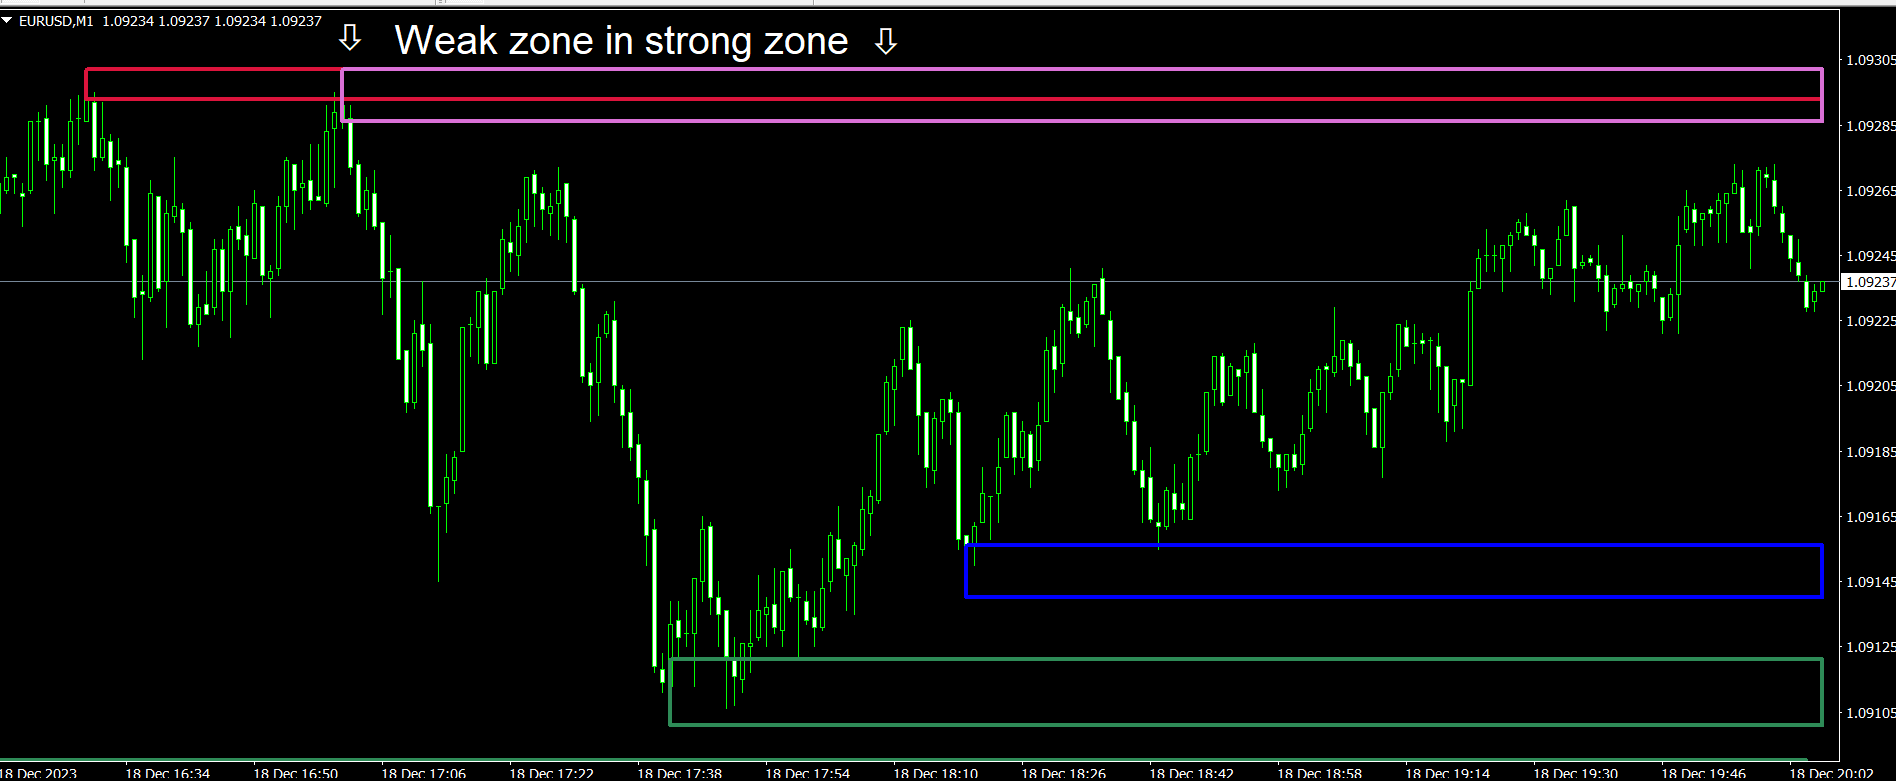
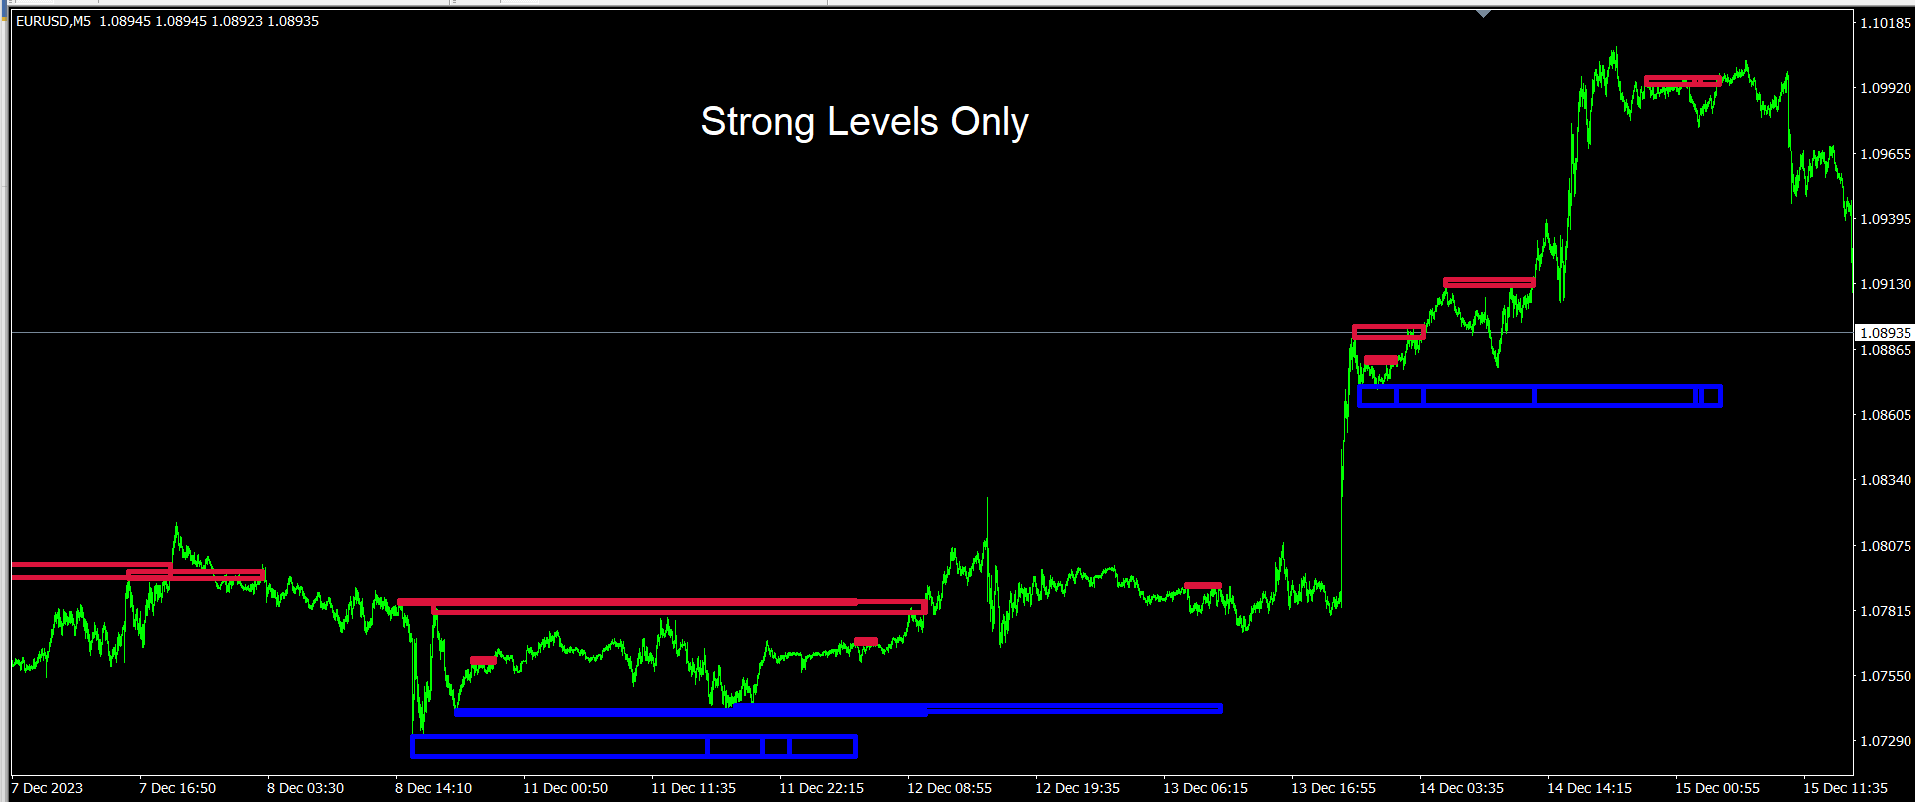
La fonction principale de l'indicateur tourne autour du concept de dynamique de l'offre et de la demande au sein du marché. Il identifie les domaines dans lesquels il existe un déséquilibre significatif entre les pressions d'achat et de vente, conduisant à des tournants potentiels ou à des niveaux d'intérêt pour les traders. En évitant le problème courant de la repeinture, où les zones précédemment identifiées disparaissent ou se déplacent, les traders peuvent s'appuyer sur la précision historique de l'indicateur pour prendre des décisions commerciales éclairées.

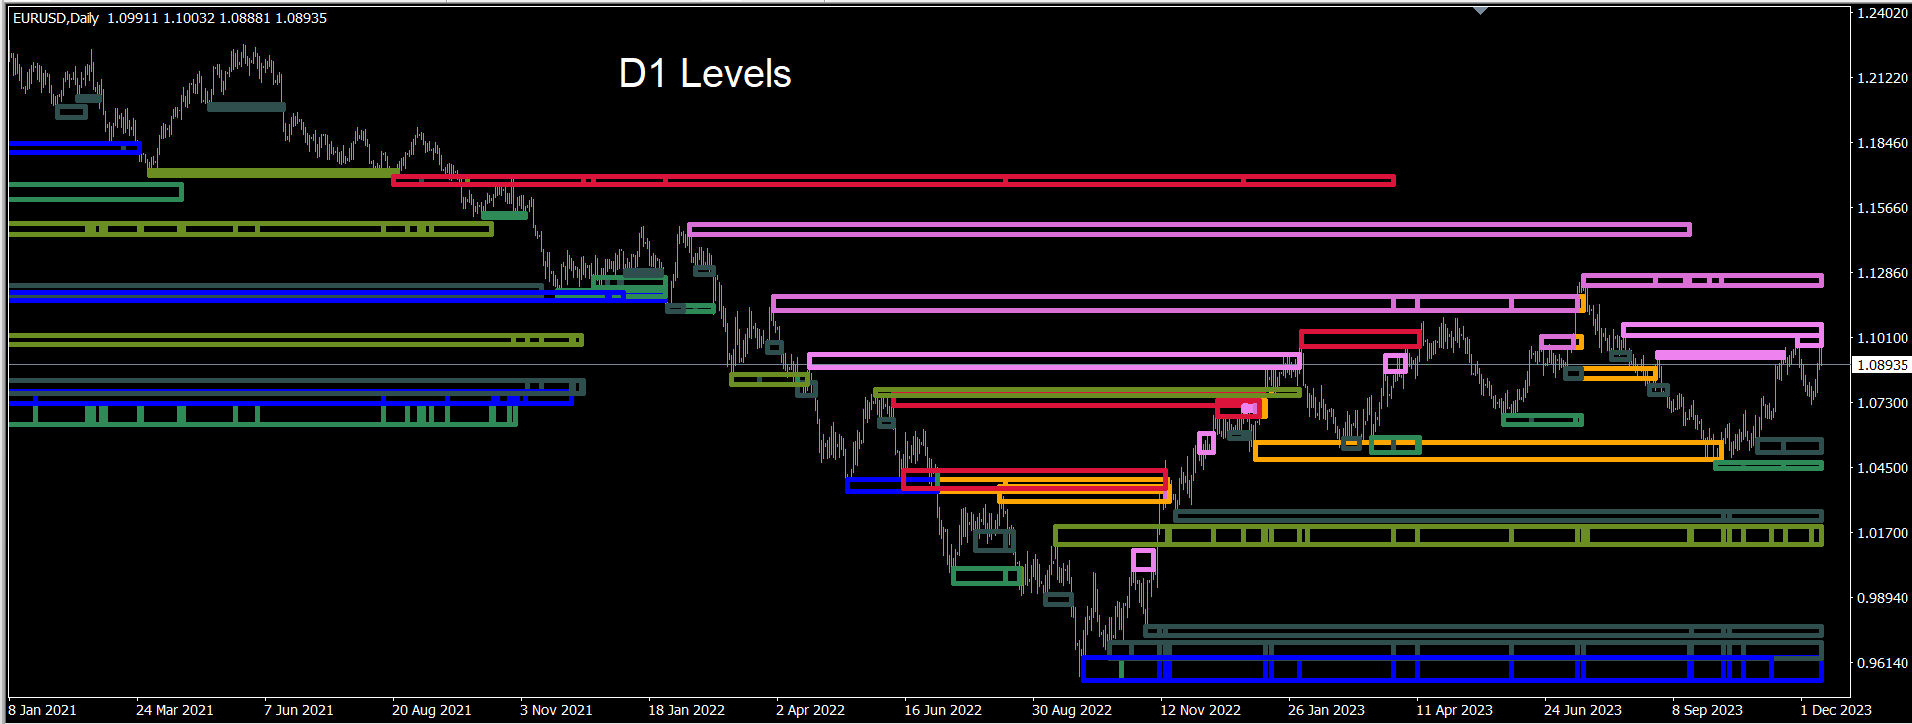
Essentiellement, Trading in the Zone fournit aux traders un outil précieux pour mieux comprendre le sentiment du marché et anticiper les mouvements potentiels des prix. Sa capacité à maintenir l'intégrité des zones identifiées à travers les données historiques permet aux traders de savoir où des niveaux de prix importants se sont produits dans le passé, facilitant ainsi des stratégies d'entrée et de sortie plus précises.

Dans l'ensemble, le trading dans la zone est un puissant indicateur de l'offre et de la demande qui offre aux traders un avantage distinct pour naviguer dans les complexités des marchés financiers en fournissant des informations historiques précises et fiables sur la zone.
Produits recommandés
This is a new strategy for SUPPLY DEMAND areas It is based on a calculation using the tick volume to detect the big price action in market for both bear /bull actions this smart volume action candles are used to determine the supply and demand areas prices in between main supply and demand lines indicate sideway market  up arrows will be shown when prices moves above the main supply and the secondary supply lines Down arrows will be shown when prices moves below the main demand and the secondary
VR Cub
Vladimir Pastushak
VR Cub est un indicateur permettant d'obtenir des points d'entrée de haute qualité. L'indicateur a été développé pour faciliter les calculs mathématiques et simplifier la recherche de points d'entrée dans un poste. La stratégie de trading pour laquelle l'indicateur a été rédigé prouve son efficacité depuis de nombreuses années. La simplicité de la stratégie de trading est son grand avantage, qui permet même aux traders débutants de négocier avec succès avec elle. VR Cub calcule les points d'ouve
Master Scalping M1 est un indicateur innovant qui utilise un algorithme pour déterminer rapidement et avec précision la tendance. L'indicateur calcule le temps d'ouverture et de fermeture des positions, les algorithmes de l'indicateur vous permettent de trouver les moments idéaux pour entrer dans une transaction (acheter ou vendre un actif), ce qui augmente le succès des transactions pour la plupart des commerçants. Avantages de l'indicateur : Facile à utiliser, ne surcharge pas le graphique ave
KT Renko Patterns MT4
KEENBASE SOFTWARE SOLUTIONS
2.33 (3)
KT Renko Patterns scans the Renko chart brick by brick to find some famous chart patterns that are frequently used by traders across the various financial markets. Compared to the time-based charts, patterns based trading is easier and more evident on Renko charts due to their uncluttered appearance. KT Renko Patterns features multiple Renko patterns, and many of these patterns are extensively explained in the book titled Profitable Trading with Renko Charts by Prashant Shah. A 100% automate
Check My Product Contact me to discover all my services  Supply and demand zones are one of the most basic things a beginner forex trader learns. These zones are so important, price reacts off of them even after years since they first developed. And with the supply and demand zones indicator, a forex trader might not need to worry about drawing all these historical zones one after the other. The supply and demand zone indicator accurately draws the supply and demand zones of a currency pair
Infinity Trend Pro
Yaroslav Varankin
1 (1)
This is a trend indicator without redrawing Developed instead of the binary options strategy (by the color of the Martingale candlestick) Also works well in forex trading When to open trades (binary options) A signal will appear in the place with a candle signaling the current candle It is recommended to open a deal for one candle of the current timeframe M1 and M5 When a blue dot appears, open a deal up When a red dot appears, open a trade down. How to open trades on Forex. When a signal is rec
Daily Candle Predictor est un indicateur qui prédit le cours de clôture d'une bougie. L'indicateur est principalement destiné à être utilisé sur les graphiques D1. Cet indicateur convient à la fois au trading forex traditionnel et au trading d'options binaires. L'indicateur peut être utilisé comme un système de trading autonome, ou il peut servir de complément à votre système de trading existant. Cet indicateur analyse la bougie actuelle, calcule certains facteurs de force à l'intérieur du corps
The indicator detects and displays 3 Drives harmonic pattern (see the screenshot). The pattern is plotted by the extreme values of the ZigZag indicator (included in the resources, no need to install). After detecting the pattern, the indicator notifies of that by a pop-up window, a mobile notification and an email. The indicator highlights the process of the pattern formation and not just the complete pattern. In the former case, it is displayed in the contour triangles. After the pattern is com
Indicator. "Indicator wave or Indicator Ma". Using 23 standard indicators and the author's algorithm, the levels of purchases (from 0 to +100) and sales (from 0 to -100) are calculated. Then, using the calculated levels, the "Wave Indicator" draws a wave with 21 moving averages. The wave number is equal to the averaging period of the calculated levels. Waves # 1 - 7 Fast Moving Averages Waves from No. 8 -14 moving averages Waves from No. 15-21 slow moving averages Looking at the figu
Owl smart levels
Sergey Ermolov
4.63 (54)
Version MT5  |  FAQ L' indicateur Owl Smart Levels   est un système de trading complet au sein d'un seul indicateur qui comprend des outils d'analyse de marché populaires tels que   les fractales avancées de Bill Williams , Valable ZigZag qui construit   la structure d'onde correcte   du marché et   les niveaux de Fibonacci   qui marquent les niveaux exacts d'entrée. sur le marché et les endroits où prendre des bénéfices. Description détaillée de la stratégie Mode d'emploi de l'indicateur Conse
Professional forex expert   Black Angel   (for EURUSD, GBPUSD pairs) alyzing the market using the Elliot Wave Index. Elliott wave theory is the interpretation of processes in financial markets through a system of visual models (waves) on price charts. The author of the theory, Ralph Elliott, identified eight variants of alternating waves (of which five are in the trend and three are against the trend). The movement of prices in the markets takes the form of five waves. Three of them (1, 3, 5)
TWO PAIRS SQUARE HEDGE METER INDICATOR Try this brilliant 2 pairs square indicator It draws a square wave of the relation between your two inputs symbols when square wave indicates -1 then it is very great opportunity to SELL pair1 and BUY Pair2 when square wave indicates +1 then it is very great opportunity to BUY pair1 and SELL Pair2 the inputs are : 2 pairs of symbols         then index value : i use 20 for M30 charts ( you can try other values : 40/50 for M15 , : 30 for M30 , : 10 for H1 ,
Trendiness Index
Libertas LLC
5 (3)
"The trend is your friend" is one of the best known sayings in investing, because capturing large trendy price movements can be extremely profitable. However, trading with the trend is often easier said than done, because many indicators are based on price reversals not trends. These aren't very effective at identifying trendy periods, or predicting whether trends will continue. We developed the Trendiness Index to help address this problem by indicating the strength and direction of price trend
Современный индикатор паттернов PPR по торговой стратегии RAIT. Работает по тренду и без него. Имеет настройки таймфрейма для отображения. Можно настроить количество баров для отображения индикатора на графике. Используется несколько паттернов PPR. Индикатор предпочтительно использовать на часовом таймфрейме и выше, но работает и ниже . Паттерны:  PPR, PinPPR, OutPPR. Отображаются одной стрелкой.
The indicator places Semaphore points on the maximum and minimum of a higher, medium and lower period. It includes A,B,C Triangles for easier spotting of reversal chart pattern which occurs very frequently and has a very high success ratio. Both Semaphore and A,B,C Triangles have Alerts and Push notifications to a mobile device when they occur on the chart. These indicators are very useful for breakout trading and spotting support/resistance levels which gives good opportunities for positions.
Fractals AM
Andriy Matviyevs'kyy
Classic indicator. The Fractals indicator analyzes the price patterns that form on the candlestick chart and display the reversal points of the market trend. The indicator consists of candles, the middle of which is either the highest (up fractal) or the lowest (down fractal). Highs and lows, indicated by the indicator on the chart, are recommended to be taken as points that form support and resistance lines. Unlike the original indicator, where fractals are formed by five candles (high/low in t
FREE
Trend Ray
Andriy Sydoruk
The indicator shows the potential trend direction by cyclical-wave dependence. Thus, all the rays of the intersection will be optimal rays, in the direction of which the price is expected to move, taking into account the indicator period. Rays can be used as a direction for potential market movement. But we must not forget that the approach must be comprehensive, the indicator signals require additional information to enter the market.
The BuySellAlert arrow indicator is developed based on the use of HMA, Laguerre, CCI, and ATR . The BuySellAlert arrow indicator: generates  entry points  for BUY and SELL  displays current profit ; displays  current spread. The profitability of the indicator is shown in the screenshot on the example of the GBPUSD pair Does not redraw and works on opening bar. Time frames - M1-M30. Recommended Time frames M5-M15. Setting ALARM - enable/disable the alarm; Push    - enable/disable Push notificatio
Fulltrend
Thomas Bradley Butler
Improve trading with this indicator.  Find areas of buys or sells in Fibonacci retracement areas.  Fulltrend is for scalping and making swing trades.  Fib levels are added for take profits and stop losses. This works on any time frame and can be used by itself or together with other systems and indicators for filters. The indicator doesn't repaint.  Alerts are added and can be true or false.  No need to sit glued to the computer, just set on charts and listen or the alerts to come.  Take a pos
Noize Absorption Index MT4
Ekaterina Saltykova
5 (1)
Noize Absorption Index - is the manual trading system that measures the difference of pressure between bears forces and bulls forces. Green line - is a noize free index that showing curent situation. Zero value of index shows totally choppy/flat market.Values above zero level shows how powerfull bullish wave is and values below zero measures bearish forces.Up arrow appears on bearish market when it's ready to reverse, dn arrow appears on weak bullish market, as a result of reverse expectation. S
This indicator monitors the market for a flat state and possible breakout. The flat state is detected as a predefined number of consecutive bars during which price fluctuates inside a small range. If one of the next bars closes outside the range, breakout is signaled. The indicator shows 3 lines: blue - upper bound of flat ranges AND consecutive breakout areas; red - lower bound of flat ranges AND consecutive breakout areas; yellow - center of flat ranges (NOT including breakout areas). When a b
The indicator is designed to detect breakouts of the Bill Williams fractal level on the instrument chart in the MetaTrader 4. After installing the indicator on the instrument chart, when a breakdown of the Bill Williams fractal level occurs, the signal bar (candle) is marked with a colored pointer (arrow) in the direction of the breakdown. For greater clarity, you can add a standard indicator "Bill Williams Fractal" to the chart of the instrument. When adding the indicator to the instrume
The principle of this indicator is very simple: detecting the trend with Moving Average, then monitoring the return point of graph by using the crossing of Stochastic Oscillator and finally predicting BUY and SELL signal with arrows, alerts and notifications. The parameters are fixed and automatically calculated on each time frame. Example: If you install indicator on EURUSD, timeframe M5: the indicator will detect the main trend with the Moving Average on this timeframe (for example the Moving
A machine translation from the English product description was used. We apologize for possible imprecisions. Une traduction automatique de la description du produit en anglais a été utilisée. Nous nous excusons pour les éventuelles imprécisions. Un système de visualisation des modèles d'action des prix des chandeliers préférés. Une fois attaché, l'indicateur marquera automatiquement les modèles suivants sur le graphique : Barre Pinocchio  - une barre de petit corps avec un long «nez», motif inve
Trend Bilio - an arrow indicator without redrawing shows potential market entry points in the form of arrows of the corresponding color: upward red arrows suggest opening a buy, green down arrows - selling. The entrance is supposed to be at the next bar after the pointer. The arrow indicator Trend Bilio visually "unloads" the price chart and saves time for analysis: no signal - no deal, if an opposite signal appears, then the current deal should be closed. It is Trend Bilio that is considered
This indicator finds technical analysis reversal patterns such as Double Bottom, Triple Bottom, Head & Shoulders and their opposite counterparts. The indicator shows them on the chart of a currency pair and can signal a trader if a pattern has been formed recently. This allows you to quickly detect a possible trend reversal or correction, it is enough to add an indicator to the chart, after that, you can change different timeframes to quickly find such patterns, if the patterns are not located
Cosmic Diviner X Planet
Olena Kondratenko
4 (2)
This unique multi-currency strategy simultaneously determines the strength of trends and market entry points, visualizing this using histograms on the chart. The indicator is optimally adapted for trading on the timeframes М5, М15, М30, Н1. For the convenience of users, the indicator renders the entry point (in the form of an arrow), recommended take profit levels (TP1, TP2 with text labels) and the recommended Stop Loss level. The take profit levels (TP1, TP2) are automatically calculated for
Gold Phoenix
Yaroslav Varankin
The perfect tool for Scalng in the Forex markets You can trade both from signal to signal and using take profit  The algorithm does not use Zigzag!  No redrawing!  This is a channel instrument that uses a moving average as a filter. Moving Average  There are 2 parameters for the settings Ma Period = 5 period Moving Average  Channel 1.0 distance of channel lines from the chart Price Signal Filter - calculation of signal opening and filter There is a complete set of Alert There is a multi-timefram
Smoking
Nadiya Mirosh
I suggest that everyone who is interested in the Smoking indicator try to trade. Smoking is a technical analysis tool that uses mathematical calculations to determine various aspects of price movement and is based on historical data. Smoking reveals special aspects of price movement and allows traders to make the right decision. All trading indicators analyze the price from different angles based on historical data. Therefore, it is not entirely correct to say that they can predict the future
RenkoMaStoch
Sergey Deev
1 (1)
The indicator displays renko bars on a chart, uses them to plot the fast and slow moving average and Stochastic, as well as it provides buy/sell signals: a buy signal is generated when the fast moving is above the slow one, and the signal line of Stochastic crosses the lower level from bottom up; a sell signal is generated when the fast moving is below the slow one, and the signal line of Stochastic crosses the upper level from top to bottom; Renko is a non-trivial price display method. Instead
Les acheteurs de ce produit ont également acheté
Gann Made Easy
Oleg Rodin
4.92 (62)
Gann Made Easy est un système de trading Forex professionnel et facile à utiliser qui est basé sur les meilleurs principes de trading en utilisant la théorie de mr. WD Gann. L'indicateur fournit des signaux d'ACHAT et de VENTE précis, y compris les niveaux Stop Loss et Take Profit. Vous pouvez échanger même en déplacement en utilisant les notifications PUSH. S'il vous plaît contactez-moi après l'achat! Je partagerai avec vous mes astuces de trading et d'excellents indicateurs bonus gratuitement!
ACTUELLEMENT 26% DE RÉDUCTION La meilleure solution pour tout débutant ou trader expert ! Cet indicateur est un outil de trading unique, de haute qualité et abordable car nous avons incorporé un certain nombre de caractéristiques exclusives et une nouvelle formule. Avec seulement UN graphique, vous pouvez lire la force de la devise pour 28 paires Forex ! Imaginez comment votre trading va s'améliorer parce que vous êtes capable de repérer le point de déclenchement exact d'une nouvelle tendan
Atomic Analyst
Issam Kassas
5 (3)
Tout d'abord, il convient de souligner que cet indicateur de trading n'est ni repainting, ni redrawing et ne présente aucun délai, ce qui le rend idéal à la fois pour le trading manuel et automatisé. Manuel de l'utilisateur : réglages, entrées et stratégie. L'Analyste Atomique est un indicateur d'action sur les prix PA qui utilise la force et le momentum du prix pour trouver un meilleur avantage sur le marché. Équipé de filtres avancés qui aident à éliminer les bruits et les faux signaux, et à
TPSproTREND PrO
Roman Podpora
5 (15)
TPSpro TRENDPRO  - is a trend indicator that automatically analyzes the market and provides information about the trend and each of its changes, as well as giving signals for entering trades without redrawing! The indicator uses each candle, analyzing them separately. referring to different impulses - up or down impulse. Exact entry points into transactions for currencies, crypto, metals, stocks, indices!  -  Version MT5               DETAILED DESCRIPTION        /       TRADING SETUPS           
Advanced Supply Demand
Bernhard Schweigert
4.92 (310)
CURRENTLY 26% OFF !! Best Solution for any Newbie or Expert Trader! This indicator is a unique, high quality and affordable trading tool because we have incorporated a number of proprietary features and a new formula. With this update, you will be able to show double timeframe zones. You will not only be able to show a higher TF but to show both, the chart TF, PLUS the higher TF: SHOWING NESTED ZONES. All Supply Demand traders will love it. :) Important Information Revealed Maximize the potenti
TPSpro RFI Levels
Roman Podpora
5 (13)
A key element in trading is zones or levels from which decisions to buy or sell a trading instrument are made. Despite attempts by major players to conceal their presence in the market, they inevitably leave traces. Our task was to learn how to identify these traces and interpret them correctly. Reversal First Impulse levels (RFI)   -  Version MT5                INSTRUCTIONS                 RUS                 ENG                                       R ecommended to use with an indicator   -  
Présentation de l'indicateur astronomique pour MT4 : Votre compagnon de trading céleste ultime Êtes-vous prêt à élever votre expérience de trading à des hauteurs célestes ? Ne cherchez pas plus loin que notre indicateur astronomique révolutionnaire pour MT4. Cet outil innovant transcende les indicateurs de trading traditionnels en exploitant des algorithmes complexes pour vous fournir des aperçus astronomiques inégalés et des calculs de précision. Un univers d'informations à portée de main : Con
Découvrez le secret pour réussir le trading Forex avec notre indicateur MT4 personnalisé! Vous êtes-vous déjà demandé comment réussir sur le marché du Forex, gagnant régulièrement des bénéfices tout en minimisant les risques? Voici la réponse que vous avez recherchée! Permettez-nous d'introduire notre indicateur MT4 propriétaire qui révolutionnera votre approche du trading. Polyvalence unique Notre indicateur est spécialement conçu pour les utilisateurs qui préfèrent les formations de bou
Présentation       Quantum Trend Sniper Indicator   , l'indicateur révolutionnaire MQL5 qui transforme la façon dont vous identifiez et négociez les inversions de tendance ! Développé par une équipe de traders expérimentés avec une expérience commerciale de plus de 13 ans,       Indicateur Quantum Trend Sniper       est conçu pour propulser votre parcours de trading vers de nouveaux sommets grâce à sa manière innovante d'identifier les inversions de tendance avec une précision extrêmement élevée
Break and Retest
Mohamed Hassan
4.56 (9)
‍You can visually backtest Break & Retest to see how it behaved in the past!     Manual guide:   Click here $65  for only 1  copy left! Next price is $120 .  This Indicator only places quality trades when the market is really in your favor with a clear break and retest. Patience is key with this price action strategy! Recommended timeframes: M1 for Scalpers.  M15 for Intraday traders. H1 & H4 for Day traders. Other timeframes are also excellent! After many months of hard w
Nous vous présentons ON Trade Waves Patterns Harmonic Elliot Wolfe, un indicateur avancé conçu pour détecter divers types de schémas sur le marché à l'aide de méthodes manuelles et automatiques. Voici comment il fonctionne : Schémas Harmoniques : Cet indicateur peut identifier les schémas harmoniques qui apparaissent sur votre graphique. Ces schémas sont essentiels pour les traders qui pratiquent la théorie du trading harmonique, telle qu'elle est décrite dans le livre de Scott Carney "Harmonic
Trend Screener
STE S.S.COMPANY
4.83 (88)
Indicateur de tendance, solution unique révolutionnaire pour le trading et le filtrage des tendances avec toutes les fonctionnalités de tendance importantes intégrées dans un seul outil ! Il s'agit d'un indicateur multi-période et multi-devises 100 % non repeint qui peut être utilisé sur tous les symboles/instruments : forex, matières premières, crypto-monnaies, indices et actions. Trend Screener est un indicateur de suivi de tendance efficace qui fournit des signaux de tendance fléchés avec des
74% discount for the next 10 buyers (original price $605): 2 left 3 Indicators in 1 indicator Strategy based on price action Made specifically for the best forex currency pairs Can be used in the best time frame of the market at a very reasonable price This indicator is basically 3 different indicatos . But we have combined these 3 indicators in 1 indicator so that you can use 3 indicators at the lowest price. All three strategies are based on price action. But based on different trends.
Currency Strength Wizard est un indicateur très puissant qui vous offre une solution tout-en-un pour un trading réussi. L'indicateur calcule la puissance de telle ou telle paire de devises en utilisant les données de toutes les devises sur plusieurs périodes. Ces données sont représentées sous la forme d'un indice de devise facile à utiliser et de lignes électriques de devise que vous pouvez utiliser pour voir la puissance de telle ou telle devise. Tout ce dont vous avez besoin est d'attacher l'
on free demo press zoom out button to see back.. cnt number is bar numbers.you can change up to 3000 related to chart bars numbers. minimum value is 500. there is g value set to 1.01. no need to change it. this indicator almost grail,no repaint and all pairs ,all timeframe indicator. there is red and blue histograms. if gold x sign comes on red histogram that is sell signal. if blue x sign comes on blue histogram that is buy signal. this indicator on thise version works all pairs.al timeframes
FX Power MT4 NG
Daniel Stein
5 (9)
Obtenez votre mise à jour quotidienne du marché avec des détails et des captures d'écran via notre Morning Briefing ici sur mql5 et sur Telegram ! FX Power MT4 NG est la nouvelle génération de notre très populaire indicateur de force des devises, FX Power. Et qu'est-ce que ce compteur de force de nouvelle génération offre ? Tout ce que vous avez aimé de l'original FX Power PLUS Analyse de la force de l'OR/XAU Des résultats de calcul encore plus précis Périodes d'analyse configurables individuel
Tout d'abord, il convient de souligner que cet outil de trading est un indicateur non repeint, non redessiné et non retardé, ce qui le rend idéal pour le trading professionnel. Cours en ligne, manuel utilisateur et démonstration. L'indicateur Smart Price Action Concepts est un outil très puissant à la fois pour les nouveaux et les traders expérimentés. Il regroupe plus de 20 indicateurs utiles en un seul, combinant des idées de trading avancées telles que l'analyse du trader Inner Circle et les
Scalper Vault
Oleg Rodin
5 (28)
Scalper Vault est un système de scalpage professionnel qui vous fournit tout ce dont vous avez besoin pour un scalpage réussi. Cet indicateur est un système de trading complet qui peut être utilisé par les traders de forex et d'options binaires. Le délai recommandé est M5. Le système vous fournit des signaux fléchés précis dans le sens de la tendance. Il vous fournit également des signaux supérieurs et inférieurs et des niveaux de marché Gann. Les indicateurs fournissent tous les types d'alertes
ACTUELLEMENT 31% DE RÉDUCTION ! ! La meilleure solution pour tout débutant ou Expert Trader ! Cet indicateur est un outil de trading unique, de haute qualité et abordable car nous avons incorporé un certain nombre de caractéristiques exclusives et une formule secrète. Avec seulement UN graphique, il donne des alertes pour les 28 paires de devises. Imaginez comment votre trading s'améliorera parce que vous serez capable de repérer le point de déclenchement exact d'une nouvelle tendance ou d'
Shepherd Harmonic Pattern
Abdullah Alrai
4.68 (59)
Cet indicateur détectera des motifs harmoniques dessinés sur le graphique par des méthodes manuelles et automatiques. Vous pouvez consulter le manuel d'utilisateur à partir de ce lien: Ajoutez votre avis et contactez-nous pour l'obtenir. Il existe une version gratuite pour essayer ce produit sur MT4. Vous pouvez l'utiliser pour détecter les motifs Gartley et Nenstar: https://www.mql5.com/en/market/product/30181 Vous pouvez acheter la version complète de MT4 à partir de: https://www.mql5.com/en/m
Le profit de la structure du marché change à mesure que le prix s'inverse et recule. L'indicateur d'alerte d'inversion de la structure du marché identifie le moment où une tendance ou un mouvement de prix approche de l'épuisement et est prêt à s'inverser. Il vous avertit des changements dans la structure du marché qui se produisent généralement lorsqu'un renversement ou un recul majeur est sur le point de se produire. L'indicateur identifie initialement les cassures et la dynamique des prix,
Le système PRO Renko est un système de trading très précis spécialement conçu pour le trading de graphiques RENKO. Il s'agit d'un système universel qui peut être appliqué à divers instruments de négociation. Le système neutralise efficacement ce qu'on appelle le bruit du marché en vous donnant accès à des signaux d'inversion précis. L'indicateur est très facile à utiliser et n'a qu'un seul paramètre responsable de la génération du signal. Vous pouvez facilement adapter l'outil à n'importe q
Actuellement 20% de réduction ! La meilleure solution pour tout débutant ou trader expert ! Ce logiciel de tableau de bord fonctionne sur 28 paires de devises. Il est basé sur 2 de nos principaux indicateurs (Advanced Currency Strength 28 et Advanced Currency Impulse). Il donne un excellent aperçu de l'ensemble du marché Forex. Il montre les valeurs de l'Advanced Currency Strength, la vitesse de mouvement des devises et les signaux pour 28 paires de devises dans tous les (9) délais. Imagine
Symbols must be separated by commas (,) and entered into the parameters exactly as displayed by your broker to ensure they are recognized in the dashboard. These symbols will be used for analysis by the indicator. With one click open any pair any timeframe directly from dashboard The MA Speedometer Dashboard is a highly functional MetaTrader 4 (MT4) indicator designed to enhance trading strategies through dynamic market analysis. It offers robust features for identifying market trends, trading
TrendMaestro
Stefano Frisetti
5 (2)
note: this indicator is for METATRADER4, if you want the version for METATRADER5 this is the link:  https://www.mql5.com/it/market/product/108106 TRENDMAESTRO ver 2.4 TRENDMAESTRO recognizes a new TREND in the bud, he never makes mistakes. The certainty of identifying a new TREND is priceless. DESCRIPTION TRENDMAESTRO identifies a new TREND in the bud, this indicator examines the volatility, volumes and momentum to identify the moment in which there is an explosion of one or more of these data a
Entry Points Pro
Yury Orlov
4.7 (225)
Indicateur supérieur pour MT4 fournissant des signaux précis pour entrer dans un trade sans repeindre ! Il peut être appliqué à tous les actifs financiers : forex, cryptocurrencies, métaux, actions, indices.  La version MT5 est ici Il fournira des signaux de trading assez précis et vous dira quand il est préférable d'ouvrir un trade et de le fermer. Regardez la vidéo (6:22) avec un exemple de traitement d'un seul signal qui a rapporté à l'indicateur ! La plupart des traders améliorent l
IX Power MT4
Daniel Stein
5 (5)
IX Power apporte enfin la précision imbattable de FX Power aux symboles non-Forex. Il détermine avec précision l'intensité des tendances à court, moyen et long terme de vos indices, actions, matières premières, ETF et même crypto-monnaies préférés. Vous pouvez analyser tout ce que votre terminal a à offrir. Essayez-le et découvrez comment votre timing s'améliore considérablement lors de vos transactions. Caractéristiques principales d'IX Power Résultats de calcul précis à 100 %, sans ré
The 1 2 3 Pattern Scanner
Reza Aghajanpour
4.79 (56)
** All Symbols x All Timeframes scan just by pressing scanner button ** After 17 years of experience in the markets and 3 years of programming, Winner indicator is ready. I would like to share with you! *** Contact me after purchase to send you instructions and add you in "123 scanner group" for sharing or seeing experiences with other users. Introduction The 123 Pattern Scanner indicator with a special enhanced algorithm is a very repetitive common pattern finder with a high success rate . Inte
Trend Forecasting
Mohamed Hassan
5 (20)
Cet indicateur est très puissant lorsqu'il est combiné avec notre autre indicateur appelé Katana. Après l'achat, envoyez-nous un message et vous pourrez obtenir Katana GRATUITEMENT en BONUS  ! Le prix augmentera bientôt à 149$ ! Ne manquez pas le prix courant à 65$ ! L'indicateur de prévision de tendance est un outil très unique et simple qui est capable de prédire les mouvements futurs des prix en fonction des signaux générés par MACD. Cela vous aide à avoir une estimation des domaines dans
Up down v6T
Guner Koca
5 (1)
Thise indicator is up down v6  comes with tradingwiev pinescript. purchased people, after installed on terminal ,contact me on mql5  to get BONUS  TradingView pinescript. up-down indicator is no repaint and works all pairs and lower than weekly time frames charts. it is suitable also 1 m charts for all pairs. and hold long way to signal. dont gives too many signals. when red histogram cross trigger line that is up signal.and price probably will down when blue histogram cross trigger line that
Plus de l'auteur
HFTHackerMT5
Thomas Bradley Butler
5 (1)
Signal : lien HFT Hacker sur mon profil *OPTIMISEZ EA AVANT LE TEST ET L'UTILISATION. ACHETEZ UNIQUEMENT SI VOUS AVEZ OPTIMISÉ. Ceci s'adresse aux traders qui savent optimiser et veulent être rentables selon leurs propres mérites. VOUS DÉFINISSEZ VOS PARAMÈTRES DE RISQUE. Taux de victoire élevé avec des arrêts pour les transactions qui ne fonctionnent pas si vous le souhaitez. Réduisez les risques pour la longévité. Cela fonctionne sur tous les comptes et constitue un outil de gestion des risque
Pin Bar Scalper
Thomas Bradley Butler
OPTMIZE EA BEFORE BACKTEST AND USE. Pin Bar Scalper scalps pin bars and momentum on 5 minute charts on the EUR/USD.  Optimize the parameters to get the best  out of the EA.  Pin bars are popular candlesticks that show that the price has been taken over by the bulls or bears. The inputs are based around the size of the pin bars in %, which are 3 different ones.  Wicks and body are the calculations within the parameter.  Test file in comments for example only.  Trade the dates _
NeuroScalper
Thomas Bradley Butler
5 (2)
Mettre à jour! Des flèches ont été ajoutées aux niveaux 100 et 200. Cet indicateur est précis pour accéder aux extrêmes et prend en charge les positions d'achat principalement pour des périodes de 1 minute. D'autres délais peuvent être utilisés mais les niveaux sont différents. C'est un meilleur oscillateur et se compare avec d'autres pour voir la différence. Commerce de jour utilisant des concepts de réseau neuro. Cet indicateur utilise des formes élémentaires de réseaux neuro pour génére
Evolved Trends
Thomas Bradley Butler
OPTIMISER AVANT LE TEST ET L'UTILISER POUR TROUVER LES MEILLEURES ENTRÉES Salut les commerçants ! Vous voulez un conseiller expert de pointe pour votre plateforme MT4 ? Ne cherchez pas plus loin que les tendances évoluées ! Ce puissant algorithme de trading, créé avec la technologie d'apprentissage automatique, se concentre sur le trading du GBP/USD sur des périodes d'une heure. Mais bon, n'hésitez pas à expérimenter d'autres actifs et délais d'optimisation ! Personnalisez simplement les entr
VolumeDayTrader
Thomas Bradley Butler
DAYTRADING POUR LES ACTIONS (CFD) uniquement. Le commerce demande du travail. Il n'y a pas de raccourcis ou d'indicateurs qui vous indiqueront toutes les entrées et sorties. Le profit vient de l'état d'esprit. Les indicateurs sont des outils à utiliser conjointement avec la gestion de l'argent et la psychologie du succès. Trouvez les déséquilibres dans le profil de volume. Déséquilibres du volume des prix commerciaux. De nombreux déséquilibres se produisent à la clôture et à l'ouverture et
Crypto Net
Thomas Bradley Butler
Les heures de courtage seront différentes de celles dans lesquelles la stratégie a été intégrée. Crypto Net est destiné au trading de BTCUSD. Il utilise l'évolution génétique pour faire évoluer la stratégie. Cette tendance des métiers EA suit les indicateurs se trouvent ATR et Ichimoku. Cela a été construit et a passé une série de tests robustes, y compris Monte Carlo et Walk Forward. Contributions: Pourcentage du compte correspondant au risque minimum. Nombre maximum de lots Temps
Bitcoin M5
Thomas Bradley Butler
OPTIMIZE EA BEFORE TEST AND USE. Bitcoin M5 is for trading BTC/USD on 5 min charts.  SL and TP should Start with 50000.  OPTIMIZE BEFORE USE The trading strategy uses Bollinger Bands and Envelopes indicators to trade from.  Trading to catch some breakout points of where the price breaches the bands and then exiting when the price crosses the envelopes.  Every trade uses a fixed lot amount and has a SL and TP.  The EA does not use martingale or hedging in the logic.
ForexReversal
Thomas Bradley Butler
4 (1)
La patience est la clé d'un scalping sans stress. Échangez les flèches lorsque vous voyez qu'elles dépassent la moyenne mobile de 200 et créez une tendance en s'élargissant ou à partir du dernier point d'oscillation sans filtre de moyenne mobile. Agréable pour les tranches de temps de 1 minute, capturant les mouvements intrajournaliers dynamiques. Prenez facilement 20 pips ou restez plus longtemps pour des tendances plus importantes, en utilisant des arrêts suiveurs. Regardez les exemples sur l
Level 2 Trading
Thomas Bradley Butler
COMBINEZ AVEC SMART VOLUME TRACKER : https://www.mql5.com/en/market/product/116650 COMBINEZ AVEC LE TABLEAU D'EMPREINTE : https://www.mql5.com/en/market/product/94153 COMBINEZ AVEC LE COMMERCE DANS LA ZONE : https://www.mql5.com/en/market/product/110194 COMBINEZ AVEC VOLUM DAY TRADER : h https://www.mql5.com/en/market/product/72498 COMBINER AVEC LE CARNET DE COMMANDES : https://www.mql5.com/en/market/product/102247 Le trading de niveau 2 est un indicateur qui vous aide à visualiser le
GoldBuyBackScalper
Thomas Bradley Butler
4 (1)
Cet indicateur est pour XAU/USD, graphiques de 1 minute seulement. Chaque paire a des caractéristiques et des mouvements de prix uniques. Négociez des inversions en forme de V avec cet indicateur. Le cuir chevelu achète en utilisant des arrêts suiveurs et évite les nouvelles car elles sont plus extrêmes et peuvent provoquer des ventes soudaines. Attachez-vous à une période de 1 minute dans le backtest et voyez les achats d'inversion. L'indicateur ne repeint jamais ou ne recalcule jamais.
TrueSupplyandDemand
Thomas Bradley Butler
This is based on short term strength or weakness and not on moving averages.  Moving averages are used for filter only. Trade supply and demand with arrows. Supply and demand breakouts and strength of the buyers or sellers .  Don't trade buy arrow to sell arrow.  Trade the strength with trendlines or moving averages and use stops.  The arrow can have some strong moves.  Trade on all time frames.  Try it out in the back tester. The pips can be made with this indicator, follow the arrows and mak
ScalpingMaster
Thomas Bradley Butler
Master scalping with this indicator.  Trade on any time frame for scalps on buy or sells.  Follow trends using a 200 moving average and stops and targets.  Use with your own system.  This indicator can give pips if following it correctly.  Stick to rules and pick up pips daily.  Use as entries in a trend, scalp for a few pips or exit on opposite signal.  Best to follow higher time frame trends. Indicator doesn't repaint or recalculate. Rules: Don't trade overnight, only trade during active sessi
DayTradeKing
Thomas Bradley Butler
This indicator is good for small time frames like 1 and 5 minutes and made for day trading. The indicator never repaints or recalculates. The indicator works is for trading swing points in day trading, following bulls or bears.  Its a simple to use, non cluttered indicator with a high success rate.  This indicator works well to capture ranges.  All indicators come with limitations and no indicator or system is always accurate. Use money management for long term trading success.   Place in backte
DTKGold
Thomas Bradley Butler
This is the DayTradeKing for gold on a 1 minute time frame.  It is a different calculation for the range. Use a 200 period moving average as a filter.  Always use stops and avoid news, wait for more conformation.  This looks to capture intraday ranges. Put it in the back tester on 1 minute to see the price action and how it works. Trade with trend Use filter Use stops Alerts are added for pop ups and sound. 
SuperArrowScalper
Thomas Bradley Butler
Trade trends with the Super Scalper Use on all time frames and assets it is  designed for scalping trends. Works good on small time frames for day trading.  The arrows are easy to follow.  This is a simple no repaint/no recalculate arrow indicator to follow trends with.  Use in conjunction with your own system or use moving averages.  Always use stops just below or above the last swing point or your own money management system The indicator comes with push notifications, sound alerts and email
Levels Trading
Thomas Bradley Butler
This indicator is a simple stripped down version of any advanced support and resistance indicator.  All the support and resistance indicators work from a number of bars that have developed over time. Get rid of clutter and confusing levels.  Find levels according to a number of bars. Look at days, session, numbers of hours, periods of consolidation.  Watch levels develop and use as breakout points, or areas of buyers and sellers.  Features and things to consider This indicator is for a frame of
ForexReversalEA
Thomas Bradley Butler
Cet EA est basé sur l'indicateur Forex Reversal. Si vous préférez échanger manuellement le système, téléchargez l'indicateur et essayez-le. https://www.mql5.com/en/market/product/57345 L'EA suivra la tendance et ouvrira des postes en conséquence. Les résultats montrent des gains stables avec un tirage inférieur, mais expérimentez-les dans le testeur arrière, l'optimiseur et les délais pour voir ce qui fonctionne. Tous les résultats présentés sont hypothétiques. Remarque : Il ne s'agit pas d
HFTHacker
Thomas Bradley Butler
Signal : lien HFT Hacker sur mon profil *OPTIMISEZ EA AVANT LE TEST ET L'UTILISATION. ACHETEZ UNIQUEMENT SI VOUS AVEZ OPTIMISÉ. Ceci s'adresse aux traders qui savent optimiser et veulent être rentables selon leurs propres mérites. VOUS DÉFINISSEZ VOS PARAMÈTRES DE RISQUE. Taux de victoire élevé avec des arrêts pour les transactions qui ne fonctionnent pas si vous le souhaitez. Réduisez les risques pour la longévité. Cela fonctionne sur tous les comptes et constitue un outil de gestion des risqu
MarketMaker
Thomas Bradley Butler
Automatisez le commerce de l'offre et de la demande. Faire un marché. Cet EA a été créé et inspiré par l'indicateur populaire d'offre et de demande que tout le monde vend et imite. L'EA continue de négocier et de se couvrir, créant un marché. Peut également être négocié sur des comptes non couverts. Il faut évaluer les risques et utiliser les délais, la taille des lots, les capacités de couverture. Je l'ai échangé pendant environ un mois au total et sur plusieurs paires à la fois. Conc
Top Trader
Thomas Bradley Butler
Top Trader Indicator This is an arrow reversal indicator. This is with deviations and arrows.  Trade a blue arrow for buy and trade a red arrow for sell.  Change the time period and the deviations of the bands.  This is similar to others but these arrows don't repaint.  Load in back tester and study which periods and deviations work the best.  It works on all time frames.  15 min to 1 hr would give good results for take profits.  Try according to your own risk management.
Quant Bot
Thomas Bradley Butler
Quant Bot est destiné au trading de tendance sur une période d'une heure pour l'EUR/USD. Il n'y a pas de fichier défini, mais si d'autres paires sont utilisées, une optimisation peut être nécessaire. À propos du robot: Il utilise la génération génétique et utilise l'ATR pour échanger. La période d'avance a été utilisée pour empêcher l'ajustement de la courbe L'EA utilise des arrêts sur chaque transaction. La gestion de l'argent est une mise à l'échelle avec % du solde La période de recul es
Golden Standard
Thomas Bradley Butler
POUR XAU/USD Il s'agit d'un système de trading stable qui utilise des générations aléatoires et un suivi des tendances. L'Expert a été rétro-testé avec des données de qualité, a complété une période d'optimisation avec une simulation de Monte Carlo pour éviter le surajustement sur des périodes d'une heure XAU/USD. Stop Loss et Take Profit sont utilisés. L'EA a plusieurs configurations et il n'y a rien d'autre à faire que de déterminer combien de lots échanger. Caractéristique: Utilise
PropTrader
Thomas Bradley Butler
*OPTIMISER EA AVANT UTILISATION* Stratégie de trading Forex optimisée pour l'EUR/USD Atteindre une richesse substantielle en un an ou deux avec un conseiller expert (EA) est une affirmation irréaliste. Le backtesting et le trading réel se concentrent sur la paire de devises EUR/USD. À propos de cette stratégie : Il s’agit de la première itération de notre stratégie, avec un potentiel d’avancées supplémentaires. Rigoureusement testé avec des données de qualité à 100 %, il est exempt d'err
Down Under
Thomas Bradley Butler
Down Under négocie la paire AUD/USD sur une période d'une heure. Cette EA négocie l'ATR et l'OHLC. Il est formaté pour cette paire sur cette période. La composition est utilisée avec un min. taille du lot et max. la taille du lot. Le pourcentage des soldes est composé sur les transactions gagnantes. Comme l'équilibre fluctue, la taille du lot fluctue également. Réglages: mm risque % lots mm lots maximum Il n'y a rien d'autre à changer. Cela n'a pas de capacité de martingale ou de couv
Cable Trader
Thomas Bradley Butler
GBP/USD 1hr. Cet EA échange élan et sessions. Cela a une composante de lot fixe et continuera de modifier le TP au fur et à mesure de son développement. Réglages: La taille du lot Il n'y a rien d'autre à changer. Cela n'a pas de capacité de martingale ou de couverture. La seule autre caractéristique à changer est si vous négociez, les CFD de GBP/USD. Changez cela par la décimale sur la plateforme du courtier. Avis de non-responsabilité Les contrats à terme, les options et le tr
Euclidean
Thomas Bradley Butler
Euclidean est un algorithme de trading unique que j'ai créé il y a 8 ans. Cette évaluation environnementale fait partie de ce système. Il fonctionne comme un système fermé. L'EA lancera un achat lorsque le degré d'angle est correct pour saisir une tendance. Le stop loss est à 10% de l'angle. C'est aussi simple que cela. Contributions: % du solde en lots 1 micro lot pour 1 000 $ Lots supérieurs de volume = le nombre maximum de lots Niveau de profit = la valeur par défaut est de 50 pips Comme
Pip Scalper
Thomas Bradley Butler
UN INDICATEUR POUR TOUS Pip Scalper est pour les tendances de scalping. Restez dans les tendances plus longtemps avec cet indicateur. Il fonctionne sur toutes les périodes et tous les actifs. Ramassez les pépins quotidiens avec cet outil. Utilisez la moyenne mobile de 200 pour filtrer les transactions. Délais plus courts recommandés. À utiliser pour le day trading. À propos et comment utiliser : Pips Scalper est basé sur le trading de tendance à plus long terme. Acheter sur bleu Vendre
Order Flow Trader
Thomas Bradley Butler
Just a simplified way of observing the volume.  It shows the buy flow against the sell flow.  See the volume coming in and trade with the money.  Visualize the trend rising or falling and trade according to the imbalance in volume.  Use for scalping and trend trading.  Trade by volume coming in. FOOTPRINT CHART:  https://www.mql5.com/en/market/product/94153 Order Book:  https://www.mql5.com/en/market/product/102247 EA Based:  https://www.mql5.com/en/market/product/82585 Note: Works in real
Combine Winner
Thomas Bradley Butler
Trade any Forex combine out there.  Many prop firms offer challenge or instant funding combines.  The biggest problem is controlling the loss.  With this indicator you can get a visual system that can limit loss and teach discipline.  This uses the MACD and the strategy is scalping.  You can determine the risk and reward.  Visually follow small trends for scalps.  Trade during active sessions.  It's just a simple system to instill discipline while limiting loss and scalping pips with the paramet
Holy Grail Arrow
Thomas Bradley Butler
Holy Grail arrow is for scalping.  The period you use will determine the trend.  You can try different time frames and periods to see what works best for your strategy.  Filters can be applied like a moving average or trendlines.  The 1 minute works good for scalps and always trade during active periods and avoid consolidation times.  Using other indicators to determine trends is recommended but this can also be a free flowing scalping system alone with tp and sl. Inputs: Period = trend period
Filtrer:
pitaleks21
14
pitaleks21 2024.04.13 16:52 
 

L'utilisateur n'a laissé aucun commentaire sur la note

Répondre à l'avis