• Aperçu
  • Avis
  • Commentaires
  • Nouveautés

Extremum levels

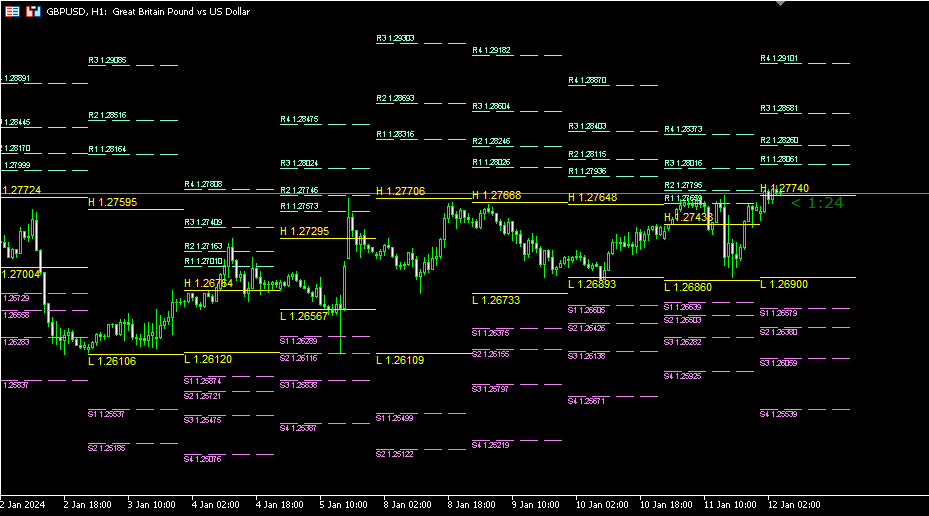
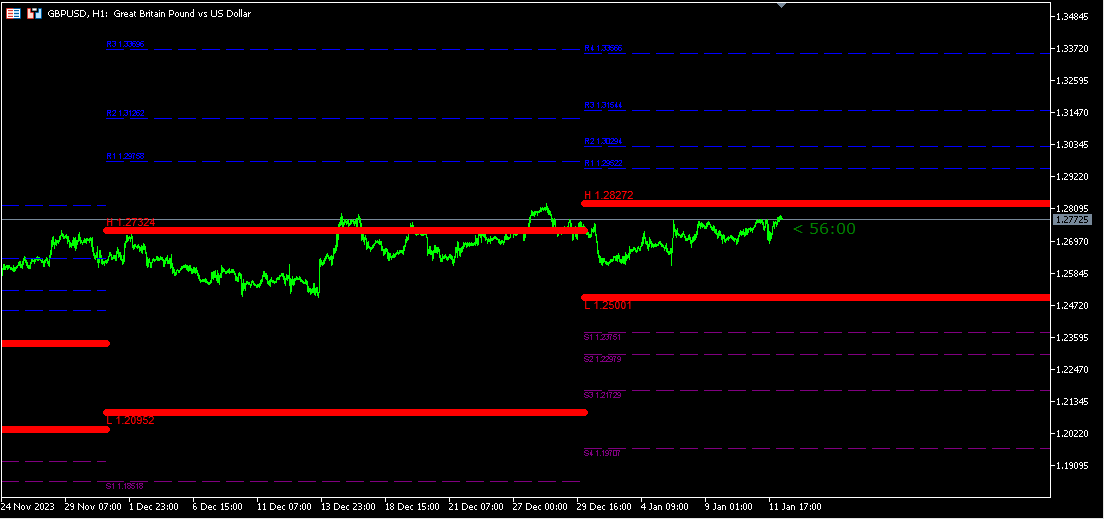
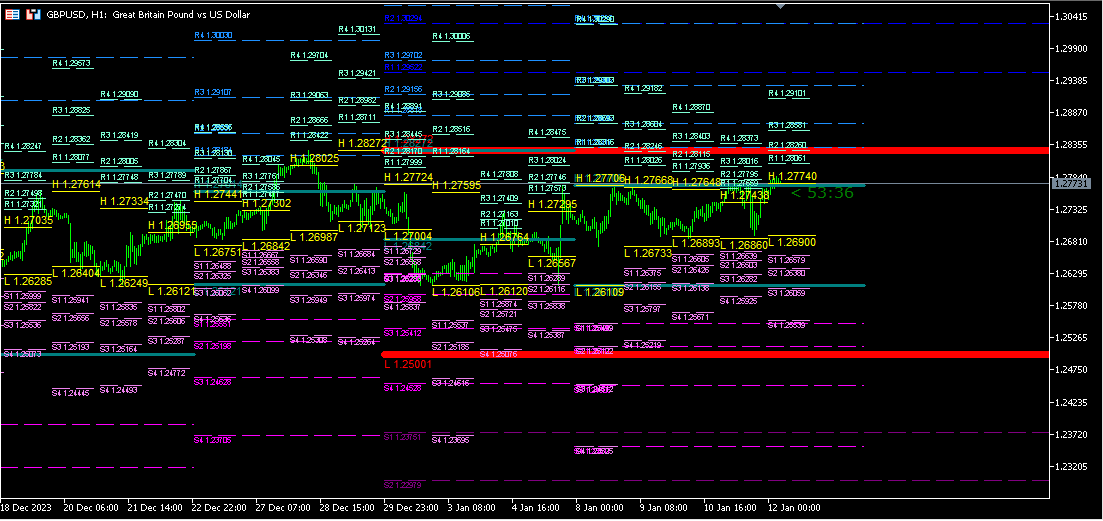
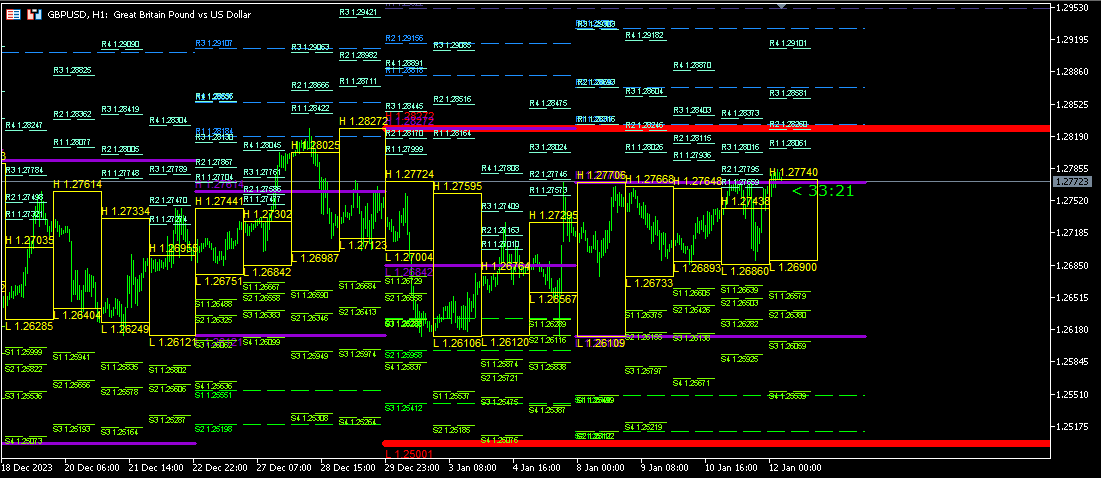
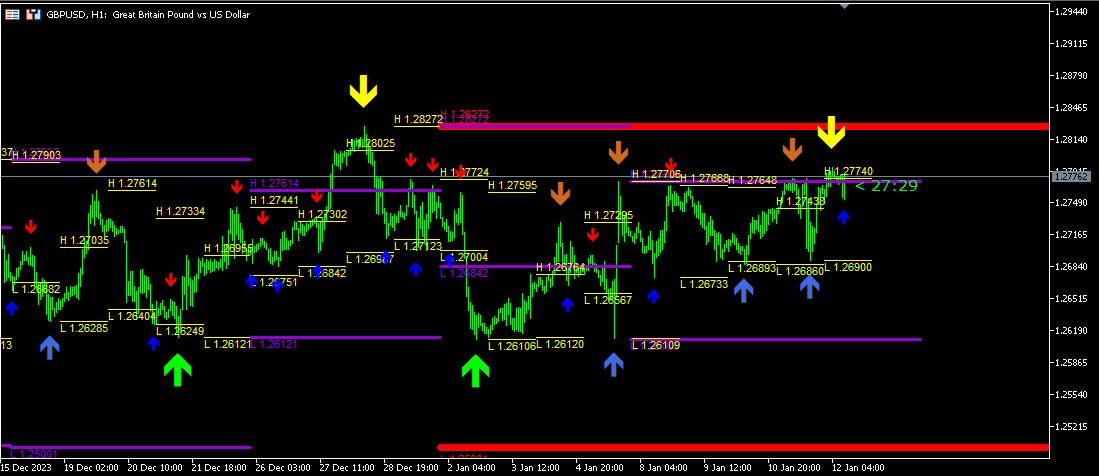
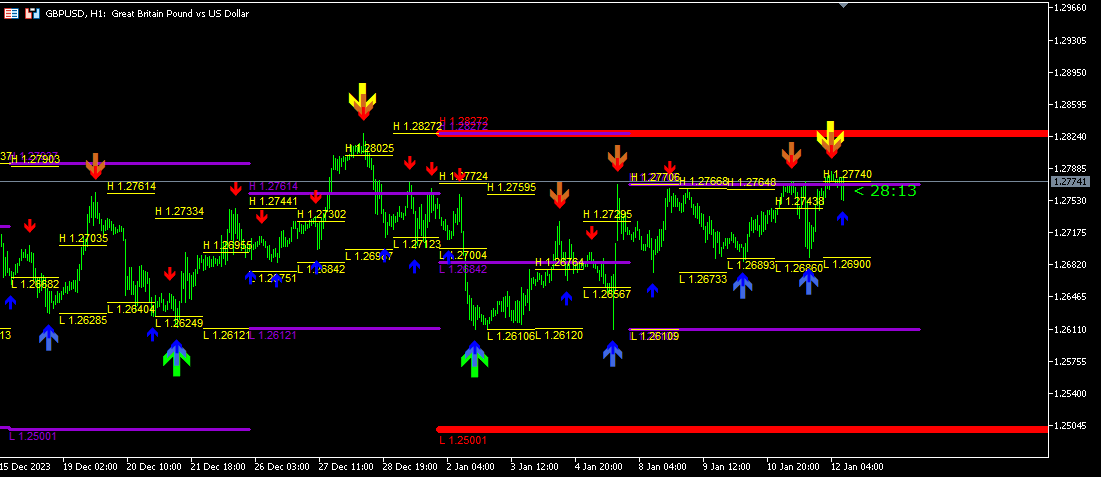
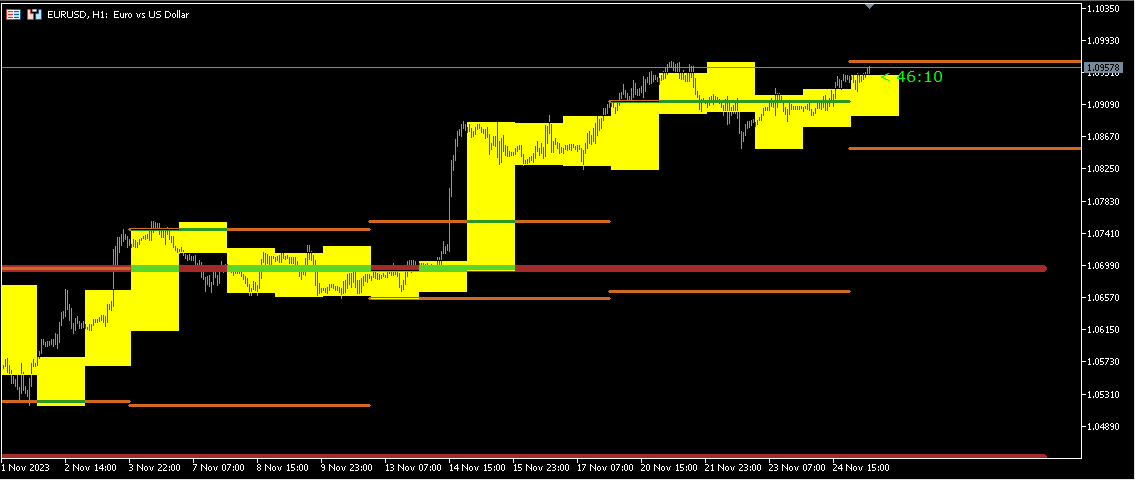
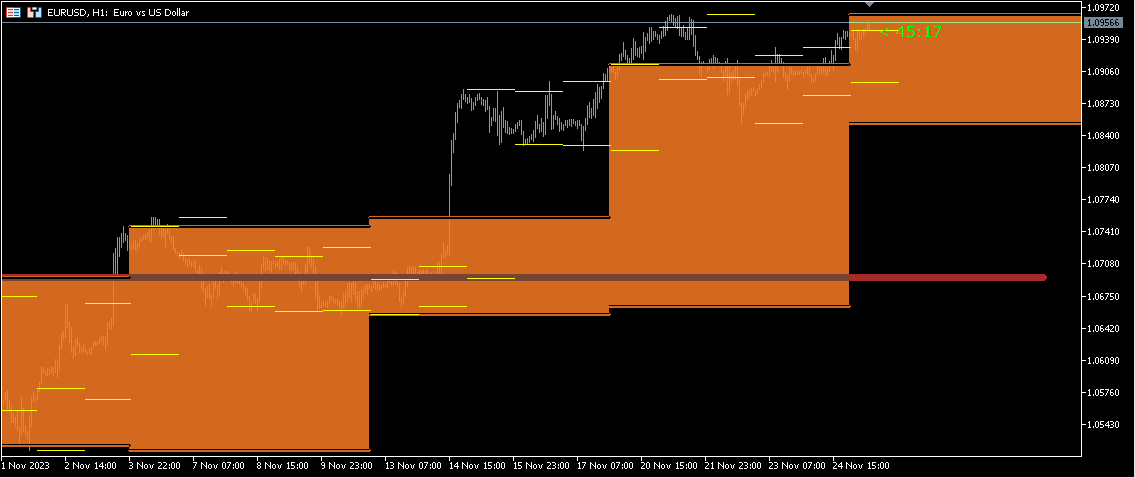
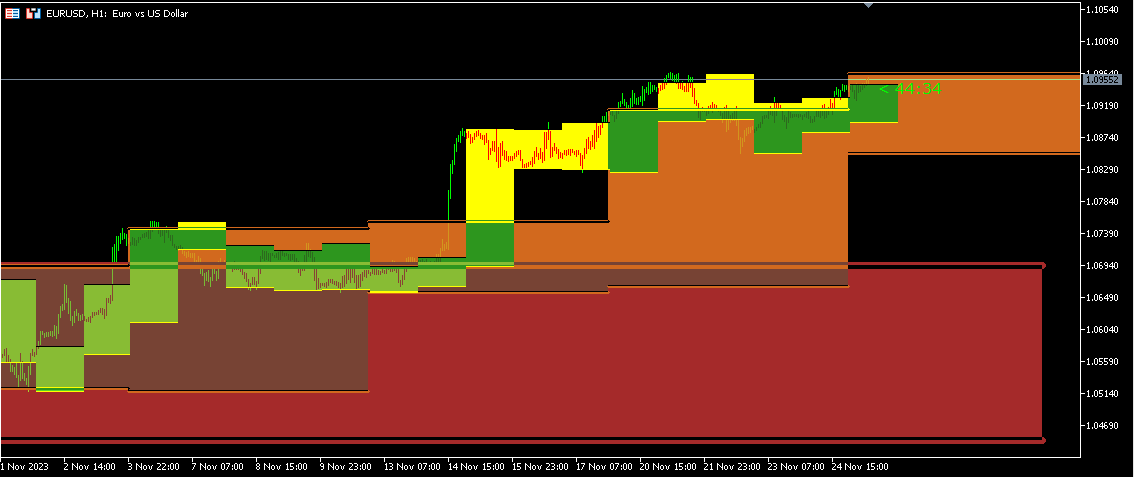
L'indicateur affiche les niveaux haut et bas du jour, de la semaine et du mois précédents. Conçu pour déterminer la cassure des points extrêmes et déterminer la direction d'entrée dans le trading. Pour déterminer plus précisément les niveaux d'inversion, vous pouvez afficher les niveaux de Fibonacci. Il est également possible de peindre l'espace entre High et Low pour afficher plus clairement les mouvements de prix pour la période de facturation précédente. Il y a une indication du temps jusqu'à ce que la bougie (barre) actuelle se ferme.

La version 2.0 a ajouté des signaux de 3 niveaux d'inversion en zigzag avec des alertes pour chaque niveau.
Produits recommandés
Introduction to Harmonic Volatility Indicator Harmonic Volatility Indicator is the first technical analysis applying the Fibonacci analysis to the financial volatility. Harmonic volatility indicator is another level of price action trading tool, which combines robust Fibonacci ratios (0.618, 0.382, etc.) with volatility. Originally, Harmonic Volatility Indicator was developed to overcome the limitation and the weakness of Gann’s Angle, also known as Gann’s Fan. We have demonstrated that Harmonic
The indicator for trading on the signals of the harmonic pattern AB=CD. It gives signals and shows the levels of entry into the market, as well as levels for placing stop orders, which allows the trader to make timely decisions on entering the market, as well as effectively manage positions and orders. It supports sending push notifications to a mobile device, e-mail, as well as alerts. This indicator has been ported from the version for MetaTrader 4. For more information, as well as a detailed
Harmonic Patterns Osw MT5
William Oswaldo Mayorga Urduy
MOTIFS HARMONIQUES OSW MT5 Cet indicateur est chargé de détecter les motifs harmoniques afin que vous puissiez les opérer, vous donnant un signal afin que vous puissiez ajouter une analyse manuelle si vous prenez la commande ou non. Parmi les motifs harmoniques détectés par l'indicateur figurent : >gartley > chauve-souris >Papillon > crabe >Requin Parmi les fonctions que vous pouvez trouver sont : >Générer des alertes par courrier, mobile et PC > Changez les couleurs des har
The indicator determines the state of the market: trend or flat. The state of the market is determined by taking into account volatility. The flat (trading corridor)is displayed in yellow. The green color shows the upward trend. The red color shows the downward trend. The height of the label corresponds to the volatility in the market. The indicator does not redraw . Settings History_Size   - the amount of history for calculation. Period_Candles  - the number of candles to calculate the
Introduction to X3 Chart Pattern Scanner X3 Cherart Pattern Scanner is the non-repainting and non-lagging indicator detecting X3 chart patterns including Harmonic pattern, Elliott Wave pattern, X3 patterns, and Japanese Candlestick patterns. Historical patterns match with signal patterns. Hence, you can readily develop the solid trading strategy in your chart. More importantly, this superb pattern scanner can detect the optimal pattern of its kind. In addition, you can switch on and off individu
Three Candles Pattern
Edson Cavalca Junior
5 (1)
The patterns of 3 (three) Candles: Three White Soldiers; Three Black Crows; These are reversal patterns widely used by traders, as they have a high probability of showing the inversion of the current market movement. For example, if in a bullish trend there are three black crows, there is a high probability of reversing the current bullish movement. The Three White Soldiers have the following characteristics: There are 3 consecutive candles with a good body, that is, the difference between
BS Time Band是一个很好的波段交易指示器,这个指标可以单独使用,但是最好是配合 StartPoint 一起使用效果更好,适用于任何时间框架,非常适合喜欢做波段交易的朋友。它能很好的体现出一个波段的完整信息,你可以很快的从这个指示器上寻找到最佳的预警区域,然后配合 StartPoint 找到最佳的buy位置和最佳的sell位置,也能很好根据指示器去坚守自己的持仓定订单。指标不含有未来函数,不会重新绘制,不仅能够应用到自己的手动交易过程中,还能完全可以写入到自己的EA中。(如果你感觉到这个指标能够帮助你进行更准确的交易,请帮忙给个好评,希望我的作品能够帮助更多有需要的人) =================参考使用方法=================== 此指标可以适用于任何交易品种。 做波段建议参数 timeFame:M5 如果配合 StartPoint 建议 StartPoint 的参数为(240,60)
Harmo EA
Matteo Schizzerotto
Avez-vous déjà souhaité disposer d'un assistant de trading capable de détecter automatiquement les modèles harmoniques lucratifs ? Nous sommes fiers de présenter notre Expert Advisor innovant basé sur des modèles harmoniques du monde du forex. TROUVEZ LES SIGNAUX EN DIRECT ICI : MARTINGALE  https://www.mql5.com/en/signals/ 2175074 FIX LOT  https://www.mql5.com/en/signals /2177470 Notre Expert Advisor est un logiciel sophistiqué alimenté par des algorithmes avancés, spécialement conçus pour
This indicator accurately identifies and informs market reversals and continuation patterns by analyzing and signaling the Three White Soldiers / Three Black Crows pattern. It also offers a  "real-time backtesting"  panel in the indicator itself in a way that every change made on the indicator parameters will immediately show the user how many signals are occurred, how many take profits and stop losses were hit and, by having these informations, the Win Rate and the Profit Factor of the setup b
The indicator determines a special pattern of Joe Dinapoli. It gives very high probability buy and sell signals. Indicator does not repaint. Indicator Usage Buy Signal ''B'' Entry : Market buy order at signal bar close Stop : Low of signal bar Take Profit : First swing high Sell Signal ''S'' Entry : Market sell order at signal bar close Stop : High of signal bar Take Profit : First swing low Indicator Parameters Fast EMA : External Parameter (should be kept as default) Slow EMA: External Param
The indicator scans for Dinapoli thrust pattern in multiple timeframes for a specific market. Key Features Indicator can be used for all markets It can scan for thrust pattern on W1, D1, H4, H1, M30, M15 and M5 timeframes Ability to choose number of bars required above/below displaced moving average to define thrust Able to move display label on chart by single click Parameters Minimum Bars: Least amount of bars to account for Thrust DMA Period: Moving average period DMA Shift: Number or bars re
Introduction to Fractal Pattern Scanner Fractal Indicator refers to the technical indicator that makes use of the fractal geometry found in the financial market. Fractal Pattern Scanner is the advanced Fractal Indicator that brings the latest trading technology after the extensive research and development work in the fractal geometry in the financial market. The most important feature in Fractal Pattern Scanner is the ability to measure the turning point probability as well as the trend probabil
This indicator will draw patterns based on   Rob Smith's   The Strat   as they emerge in real time on your chart. As price evolves,   TheStrat   offers 18 distinct price action patterns that can help you get good entries in the market. Each pattern involves two or three candles, and this indicator will draw a bounding box around the candles and name the pattern. The indicator also shows when a potential setup is forming, known by stratters as an Actionable signal. Candles Each candle is de
Matreshka
Dimitr Trifonov
5 (1)
Matreshka self-testing and self-optimizing indicator: 1. Is an interpretation of the Elliott Wave Analysis Theory. 2. Based on the principle of the indicator type ZigZag, and the waves are based on the principle of interpretation of the theory of DeMark. 3. Filters waves in length and height. 4. Draws up to six levels of ZigZag at the same time, tracking waves of different orders. 5. Marks Pulsed and Recoil Waves. 6. Draws arrows to open positions 7. Draws three channels. 8. Notes support and re
Descriptions A point point is a technical analysis indicator, or calculations, used to determine the overall trend of market over different time frames. This indicator calculate the highest or lowest pivots among left x and right y bars and show the high/low level during that period.   From that, you could clearly see the top resistance & bottom support level and how market goes break out. Instructions pivotLeft - pivot left bar count pivotRight - pivot right bar count pivotHighColor - c
INDICATEUR basé sur l'INTELLIGENCE ARTIFICIELLE qui génère d'éventuelles entrées d'achat et de vente pour les options binaires. l'indicateur fonctionne sur 3 stratégies différentes : 1) en lisant les volumes, il envoie un signal lorsque le prix doit s'inverser 2) à travers la divergence entre prix et volume, il envoie un signal lorsque la tendance doit se poursuivre ou s'inverser 3) grâce à la convergence entre le prix et le volume, il envoie un signal lorsque la tendance doit se poursu
The chart pattern is automatically drawn. It also automatically tells you the price at which you are most likely to buy or sell according to the pattern. Therefore, there is no need to memorize patterns or draw lines by yourself. * The "WhaleFinder" includes four indicators ("DrawTurningPoint", "DrawHurdle", "DrawChartPattern", "DrawFibonacci").  so, Please be careful not to purchase more than one copy (duplicates). We are live-streaming the actual operation of the system. Please check for
Scissors Pattern
Kambiz Shahriarynasab
Configure scaffolding charts and signals based on the scissor pattern, which works great at low times. Buy and sell signs based on 2 previous candle patterns It works on the active time form, and when detecting the pattern in 4 time frames, 5 minutes, 15 minutes, 30 minutes and one hour, the alert can be set to notify us of the formation of this pattern. MetaTrader version 4 click here How to use: When there is an opportunity to buy or sell, the marker places a scissors mark on
Fibonacci and RSI Demo version MQL5
Carlos Daniel Vazquez Rosas
4 (1)
Fibonacci and RSI. Demo versión only works with GBPUSD. For full version, please, visit visit https://www.mql5.com/en/market/product/52101 The indicator is a combination of the Fibonacci and RSI indicators. Every time the price touches one of the fibonacci levels and the rsi condition is met, an audible alert and a text alert are generated. Parameters number_of_candles : It is the number of candles that will be calculated. If you put 100, the indicator will give you the maximum and min
FREE
This indicator scans the 1-3 Trendline pattern . The indicator is a 100 % non repaint low risk breakout system . The patterns are formed around swing high and swing lows which make them a low risk pattern with high reward. PATTERN BACKGROUND The 1-3 Trendline Breakout pattern is formed by four(4) points which are composed of three (3) primary points and the pattern neck. A trendline is always formed by the point 1 and the neck of the pattern . When price breaks out of the trendline formed ,
My PVSR
Ashok Kumar Singha
My PVSR   is based on All Type of Pivot Points. Use this Indicator to get proper Support / Resistance Zone and Trade accordingly.. Recommendation: Use this Indicator along with my another Indicator --->>> Dr. Trend   <<<--- Click Here ; To get the best output result feel free to contact me ; Best of Luck It can be used for: All Pairs: Forex, Cryptocurrencies, Metals, Stocks, Indices etc. All Timeframe All Brokers All type of Trading Style like Scalping, Swing, Intraday, Short-Term, Lon
M & W Pattern Pro is an advanced scanner for M and W patters , it uses extra filters to ensure scanned patterns are profitable. The indicator can be used with all symbols and time frames. The indicator is a non repaint indicator with accurate statistics calculations. To use , simply scan the most profitable pair using the statistics dashboard accuracy , then enter trades on signal arrow and exit at the TP and SL levels. STATISTICS : Accuracy 1 : This is the percentage of the times price hit
This indicator is a perfect wave automatic analysis indicator for practical trading! 黄金实战 案例... The standardized definition of the band is no longer a wave of different people, and the art of man-made interference is eliminated, which plays a key role in strict analysis of the approach.=》Increase the choice of international style mode, (red fall green rise style) The  purchase discount is currently in progress! Index content: 1.Basic wave: First, we found the inflection point of the ba
Introduction to Fibonacci Volatility Indicator Volatility indicator can help you to detect any statistical advantage for your trading. Especially, if you are trading with Price Action and Price Patterns, then we recommend to use the Volatility indicator together with your strategy. Especically, Fibonacci Volatility indicator combines the market volatiltiy with Fibonacci Analysis to provide you more advanced volatiltiy indicator. Main Features Fibonacci Volatility in Z score Configuration Mode Fi
A useful scanner/dashboard that shows the RSI values for multiple symbols and Time-frames. It can be easily hidden/displayed with a simple click on the scanner man top left of the dashboard. You can input upper and lower RSI values and the colours can be set to show when above/below these values. The default values are 70 and 30. There are also input colours for when the RSI is above or below 50 (but not exceeding the upper/lower levels Symbols and time-frames are input separated by commas.
Seasonal Pattern Trader
Dominik Patrick Doser
Disclaimer : Keep in mind that seasonal patterns are not always reliable. Therefore, thoughtful risk management is crucial to minimize losses.  Seasonal patterns in the financial world are like a well-guarded secret that successful investors use to their advantage. These patterns are recurring price movements that occur during specific periods or around special events. Additionally, there are also intraday patterns that repeat. For example, Uncle Ted from Forex Family suggests examining previou
Introduction This indicator detects volume spread patterns for buy and sell opportunity. The patterns include demand and supply patterns. You might use each pattern for trading. However, these patterns are best used to detect the demand zone (=accumulation area) and supply zone (=distribution area). Demand pattern indicates generally potential buying opportunity. Supply pattern indicates generally potential selling opportunity. These are the underlying patterns rather than direct price action. T
The   ICT Unicorn Model   indicator highlights the presence of "unicorn" patterns on the user's chart which is derived from the lectures of   "The Inner Circle Trader" (ICT) . Detected patterns are followed by targets with a distance controlled by the user.   USAGE (image 2) At its core, the ICT Unicorn Model relies on two popular concepts, Fair Value Gaps and Breaker Blocks. This combination highlights a future area of support/resistance. A   Bullish Unicorn Pattern   consists ou
Super Fibo
Pham Minh Thuan
Fibonacci retracement levels—stemming from the Fibonacci sequence—are horizontal lines that indicate where   support   and   resistance   are likely to occur. Each level is associated with a percentage. The percentage is how much of a prior move the price has retraced. The Fibonacci   retracement   levels are 23.6%, 38.2%, 61.8%, and 78.6%. While not officially a Fibonacci ratio, 50% is also used. The indicator is useful because it can be drawn between any two significant price points, such as
Explorateur de motifs pour les motifs triangulaires tels que triangle symétrique, triangle asymétrique ou triangle à angle droit, motif en coin tel que coin montant ou coin descendant, motif d'expansion et canal de tendance Cet indicateur explore le modèle historique ainsi que les modèles actuels. C'est le meilleur indicateur pour ceux qui essaient de gagner du temps en dessinant manuellement une ligne de tendance ou un triangle et qui souhaitent l'utiliser pour une analyse automatisée du tra
Les acheteurs de ce produit ont également acheté
Tout d'abord, il convient de souligner que ce système de trading est un indicateur non repeint, non redessiné et non retardé, ce qui le rend idéal pour le trading manuel et automatisé. Le "Système de Trading Smart Trend MT5" est une solution de trading complète conçue pour les traders débutants et expérimentés. Il combine plus de 10 indicateurs premium et propose plus de 7 stratégies de trading robustes, ce qui en fait un choix polyvalent pour différentes conditions de marché. Stratégie de suivi
Atomic Analyst MT5
Issam Kassas
5 (11)
Tout d'abord, il convient de souligner que cet indicateur de trading n'est ni repainting, ni redrawing et ne présente aucun délai, ce qui le rend idéal à la fois pour le trading manuel et automatisé. L'Analyste Atomique est un indicateur d'action sur les prix PA qui utilise la force et le momentum du prix pour trouver un meilleur avantage sur le marché. Équipé de filtres avancés qui aident à éliminer les bruits et les faux signaux, et à augmenter le potentiel de trading. En utilisant plusieur
Quantum Trend Sniper
Bogdan Ion Puscasu
5 (37)
Présentation       Quantum Trend Sniper Indicator   , l'indicateur révolutionnaire MQL5 qui transforme la façon dont vous identifiez et négociez les inversions de tendance ! Développé par une équipe de traders expérimentés avec une expérience commerciale de plus de 13 ans,       Indicateur Quantum Trend Sniper       est conçu pour propulser votre parcours de trading vers de nouveaux sommets grâce à sa manière innovante d'identifier les inversions de tendance avec une précision extrêmement élevée
FX Volume MT5
Daniel Stein
4.94 (17)
Obtenez votre mise à jour quotidienne du marché avec des détails et des captures d'écran via notre Morning Briefing ici sur mql5 et sur Telegram ! FX Volume est le PREMIER et SEUL indicateur de volume qui fournit un VRAI aperçu du sentiment du marché du point de vue d'un courtier. Il fournit des informations impressionnantes sur la façon dont les acteurs institutionnels du marché, comme les courtiers, sont positionnés sur le marché des changes, bien plus rapidement que les rapports COT. Voir c
Top indicator for MT5   providing accurate signals to enter a trade without repainting! It can be applied to any financial assets:   forex, cryptocurrencies, metals, stocks, indices .  Watch  the video  (6:22) with an example of processing only one signal that paid off the indicator! MT4 version is here It will provide pretty accurate trading signals and tell you when it's best to open a trade and close it. Most traders improve their trading results during the first trading week with the help of
FX Power MT5 NG
Daniel Stein
5 (4)
Obtenez votre mise à jour quotidienne du marché avec des détails et des captures d'écran via notre Morning Briefing ici sur mql5 et sur Telegram ! FX Power MT5 NG est la nouvelle génération de notre très populaire indicateur de force des devises, FX Power. Et qu'est-ce que ce compteur de force de nouvelle génération offre ? Tout ce que vous avez aimé de l'original FX Power PLUS Analyse de la force de l'OR/XAU Des résultats de calcul encore plus précis Périodes d'analyse configurables individuel
RelicusRoad Pro MT5
Relicus LLC
4.82 (22)
Maintenant 147 $ (augmentant à 499 $ après quelques mises à jour) - Comptes illimités (PCS ou Mac) Manuel d'utilisation RelicusRoad + Vidéos de formation + Accès au groupe Discord privé + Statut VIP UNE NOUVELLE FAÇON DE REGARDER LE MARCHÉ RelicusRoad est l'indicateur de trading le plus puissant au monde pour le forex, les contrats à terme, les crypto-monnaies, les actions et les indices, offrant aux traders toutes les informations et tous les outils dont ils ont besoin pour rester renta
Advanced Supply Demand MT5
Bernhard Schweigert
4.53 (15)
La meilleure solution pour tout commerçant débutant ou expert ! Cet indicateur est un outil de trading unique, de haute qualité et abordable car nous avons intégré un certain nombre de fonctionnalités propriétaires et une nouvelle formule. Avec cette mise à jour, vous pourrez afficher des zones à double horaire. Vous pourrez non seulement afficher un TF plus élevé, mais afficher les deux, le graphique TF, PLUS le TF supérieur : AFFICHAGE DES ZONES NICHÉES. Tous les traders Supply Demand vont ado
TPSpro TRENDPRO  - is a trend indicator that automatically analyzes the market and provides information about the trend and each of its changes, as well as giving signals for entering trades without redrawing! The indicator uses each candle, analyzing them separately. referring to different impulses - up or down impulse. Exact entry points into transactions for currencies, crypto, metals, stocks, indices!  -  Version MT4                  DETAILED DESCRIPTION        /       TRADING SETUPS       
A key element in trading is zones or levels from which decisions to buy or sell a trading instrument are made. Despite attempts by major players to conceal their presence in the market, they inevitably leave traces. Our task was to learn how to identify these traces and interpret them correctly. Reversal First Impulse levels (RFI)   -  Version MT4                  INSTRUCTIONS                 RUS                 ENG                         R ecommended to use with an indicator   -  TREND PRO  
Professional Scalping Tool on Deriv Attention! The indicator will be sold in limited quantities!!! Description: This trading indicator is designed for professional traders focused on scalping. Designed with the market in mind, it provides highly accurate spike trading signals. It works on the M1 timeframe and supports the following symbols: Boom 300 Index, Boom 500 Index, Boom 1000 Index, Crash 300 Index, Crash 500 Index, Crash 1000 Index. Functional Features: - Direction: - Trading is ca
Blahtech Supply Demand MT5
Blahtech Limited
4.57 (14)
Was: $299  Now: $99   Supply Demand uses previous price action to identify potential imbalances between buyers and sellers. The key is to identify the better odds zones, not just the untouched ones. Blahtech Supply Demand indicator delivers functionality previously unavailable on any trading platform. This 4-in-1 indicator not only highlights the higher probability zones using a multi-criteria strength engine, but also combines it with multi-timeframe trend analysis, previously confirmed swings
Présentation       Quantum Breakout PRO   , l'indicateur révolutionnaire MQL5 qui transforme la façon dont vous négociez les zones d'évasion ! Développé par une équipe de traders expérimentés avec une expérience commerciale de plus de 13 ans,       Évasion quantique PRO       est conçu pour propulser votre parcours commercial vers de nouveaux sommets grâce à sa stratégie de zone de discussion innovante et dynamique. Quantum Breakout Indicator vous donnera des flèches de signalisation sur le
XQ Indicator MetaTrader 5
Marzena Maria Szmit
5 (1)
Step into the realm of Forex trading with confidence and precision using XQ, a cutting-edge Forex indicator designed to elevate your trading game to unprecedented heights. Whether you're a seasoned trader or just stepping into the world of currency exchange, XQ Forex Indicator empowers you with the insights and signals needed to make informed trading decisions. The signal conditions are a combination of three indicators, and XQ Forex Indicator only display  medium and long-term trends . The ind
TrendDecoder Premium MT5
Christophe, Pa Trouillas
5 (1)
Identifiez les ranges et les tendances fortes  |  Obtenez les premiers signaux   |    Obtenez des TP et des sorties   clairs   |    Repérer les niveaux Fibo que le prix va tester   |  Indicateur qui ne retrace pas, non retardé - idéal pour le trading manuel et automatisé - adapté à tous les actifs et à toutes les unités de temps - 50% discount   pour le lancement - puis retour à >>   149 $ Après votre achat,   contactez-moi sur ce canal  pour obtenir les réglages recommandés. Version MT4 :   cli
MetaBands M5
Vahidreza Heidar Gholami
4.67 (3)
MetaBands uses powerful and unique algorithms to draw channels and detect trends so that it can provide traders with potential points for entering and exiting trades. It’s a channel indicator plus a powerful trend indicator. It includes different types of channels which can be merged to create new channels simply by using the input parameters. MetaBands uses all types of alerts to notify users about market events. Features Supports most of the channel algorithms Powerful trend detection algorith
Tout d'abord, il convient de souligner que ce système de trading est un indicateur non repainting, non redrawing et non lagging, ce qui le rend idéal pour le trading professionnel. Le "Système de Trading de Support et Résistance Intelligent" est un indicateur avancé conçu pour les traders novices et expérimentés. Il permet aux traders de bénéficier de précision et de confiance sur le marché du forex. Ce système complet combine plus de 7 stratégies, 10 indicateurs et diverses approches de trad
Was: $249  Now: $99   Market Profile defines a number of day types that can help the trader to determine market behaviour. A key feature is the Value Area, representing the range of price action where 70% of trading took place. Understanding the Value Area can give traders valuable insight into market direction and establish the higher odds trade. It is an excellent addition to any system you may be using. Inspired by Jim Dalton’s book “Mind Over Markets”, this indicator is designed to suit the
Malaysian SNR Levels
Matthias Horst Pieroth
This indicator can be used to display Support and Resistance levels according to  the  Malaysian SNR concept , in which Support and Resistance are exact levels of a line chart. Malaysian SNR There are 3 different horizontal levels in Malaysian SNR: A-Level : This level is located at the peak of this line chart. (shape looks like the letter A) V-Level : Level at the valley of a line chart, (shape looks like the letter V) Gap-Leve l: This level is located at the Close/Open gap between two cand
The Volume by Price Indicator for MetaTrader 5 features Volume Profile and Market Profile TPO (Time Price Opportunity). Get valuable insights out of currencies, equities and commodities data. Gain an edge trading financial markets. Volume and TPO histogram bar and line charts. Volume Footprint charts. TPO letter and block marker charts including split structures. Versatile segmentation and compositing methods. Static, dynamic and flexible ranges with relative and/or absolute visualizations. Lay
La meilleure solution pour tout débutant ou Expert Trader ! Cet indicateur est un outil de trading unique, de haute qualité et abordable car nous avons incorporé un certain nombre de caractéristiques exclusives et une formule secrète. Avec seulement UN graphique, il donne des alertes pour les 28 paires de devises. Imaginez comment votre trading s'améliorera parce que vous serez capable de repérer le point de déclenchement exact d'une nouvelle tendance ou d'une opportunité de scalping ! Cons
TPA True Price Action indicator reveals the true price action of the market makers through 100% non-repainting signals strictly at the close of a candle! TPA shows entries and re-entries, every time the bulls are definitely stronger than the bears and vice versa. Not to confuse with red/green candles. The shift of power gets confirmed at the earliest stage and is ONE exit strategy of several. There are available now two free parts of the TPA User Guide for our customers. The first "The Basics"
IX Power MT5
Daniel Stein
5 (2)
IX Power   apporte enfin la précision imbattable de FX Power aux symboles non-Forex. Il détermine avec précision l'intensité des tendances à court, moyen et long terme de vos indices, actions, matières premières, ETF et même crypto-monnaies préférés. Vous pouvez   analyser tout ce que   votre terminal a à offrir. Essayez-le et découvrez comment   votre timing s'améliore considérablement   lors de vos transactions. Caractéristiques principales d'IX Power Résultats de calcul précis à 100 %,
Owl Smart Levels MT5
Sergey Ermolov
4.47 (36)
Version MT4   |  FAQ L' indicateur Owl Smart Levels est un système de trading complet au sein d'un seul indicateur qui comprend des outils d'analyse de marché populaires tels que les fractales avancées de Bill Williams , Valable ZigZag qui construit la structure d'onde correcte du marché et les niveaux de Fibonacci qui marquent les niveaux exacts d'entrée. sur le marché et les endroits où prendre des bénéfices. Description détaillée de la stratégie Mode d'emploi de l'indicateur Conseiller-Assis
Golden Gate Algo MT5
James David Lane
4 (6)
40% DE RÉDUCTION POUR NOËL ! AUGMENTATION DES PRIX À 250 $ LE 1er JANVIER ! Présentation de GoldenGate Entries : une solution de trading de pointe ! Découvrez une approche révolutionnaire du trading avec GoldenGate Entries (GGE), un indicateur avancé conçu pour améliorer votre expérience de trading. GGE offre un ensemble complet de fonctionnalités pour donner aux utilisateurs la précision et la confiance nécessaires dans leurs décisions de trading. Paires : Toutes (FX - Matières premières
If you want to find good trading opportunities, then you must trade near the Trend Line. This allows you to have a tighter         stop loss   on your trades — which improves your       risk to reward . But that’s not all… Because if you combine Trend Line with Support and Resistance, that’s where you find the best trading opportunities. Now you might wonder: “So when do I enter a trade?” Well, you can use reversal     candlestick patterns   (like the   Hammer, Bullish Engulfing, etc.) as your e
Boom and Crash Spike Detector v1.0 Boom and Crash spike detector prints Down non repaint Arrow for catching crash spikes and Up non repaint arrow for catching boom spikes.  It is suitable for 1M time frame for majorly crash500 and Boom 500.  When the Red arrow prints in a red zone moving averages, it indicates high probability of crash spikes downwards, likewise, blue arrow printing in a blue zone of moving average, it indicates high probability of boom spikes.  Its pretty straight forward since
Bill Williams Advanced
Siarhei Vashchylka
5 (3)
Bill Williams Advanced is designed for automatic chart analysis using Bill Williams' "Profitunity" system. The indicator analyzes four timeframes at once. Manual (Be sure to read before purchasing) Advantages 1. Automatically analyzes the chart using the "Profitunity" system of Bill Williams. The found signals are placed in a table in the corner of the screen. 2. Equipped with a trend filter based on the Alligator indicator. Most of the system signals are recommended to be used only accordi
TrendMaestro5
Stefano Frisetti
note: this indicator is for METATRADER4, if you want the version for METATRADER5 this is the link:  https://www.mql5.com/it/market/product/108106 TRENDMAESTRO recognizes a new TREND in the bud, he never makes mistakes. The certainty of identifying a new TREND is priceless. DESCRIPTION TRENDMAESTRO identifies a new TREND in the bud, this indicator examines the volatility, volumes and momentum to identify the moment in which there is an explosion of one or more of these data and therefore the mome
VJ Sniper MT5
Vijayaratna Kumar Boda
VJ Sniper - MT5 Buy / Sell Indicator:   This Indicator is as simple as Buy in Up Trend & Sell in Down Trend.                                                           There are Support / Resistance Graphic levels for choosing the best Entries. Background:   Any in-built indicator of MT5 does not work as stand alone such as Stochastic, CCI or DeMarker etc. But combination of them with trend projection work & give the best results for Trading entries. So this Indicator is blended to give the best
Plus de l'auteur
The Expert Advisor is designed for pair trading with 2 instruments with high positive or negative correlation. Instrument lots are balanced automatically depending on the tick value of the instrument, and therefore it is advisable to use the base lot of at least 0.05. The function of refills is built-in, taking into account the number of knees and the coefficients of multiplication and addition of lots. Trades are opened when there is a discrepancy by a specified distance in points of instrument
Amka Ccf
VLADISLAV AKINDINOV
5 (6)
A trend indicator is a hybrid of several well-known indicators that process data sequentially with signaling a trend change. Final processing of the AMka indicator data. The indicator is conventionally not drawing - upon restarting, it can change some of the chart data, but if you do not touch it, it will not redraw. It is possible to issue an alert, sound, send an e-mail or a message to another terminal when the trend changes.
FREE
The indicator calculates the correlation coefficient of 2 instruments, shifts the chart of the 2nd instrument relative to the 1st and displays the charts of both instruments on the current chart. The maximum positive and negative deltas and the current delta as a percentage of the maximum are calculated. It is possible for signals to set a delta for entry and exit with displaying the direction of entry into trade for each instrument. The space between the charts is also filled with different col
The indicator is designed for pair trading with 2 highly correlated instruments.  Indicator charts can be displayed as lines or histograms. There is an MTF mode, the maximum and minimum deltas for the calculated number of bars are displayed with a check for a specified minimum value. It is possible to enable the calculation of trade operations with checking the current correlation coefficient for the minimum specified, the current delta in points or percent of the maximum (minimum) delta and
Signal indicator Cma 2 Cjcf
VLADISLAV AKINDINOV
5 (3)
A signal indicator consisting of several well-known indicators that process data sequentially. 2 options - for schedule and basement. In the settings it is possible to enable alerts about the change of trend (alerts) sound, by e-mail and push. It is possible to change the colors and thickness of the lines, the colors and codes of the arrows, the number of calculation bars and separately configure the parameters included in the indicators.
FREE
Delta 2 symbols
VLADISLAV AKINDINOV
The indicator is designed for pair trading with 2 highly correlated instruments.  Indicator charts can be displayed as lines or histograms. There is an MTF mode, the maximum and minimum deltas for the calculated number of bars are displayed with a check for a specified minimum value. It is possible to enable the calculation of trade operations with checking the current correlation coefficient for the minimum specified, the current delta in points or percent of the maximum (minimum) delta and
Advisor for semi-automatic trading with a virtual multi-level trail of take profit and stop loss, a trail of target profit, martingale functions, manual opening of orders, managing third-party orders, counting trading instruments, displaying current information and statistics on a chart. It is possible to set several levels of trailing take profit and stop loss and to each level to assign the percentage of partial closing of the order. The percentage of the lot when closing the level is calculat
The indicator is a mathematical analog of a two-level RC (resistor-capacitor) filter. On the chart (default colors), the red line is the standard terminal Moving Average, the values ​​of which are filtered by the first level filter (yellow line) and then by the second level filter (blue line). Moving Average sets the preliminary smoothing of the price series.  The indicator has the ability to use the sticking together of any combination of its own charts among themselves, if they are at a dis
Trend Deviation
VLADISLAV AKINDINOV
Trend indicator with calculation of dynamic levels and signaling their intersection. Description of input parameters: StepTF = true; - Calculation of the indicator by closing the bar (true) or by each tick (false) BarsCount = 300; - Number of settlement bars Price = PRICE_CLOSE; - Type of price used TimeFrame = PERIOD_CURRENT; - Estimated timeframe TrendPeriod = 9; - Trend calculation period TrendDeviations = 4.9; - coefficient of deviation PeriodTrendSmooth = 1; - Trend smoothi
MEA2RTEn
VLADISLAV AKINDINOV
The adviser works on the basis of terminal indicators. It can work in martingale mode if you set the number of unidirectional orders to be greater than 1 and adjust the lot coefficients and the step of opening the knees, which can be opened taking into account the indicator signal. If the adviser is launched on several instruments and the comments of the orders are the same, then you can limit the number of simultaneously trading advisers - the advisers themselves will track how much they are c
Arrow indicator of trend reversal with 2-level signaling and multi timeframe. The indicator line consists of 4 colors, indicating the divergence level and possible trend reversals. Light arrows indicate a weak trend, dark arrows indicate a strong one. Sensitivity levels and steps are set in the settings. Signals are output to the mailbox and mobile terminal.
The Expert Advisor trades on a trend reversal on any instrument and timeframe. Testing was carried out on the H4 timeframe. Trades are not frequent and therefore, to increase the number of trades, it is advisable to put on several instruments. To control the number of simultaneously trading advisors, a limit for trading symbols is set and advisors must have the same order comments. Closing deals can be done in virtual mode (preferably). There are information and statistics panels. Indicator base
CCi indicator with dynamic levels based on the standard MA, taken as the basis for reading the levels, and modified data of the standard CCi relative to the MA. The input parameter CutCCi, if greater than 0, limits the vertical drawing of the CCi graph, but does not affect the calculations. There are 3 options for displaying arrows: arrows when crossing levels to exit the level zone - trend, arrows to return after exiting the level zone - reverse and crossing the zero level (red MA line). You ca
Growth and trend reversal indicator. It does not redraw in the bar calculation mode and can redraw on the 0th bar in the tick calculation mode. The trend line and level lines with their own settings are calculated separately. There are 2 types of arrows - for the intersection of trend lines and the reverse intersection of trend lines (reversal). The arrows are buffer and you can output signals to the Expert Advisor. The arrows can be duplicated with a sound signal, a message from the terminal,
Deviation trend indicator
VLADISLAV AKINDINOV
5 (1)
Indicator of trend deviation with a static level. The deviation coefficient is set for the trend histogram. Signals are the intersection of the level trend histogram in the direction of the trend or during a trend reversal - the option is selected in the indicator settings by the "Revers" parameter. There are all the necessary settings for the design of the indication and sending messages to mail or a mobile terminal. All input parameters have an intuitive name. Analog for MT5: https://www.mql5
CCi MA Trend
VLADISLAV AKINDINOV
The indicator consists of a base of the standard CCI and levels calculated on the basis of MAs, which move following the price. To strengthen the trend movement, the deviation coefficient is used. To exclude triggering in a flat, the minimum trend limiter is used. Signal arrows are displayed on the indicator chart and the price chart - everything is turned off. There is an arrow trigger function - the arrows alternate when it is turned on. You can display signals on a chart, on e-mail and on a m
Multi Closer MT4
VLADISLAV AKINDINOV
The utility is designed to control all account orders with the ability to automatically close them by: profit, breakeven or trailing profit in points separately for each order separately profit, breakeven or trailing profit in points for buy orders of each symbol profit, breakeven or trailing profit in points for sell orders of each symbol profit, breakeven or trailing profit in points for buy+sell orders of each symbol profit, breakeven or trailing profit in points for the entire account as a
The Expert Advisor is designed for pair trading with 2 selected instruments with automatic calculation of the correlation coefficient and determination of one of 8 possible entries by 4 for positive and negative correlation. The inputs used are set in the settings: 1 and 3 for trading for a fall in the delta between instruments, 2 and 3 for trading for a rise in the delta (a more dangerous trading option). There are trade control buttons, information and statistical panels. There is a wide range
Trend reversal expert
VLADISLAV AKINDINOV
The Expert Advisor is based on a proprietary triple indicator. Each of the 3 parts of the indicator can be disabled and individually configured. Initially, it was supposed to enter trade at a trend reversal, but you can set up an entry along the trend. It is possible to control the main functions using the buttons on the chart, including opening positions manually. There are grid functions with the total profit of all unidirectional positions (for hedging accounts) with martingale functions (opt
Deviation trend
VLADISLAV AKINDINOV
Indicator of trend deviation with a static level. The deviation coefficient is set for the trend histogram. Signals are the intersection of the level trend histogram in the direction of the trend or during a trend reversal - the option is selected in the indicator settings by the "Revers" parameter. There are all the necessary settings for the design of the indication and sending messages to mail or a mobile terminal. All input parameters have an intuitive name. Analog for MT4: https://www.mql5.
Signal scanner MT5
VLADISLAV AKINDINOV
The scanner is designed to scan signal buffers of indicators (arrows) and display the nearest signal bar on the panel in color and digital display. Symbols to be scanned, time frames and the number of bars to be scanned are specified, starting from the current (0th) bar. There is also a complex signal, which indicates a list of timeframes on which the indicator signal must match.   You can collapse the indicator by clicking the left mouse button on the upper left corner of the panel (name)
Semi automatic expert
VLADISLAV AKINDINOV
The advisor is intended for trading on a hedging account, because trades in both directions simultaneously. In this case, you can use both trading with one order (preferably) and a grid of orders in martingale mode. In this case, built-in indicators of our own design are used. There is a limit on the number of simultaneously trading symbols. Trading can be carried out on any symbol with any time frames. The advisor has built-in functionality for manual trading. This is a panel with the abilit
Flipping expert
VLADISLAV AKINDINOV
The advisor is intended for trading on a hedging account, because trades in both directions simultaneously and reverses the direction of trade. In this case, you can use both trading with one order (preferably) and a grid of orders in martingale mode. In this case, a built-in indicator of our own design is used. There is a limit on the number of simultaneously trading advisors. Trading can be carried out on any symbol with any time frames.
Filtrer:
Aucun avis
Répondre à l'avis
Version 2.0 2024.01.12
Ajout de flèches et d'alertes en zigzag de 3 niveaux.