Black horse indicator MT5
- Indicateurs
- Shengzu Zhong
- Version: 1.22
- Mise à jour: 2 juin 2024
- Activations: 10
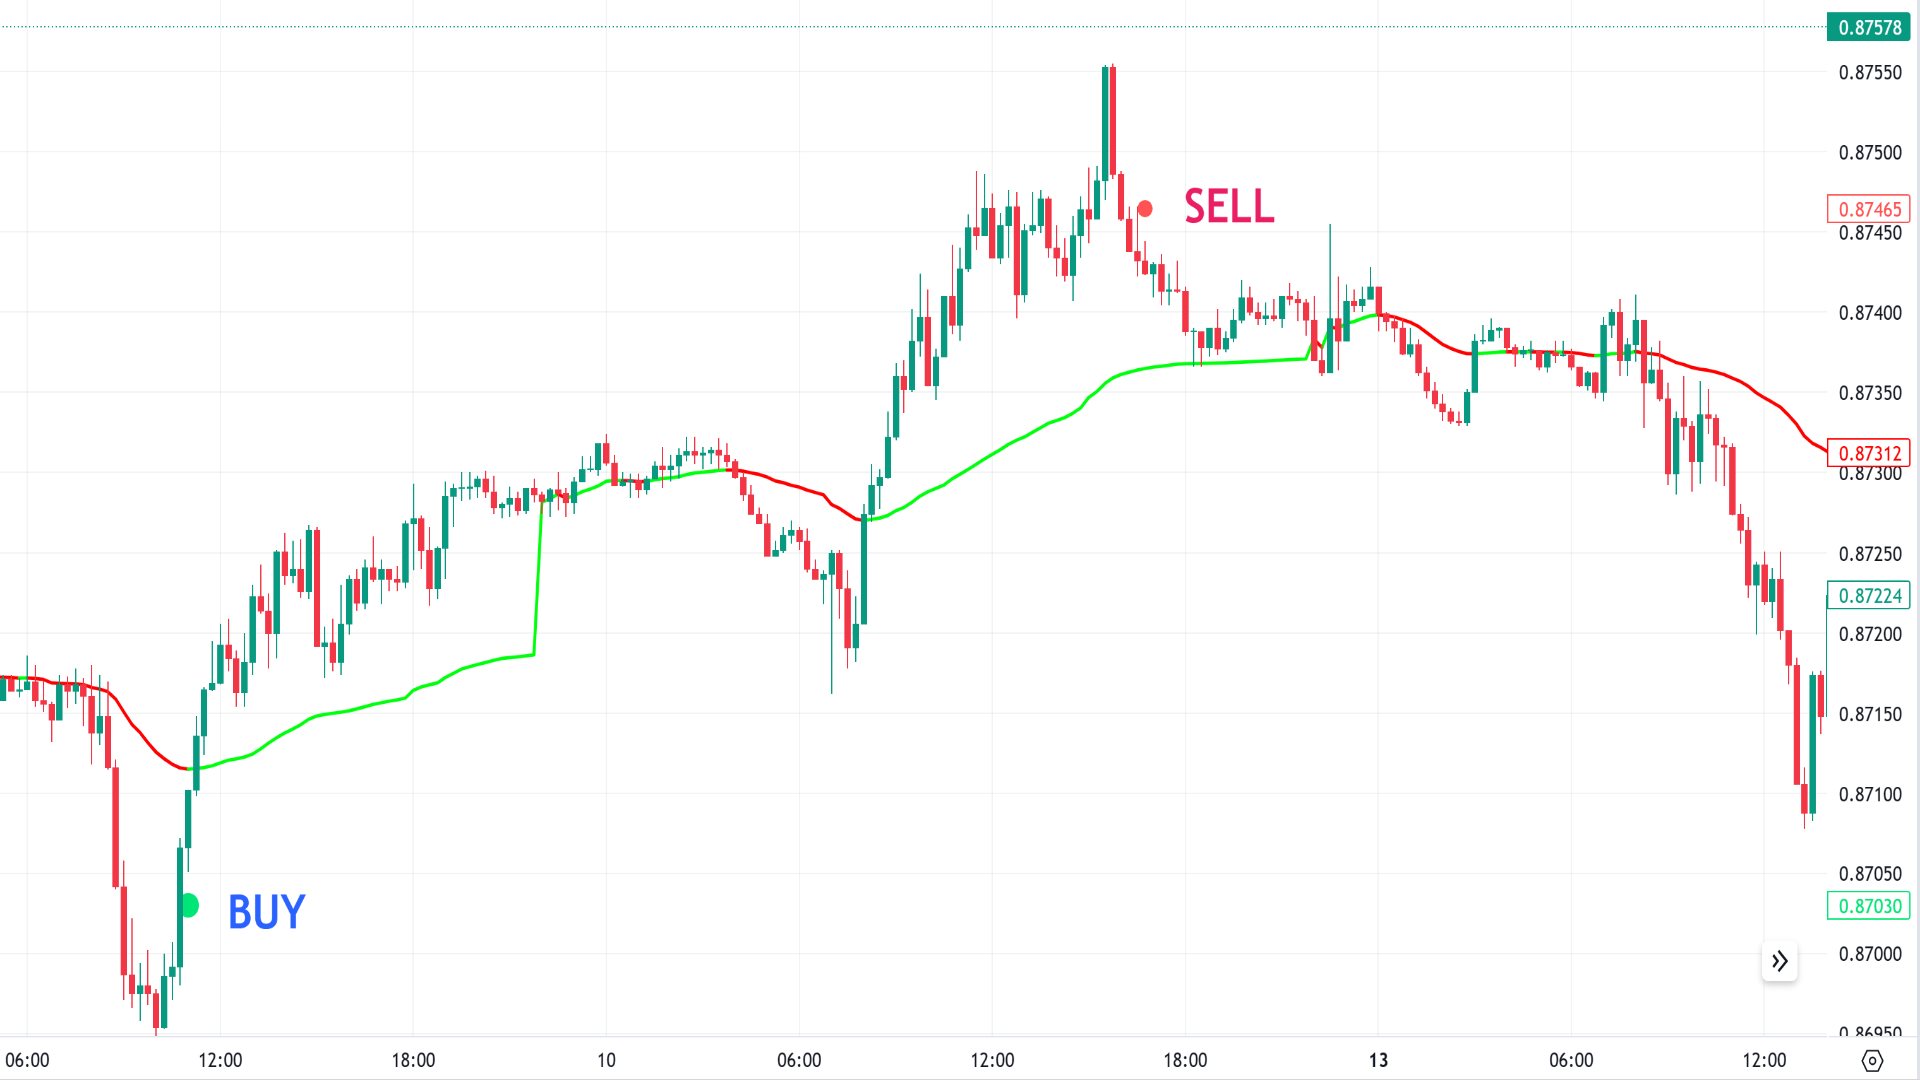
L'objectif de l'indicateur "Black Horse" est d'identifier les divergences entre l'action des prix et l'indicateur VWAP. Il utilise des filtres pour éliminer les divergences potentiellement fausses et générer des alertes de haute qualité et précises.
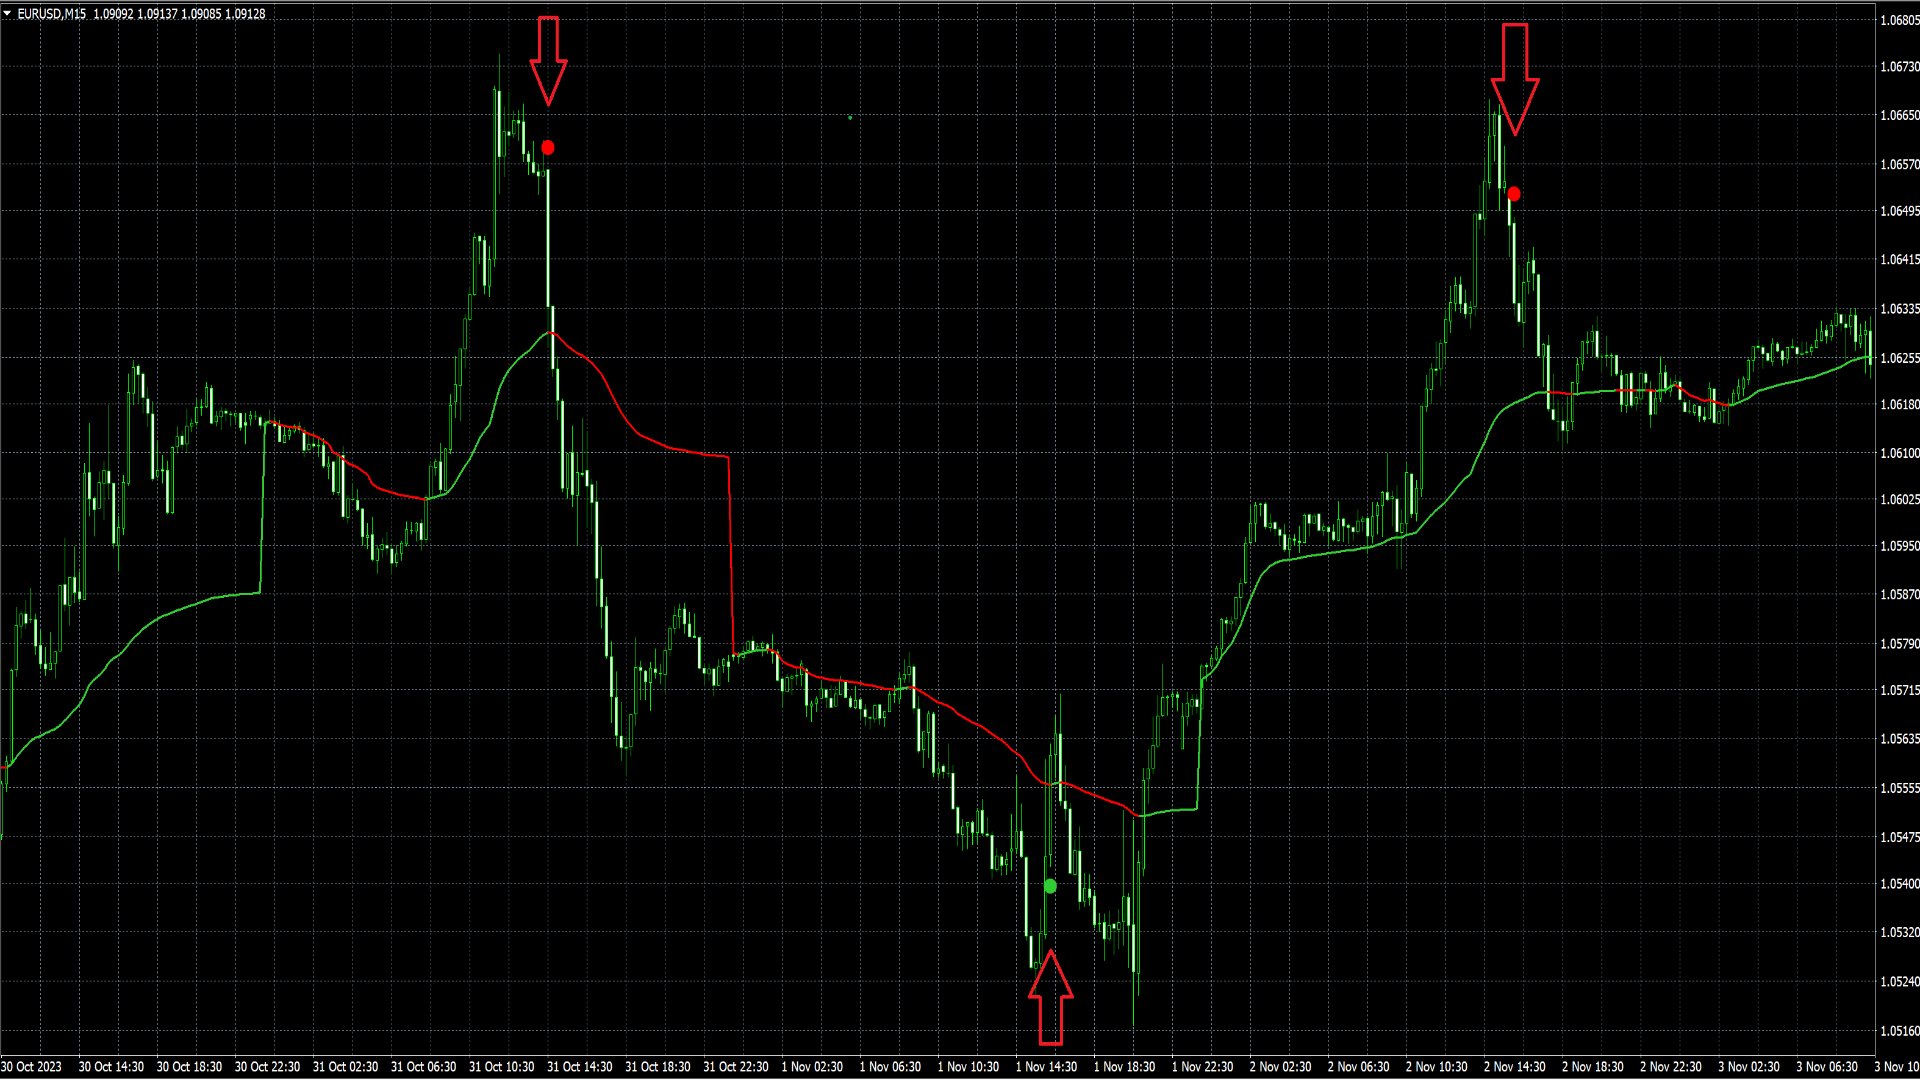
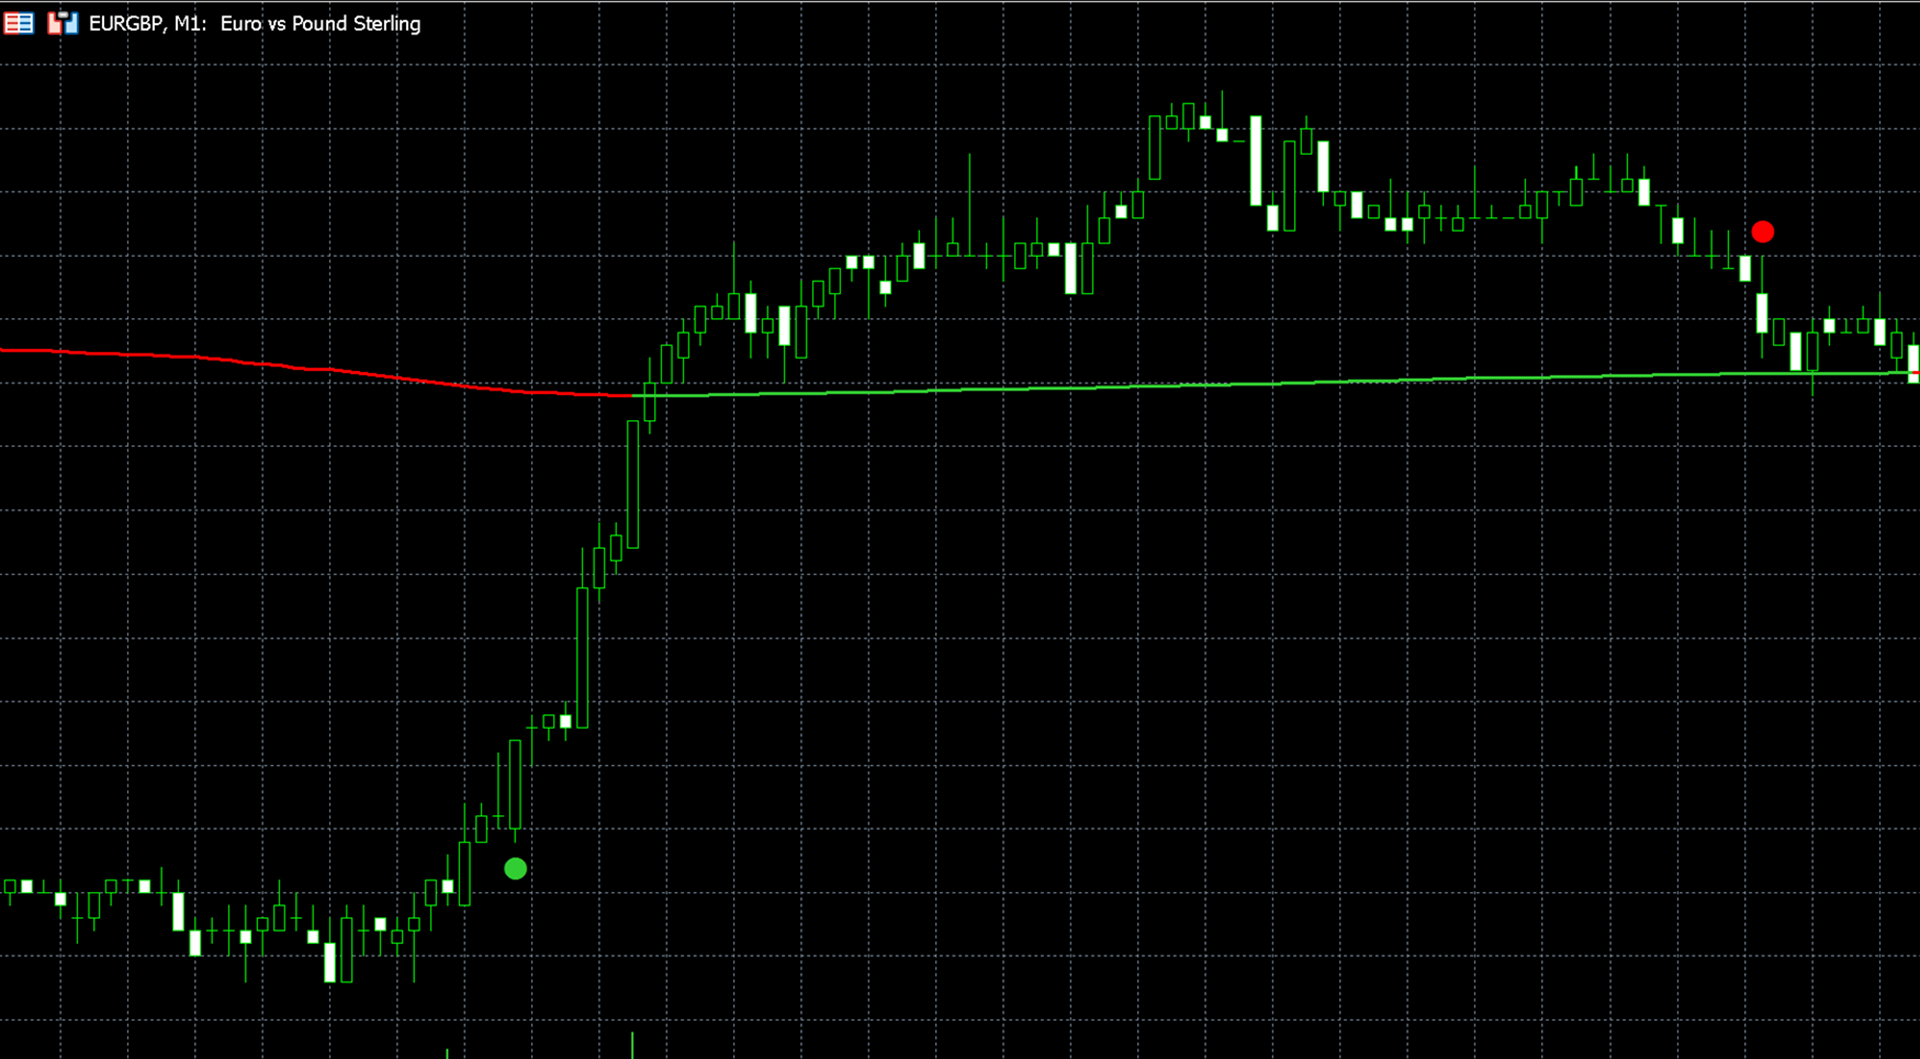
Les divergences baissières sont indiquées par des points rouges au-dessus de la bougie, tandis que les divergences haussières sont représentées par des points verts en dessous de la bougie.
Le principal filtre de divergence repose sur l'ATR (Average True Range) et le mouvement des prix dans les bougies précédentes dans la période de révision. Les divergences sont identifiées lorsque le mouvement des prix sur la période de révision est suffisamment net, dépassant le multiplicateur ATR multiplié par l'ATR.
En raison des caractéristiques du calcul, il est conseillé de définir des valeurs plus basses pour le multiplicateur ATR et la période de révision lors de l'utilisation de cadres temporels plus longs. Sur des cadres temporels plus longs, où les mouvements de prix ont tendance à être plus lissés, comme sur le graphique de 15 minutes, les fluctuations de prix importantes se produisent moins fréquemment et sont généralement contenues dans moins de bougies par rapport aux cadres temporels plus courts. Les actions avec une volatilité plus faible, telles que HSBC, devraient également utiliser des multiplicateurs ATR plus bas et des périodes de révision plus courtes.
Dans la section "Paramètres visuels", vous avez la possibilité de modifier la couleur de la ligne VWAP, d'afficher des couleurs alternées pour le VWAP, d'ajuster la taille des signaux de divergence et de montrer ou cacher la ligne VWAP.