• Aperçu
  • Avis
  • Commentaires

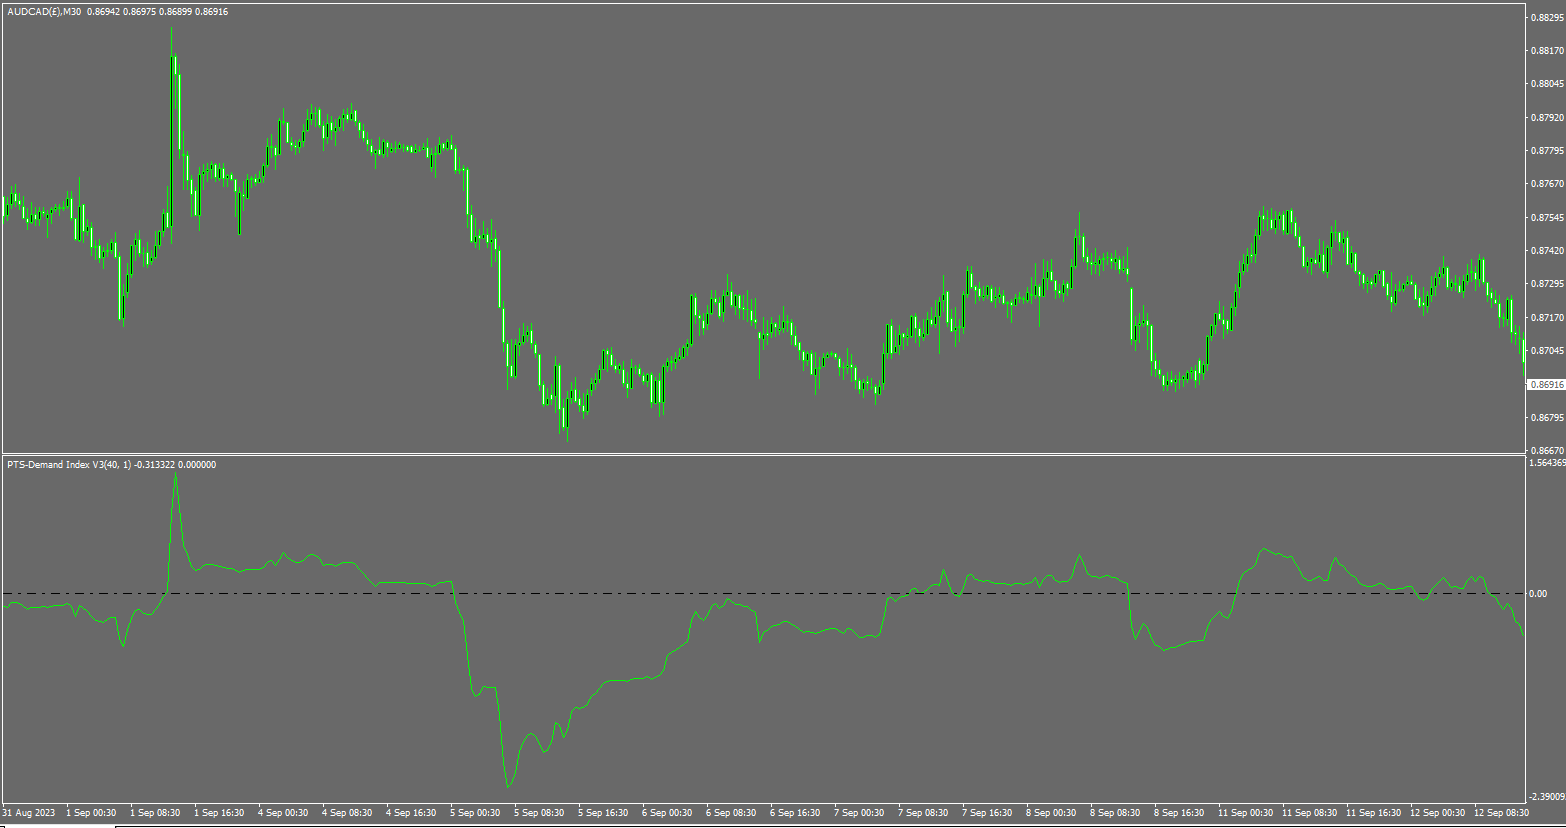
PTS Demand Index MT5

Code PTS Demand Index par Precision Trading Systems

Le Demand Index a été créé par James Sibbet et utilise un code complexe pour faciliter l'interprétation du volume et du prix en tant que combinaison.

Comprendre les volumes n'est jamais une tâche facile, mais ce magnifique morceau de programmation simplifie certainement les choses.

Il existe plusieurs façons dont cet indicateur peut bénéficier aux traders et aux investisseurs.


Divergences (en tant qu'indicateur de premier plan)
Après avoir étudié de nombreux indicateurs techniques au fil des années, j'ai formé l'opinion que le Demand Index est l'un des rois pour trouver des divergences significatives.

Si le prix du marché atteint un nouveau sommet et que le Demand Index ne le fait pas, on parle de divergence baissière. Il y a plusieurs photos drastiques sur mon site web montrant des cas extrêmes de divergences pour vous aider à comprendre ce qu'il faut rechercher. Plus la différence de la divergence est importante, plus elle est significative en termes d'indication pour prévoir un changement de tendance.


Détection de tendance (en tant qu'indicateur retardé avec une fonction d'alerte intégrée)
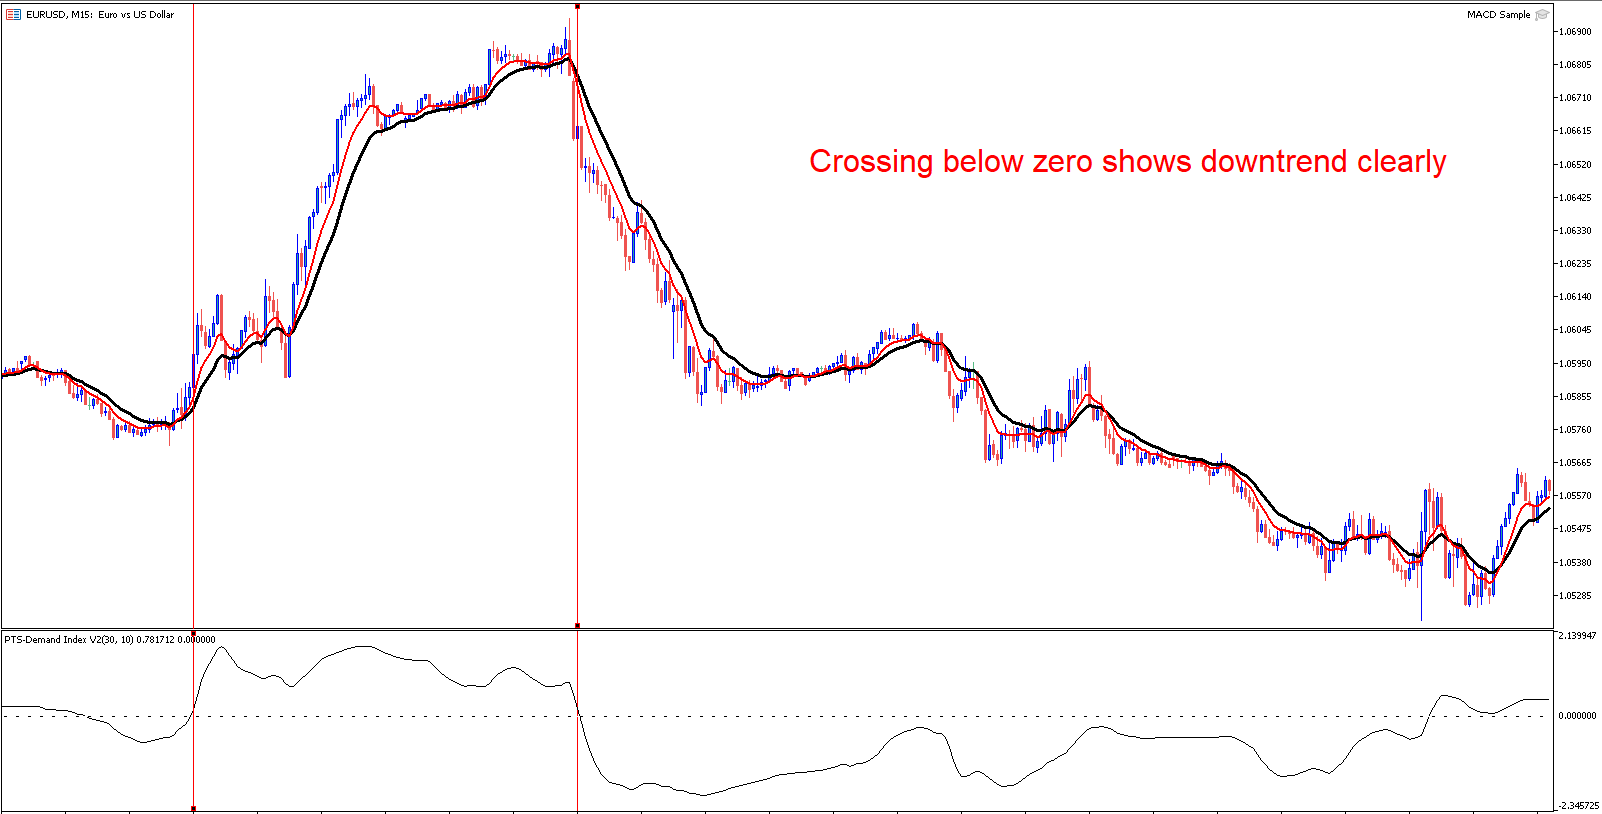
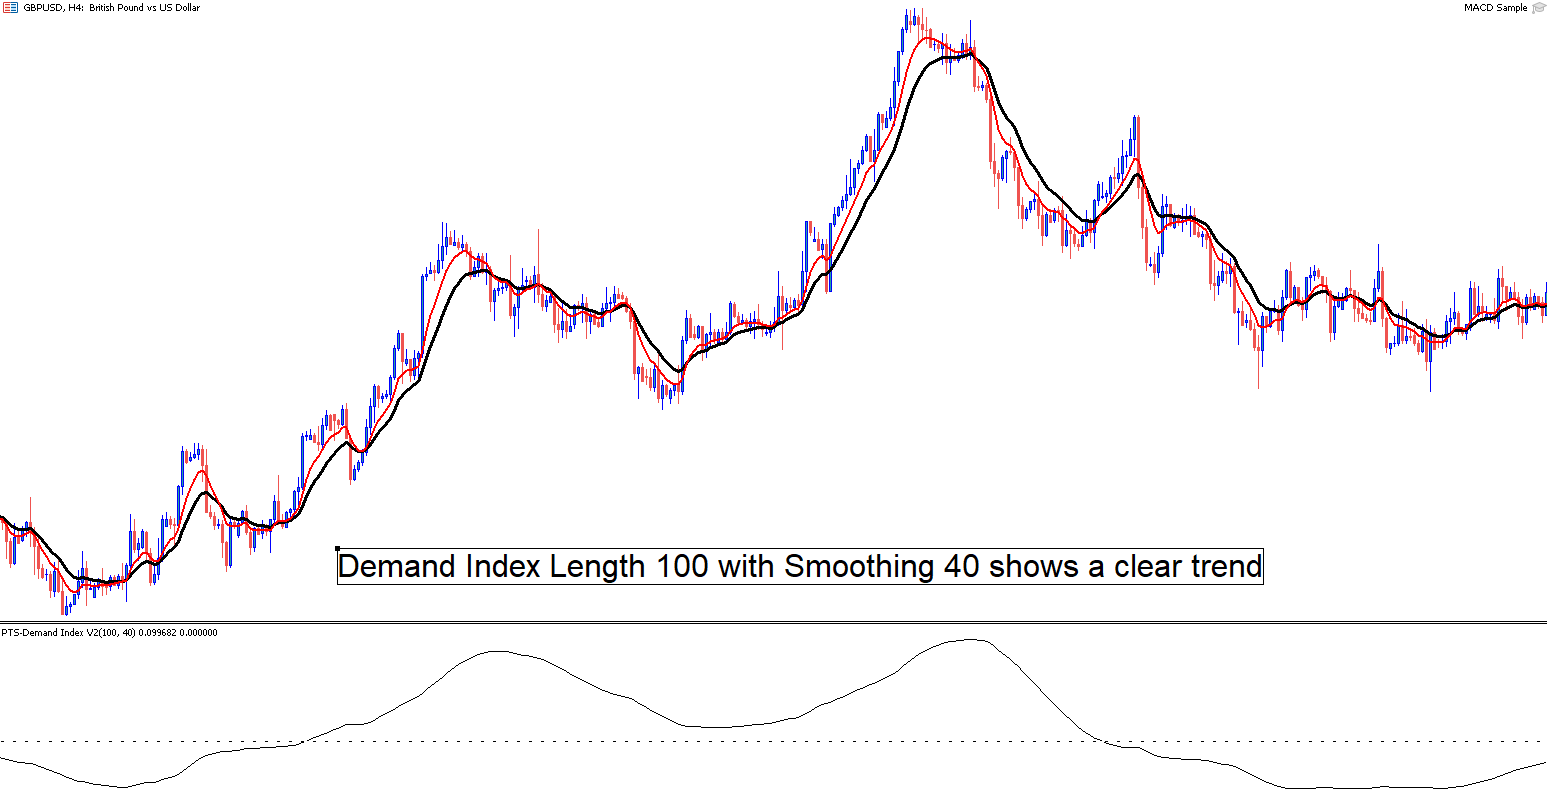
Le croisement de la ligne zéro est une indication de vente nette ou d'achat sur la période que vous avez spécifiée, il faut noter que de cette manière, l'indicateur agit comme un indicateur retardé et des périodes plus longues sont nécessaires avec une certaine lissage pour obtenir des résultats significatifs. Je suggère des périodes d'au moins >40 à cette fin, avec une certaine lissage > 5 ajoutée pour réduire les faux signaux.

Pour activer l'alerte pour le croisement de zéro, cliquez sur les propriétés de l'indicateur, les entrées, utilisez les alertes = true.

Lorsque l'alerte se déclenche, une fenêtre de message apparaîtra indiquant le nom du symbole et le message "Demand Index a franchi la barre des zéro (ou en dessous)".

Le paramètre par défaut de l'alerte est réglé sur false.

Nonobstant ce qui précède, il est important de comprendre la différence entre un "vrai croisement de zéro" pour un changement de tendance et un faux signal.

Si le Demand Index est en train de stagner et de fluctuer autour de zéro, cela ne signifie pas grand-chose, mais une percée décisive qui se distingue est le genre de mouvement que l'on doit rechercher. C'est le volume qui fait bouger les prix en créant un déséquilibre entre l'offre et la demande, créant une situation où il y a plus d'acheteurs ou de vendeurs agressifs, ce qui entraîne un mouvement du marché dans la direction de l'indicateur.

Ce produit est conçu pour afficher exactement ces informations de la manière la plus claire possible.


Déclenchements (en tant qu'indicateur de premier plan)
Lorsqu'une plage ou une zone de congestion serrée est visible dans l'indicateur Demand Index, il vaut la peine de noter que lorsqu'une percée définitive de cette plage se produit, elle sera probablement suivie d'une percée dans la même direction que le marché sous-jacent.

Comme précédemment, il est également important de connaître la différence entre le "bruit" et un véritable modèle de rupture, cela doit être une observation évidente et si vous devez passer du temps à vous demander s'il est réel ou non, alors ce n'est probablement pas un signal qui vaut la peine d'être suivi.


Prédiction du prochain mouvement (en tant qu'indicateur de premier plan)
Lorsqu'un pic extrême vers le haut du Demand Index se produit, cela implique un achat sérieux et cela est généralement suivi d'une autre montée vers un pic plus élevé du marché.

Il en va de même en sens inverse lorsqu'un grand pic pointant vers le bas se produit, cela signifie que le marché fera un nouveau plus bas.

Souvent, ces mouvements sont suivis d'une divergence qui entraîne ensuite un renversement de tendance.


Divergences étendues sur une période de temps (en tant qu'indicateur de premier plan)
Lorsqu'un marché continue de baisser et que le Demand Index continue de monter, cela signifie qu'un important creux se forme, et vice versa.


J'ai identifié cinq nouvelles règles qui peuvent être utilisées avec le Demand Index et qui peuvent être trouvées sur mon site web en effectuant une recherche. De nombreux exemples graphiques illustrent clairement ces règles.


Si vous avez des questions, veuillez ne pas m'envoyer de message ici car je ne le verrai pas pendant quelques semaines. Envoyez-moi un e-mail via mon site web pour une réponse plus rapide.


Produits recommandés
This product is designed for the MT5 platform and offers two key features: VWAP (Volume Weighted Average Price) calculation and Volume Profile analysis. Advantages: VWAP Calculation: The product calculates the VWAP, which is a popular indicator used by traders to determine the average price of a security based on its trading volume. It helps identify potential buying or selling opportunities by comparing the current price to the average price weighted by volume. Volume Profile Analysis: The prod
Do you use volume in your reading of the market? Certainly many traders use it, and do not imagine operating without it. The Color Histogram Volume Set indicator allows the user to choose the value that he considers interesting to monitor. When you pass this you will have visual confirmation and if you want you will also have the audible alert that is given by the indicator. Of course, there are other ways to try to find a high volume, such as assessing whether the volume
This indicator anticipates price reversals analyzing bullish and bearish pressure in the market. The buying pressure is the sum of all the accumulation bars over a certain number of days, multiplied by the volume. The selling pressure is the sum of all of the distribution over the same number of bars, multiplied by the volume. [ Installation Guide | Update Guide | Troubleshooting | FAQ | All Products ] The indicator ratio gives you a measure of the buying pressure as a percentage of the total ac
RAD CRITICAL LEVES RAD indicator tracks “Relevant Volume” in real time, identifying accumulation and distribution processes, projecting them in the chart as SUPPORT or RESISTANCE zones. Natural   support   and resistance levels are generated by Volume Accumulation and Distribution processes. As these processes evolve, levels at which the relevant volume in the market place is positioned, become difficult areas to cross upwards or downwards. By using this information, traders can identify very s
Was: $249  Now: $99   Market Profile defines a number of day types that can help the trader to determine market behaviour. A key feature is the Value Area, representing the range of price action where 70% of trading took place. Understanding the Value Area can give traders valuable insight into market direction and establish the higher odds trade. It is an excellent addition to any system you may be using. Inspired by Jim Dalton’s book “Mind Over Markets”, this indicator is designed to suit the
WAPV Weis Wave Chart Forex
Eduardo Da Costa Custodio Santos
Le Weis Wave Chart Forex pour MT5 est un indicateur de prix et de volume. La lecture du prix et du volume a été largement diffusée par Richard Demille Wyckoff sur la base des trois lois qu'il a créées : l'offre et la demande, la cause et l'effet et l'effort contre le résultat. En 1900 R.Wyckoff utilisait déjà le wave chart dans ses analyses. De nombreuses années plus tard, vers 1990, David Weis a automatisé le diagramme d'onde de R. Wyckoff et aujourd'hui nous vous apportons l'évolution du diagr
The   Visual Volatility Clustering   indicator clusters the market based on volatility. The indicator does not redraw and gives accurate data, does not use closing prices. Uses the opening prices or the highs or lows of the previous completed bar. Therefore, all information will be clear and unambiguous. The essence of the indicator is to divide the price market into certain areas according to a similar type of volatility. This can be done in any way. In this example, the indicator is configure
A countdown timer for the  Volume bar chart generator  and  Tick chart generator  products, which are available for download from the MQL5 Market: Tick chart generator: https://www.mql5.com/en/market/product/29215 Volume bar chart generator: https://www.mql5.com/en/market/product/47197 The counter conveniently displays the number of ticks or transactions (depending on the chart) that need to pass for a new bar to start printing. The user can set the following indicator inputs. Volume type
FREE
Tik Tok
Ivan Simonika
The Tik Tok indicator was created on the basis of the original extreme search indicators, the indicator is well suited for determining a reversal or a big sharp jerk in one direction, thanks to it you will know when this happens it will notify you when a blue dot for buying red for sale appears. It basically uses the process of detecting the rate of change in price growth and allows you to find entry and exit points from the market. fundamental technical indicator that allows you to assess th
COSMOS4U Volume MT5
COSMOS4U - D. Vezeris & Co, L.P.
1 (1)
COSMOS4U Volume indicator facilitates your trade decisions. It gives confirmation of the running movement and market trends. It highlights current and past accumulation and distribution volumes, comparing them to moving average volume and the highest volume. In addition, it identifies and marks nuances as well as convergence and divergence patterns of bears and bulls in order to provide the market trend and price ranges. The supported features are as follows: Fast Volume Moving Average Slow Volu
UR VolumeTrend MT5
Krzysztof Jan Debski
Tendance volume UR   UR VolumeTrend est l'indicateur de volume le plus clair montrant la tendance en cours en termes de volume. Fonctionne parfaitement avec d'autres indicateurs, tout comme UR TrendExhaustion pour signaler les hauts et les bas locaux. Limité à seulement 2 paramètres - plus les valeurs sont élevées, plus les tendances seront longues. Les extrêmes de gradient montrent des épuisements possibles du volume pour attraper un renversement potentiel. Deux lignes - La tendance du vol
GRat Clusters  is an indicator that shows various data in the form of clusters on a price chart: volume, delta, ratio of sales and purchases, etc. It allows you to visually see the market profile in real time and on history at a given depth. Capabilities 1.8 types of cluster data: volume, delta, purchases   and sales , volume and delta, imbalance between sales and purchases , volume profile, delta profile, buy and sell profile. 2. A cluster period can be either any available in MT5 timeframe or
Cet indicateur est basé sur la transformée de Hartley discrète. L'utilisation de cette transformation vous permet d'appliquer différentes approches lors du traitement des séries chronologiques financières. Une caractéristique distinctive de cet indicateur est que ses lectures ne se réfèrent pas à un point sur le graphique, mais à tous les points de la période de l'indicateur. Lors du traitement d'une série temporelle, l'indicateur permet de sélectionner différents éléments de la série temporell
Market Marker MT5
Evgeny Shevtsov
3.8 (5)
The indicator displays peak levels of activity formed by the maximum volume, tracks the correlation of the candles on all timeframes (from the highest to the lowest one). Each volume level is a kind of key trading activity. The most important cluster is inside a month, week, day, hour, etc. Indicator operation features A volume level receives Demand status if the nearest volume level located to the left and above has been broken upwards. A volume level receives Supply status if the nearest vol
Introduction to Chart Pattern MT Chart Pattern MT is a chart pattern scanner to detect the triangle pattern, falling wedge pattern, rising wedge pattern, channel pattern and so on. Chart Pattern MT uses highly sophisticated chart pattern detection algorithm. However, we have designed it in the easy to use with intuitive user interface. Chart Pattern MT will show all the patterns in your chart in the most efficient format for your trading. You do not have to do tedious manual pattern detection an
Blahtech Supply Demand MT5
Blahtech Limited
4.57 (14)
Was: $299  Now: $99   Supply Demand uses previous price action to identify potential imbalances between buyers and sellers. The key is to identify the better odds zones, not just the untouched ones. Blahtech Supply Demand indicator delivers functionality previously unavailable on any trading platform. This 4-in-1 indicator not only highlights the higher probability zones using a multi-criteria strength engine, but also combines it with multi-timeframe trend analysis, previously confirmed swings
Mean Volume indicator for MT5
Renaud Herve Francois Candel
Mean Volume Most indicators are based on price analysis. This indicator is based on volume. Volume is overlooked piece of information in most trading systems. And this is a big mistake since volume gives important information about market participants. Mean Volume is an indicator that can be used to spot when volume is above average. It usually means that institutional traders are active. Peak in volume can be used to confirm an entry since increased volume can sustain the move in one or
Cet indicateur vous montrera les valeurs TP et SL (dans cette devise) que vous avez déjà définies pour chaque commande sur les graphiques (fermées à la ligne de transaction/commande) qui vous aideront beaucoup à estimer vos profits et pertes pour chaque commande. Et il vous montre également les valeurs PIP. le format affiché est "Valeurs monétaires de nos valeurs de profit ou de perte / PIPs". La valeur TP sera affichée en couleur verte et la valeur SL sera affichée en couleur rouge. Pour tou
M & W Pattern Pro is an advanced scanner for M and W patters , it uses extra filters to ensure scanned patterns are profitable. The indicator can be used with all symbols and time frames. The indicator is a non repaint indicator with accurate statistics calculations. To use , simply scan the most profitable pair using the statistics dashboard accuracy , then enter trades on signal arrow and exit at the TP and SL levels. STATISTICS : Accuracy 1 : This is the percentage of the times price hit
Description The indicator uses market profile theory to show the most relevant trading zones, on a daily basis. The zones to be shown are LVN (low volume nodes) and POC (point of control). An LVN zone is one which represents price areas with the least time or volume throughout the day. Typically, these areas indicate a supply or demand initiative, and in the future, they can turn into important breakout or retracement zones. A POC zone is one which represents price areas with the most time or vo
Market Profile Heat indicator  — is a classic Market Profile implementation that can show the price density over time, outlining the most important price levels, value area, and control value of a given trading session. This indicator can be attached to timeframes between M1 and D1 and will show the Market Profile for daily, weekly, monthly, or even intraday sessions. Lower timeframes offer higher precision. Higher timeframes are recommended for better visibility. It is also possible to use a f
WAPV Weis Wave Chart MT5
Eduardo Da Costa Custodio Santos
Le Weis Wave Chart pour MT5 est un indicateur de prix et de volume. La lecture du prix et du volume a été largement diffusée par Richard Demille Wyckoff sur la base des trois lois qu'il a créées : l'offre et la demande, la cause et l'effet et l'effort contre le résultat. En 1900 R.Wyckoff utilisait déjà le wave chart dans ses analyses. De nombreuses années plus tard, vers 1990, David Weis a automatisé le diagramme d'onde de R. Wyckoff et aujourd'hui nous vous apportons l'évolution du diagramme d
Introduction to Harmonic Volatility Indicator Harmonic Volatility Indicator is the first technical analysis applying the Fibonacci analysis to the financial volatility. Harmonic volatility indicator is another level of price action trading tool, which combines robust Fibonacci ratios (0.618, 0.382, etc.) with volatility. Originally, Harmonic Volatility Indicator was developed to overcome the limitation and the weakness of Gann’s Angle, also known as Gann’s Fan. We have demonstrated that Harmonic
True Weis Wave
Atila Goncalves Firmino
A version based on David Waves' description in his book 'Trade About to Happen' of his adaptation of the Wyckoff wave chart. The indicator directionally accumulates volume, adding to each brick or candle close, with color indication for up and down. it can be used it with tick or real volume, it also changes color when the accumulated value of the previous wave is exceeded, being the trade signal. Yellow color is used for doji candlestick, it will continue with accumulation without zero the sum
Mean Reversion Supply Demand Indicator Mean Reversion Supply Demand is the indicator to detect the important supply demand zone in your chart. The concept of supply demand trading relies on the quantity mismatching between buying and selling volumes in the financial market. Typically, supply demand zone serves to predict the turning point. The wave pattern, for any supply demand zone to work as an successful trade, looks like the price must touch the base zone, move away and then return to zone
Volume Profile For MT5
Abdelkhabir Yassine Alaoui
Volume Profile is a very useful indicator . it allows you to spot the price levels where important price action took place. It is similar to support and resistance levels but with a different logic. One of the first thing that traders mark up when analyzing a chart is support and resistance. Volume Profile can be used for doing that too. The indicator scans the defined number of previous bars and calculates the volume of activity at each price level. You can set the indicator to display t
FREE
Buy Sell Visual MTF V2 for MT5
Naththapach Thanakulchayanan
This MT5 indicator, Bull Bear Visual MTF V2, summarize the strength color graphic and percentages of power for both  Bull and Bear in current market emotion stage which will show you in multi timeframes (21) and sum of the total Bull and Bear power strength which is an important information for traders especially you can see all Bull and Bear power in visualized graphic easily, Hope it will be helpful tool for you for making a good decision in trading.
VWAP Indicator MT5
Kyra Nickaline Watson-gordon
Description : VWAP (Volume-Weighted Average Price) is the ratio of the value traded to total volume traded over a particular time horizon. It is a measure of the average price at which pair is traded over the trading horizon. Read More. All Symbols and All Timeframes are supported. Indicator Inputs :     VWAP Mode : Mode of VWAP Calculation. Options can be selected : Single,Session,Daily,Weekly,Monthly     Volumes : Real Volumes,Tick Volumes     Price Type : Used price for cal
Volume Analysis Trader looks at volume using a fixed average of volume. This averaging helps spot when volume is rising or declining. Also I have added volume spikes which are when volume suddenly is above the average. These help spot market reversals. This will hep a trader look for the following in their trading: Rising volume during a rally shows trend is strong. Falling volume on a rally shows trend is weakening. As a rule of thumb on daily charts if current volume is higher than yester
TPO Profile MT5
Kyra Nickaline Watson-gordon
Definition : TPO is a Time Price Opportunity. Instead of using bars or candles with an Open, High, Low, and Close price, each "bar" in a Market Profile is represented by horizontal bars against the price It is called Market Profile terminology. In other words time-price-opportunity (TPO) profiles are histograms of how much time was spent at each price within the span of the profile. By using a TPO chart, you are able to analyze the amount of trading activity, based on time, for each price leve
Les acheteurs de ce produit ont également acheté
Tout d'abord, il convient de souligner que ce système de trading est un indicateur non repeint, non redessiné et non retardé, ce qui le rend idéal pour le trading manuel et automatisé. Le "Système de Trading Smart Trend MT5" est une solution de trading complète conçue pour les traders débutants et expérimentés. Il combine plus de 10 indicateurs premium et propose plus de 7 stratégies de trading robustes, ce qui en fait un choix polyvalent pour différentes conditions de marché. Stratégie de suivi
Atomic Analyst MT5
Issam Kassas
5 (11)
Tout d'abord, il convient de souligner que cet indicateur de trading n'est ni repainting, ni redrawing et ne présente aucun délai, ce qui le rend idéal à la fois pour le trading manuel et automatisé. L'Analyste Atomique est un indicateur d'action sur les prix PA qui utilise la force et le momentum du prix pour trouver un meilleur avantage sur le marché. Équipé de filtres avancés qui aident à éliminer les bruits et les faux signaux, et à augmenter le potentiel de trading. En utilisant plusieur
Quantum Trend Sniper
Bogdan Ion Puscasu
5 (37)
Présentation       Quantum Trend Sniper Indicator   , l'indicateur révolutionnaire MQL5 qui transforme la façon dont vous identifiez et négociez les inversions de tendance ! Développé par une équipe de traders expérimentés avec une expérience commerciale de plus de 13 ans,       Indicateur Quantum Trend Sniper       est conçu pour propulser votre parcours de trading vers de nouveaux sommets grâce à sa manière innovante d'identifier les inversions de tendance avec une précision extrêmement élevée
FX Volume MT5
Daniel Stein
4.94 (17)
Obtenez votre mise à jour quotidienne du marché avec des détails et des captures d'écran via notre Morning Briefing ici sur mql5 et sur Telegram ! FX Volume est le PREMIER et SEUL indicateur de volume qui fournit un VRAI aperçu du sentiment du marché du point de vue d'un courtier. Il fournit des informations impressionnantes sur la façon dont les acteurs institutionnels du marché, comme les courtiers, sont positionnés sur le marché des changes, bien plus rapidement que les rapports COT. Voir c
FX Power MT5 NG
Daniel Stein
5 (4)
Obtenez votre mise à jour quotidienne du marché avec des détails et des captures d'écran via notre Morning Briefing ici sur mql5 et sur Telegram ! FX Power MT5 NG est la nouvelle génération de notre très populaire indicateur de force des devises, FX Power. Et qu'est-ce que ce compteur de force de nouvelle génération offre ? Tout ce que vous avez aimé de l'original FX Power PLUS Analyse de la force de l'OR/XAU Des résultats de calcul encore plus précis Périodes d'analyse configurables individuel
Top indicator for MT5   providing accurate signals to enter a trade without repainting! It can be applied to any financial assets:   forex, cryptocurrencies, metals, stocks, indices .  Watch  the video  (6:22) with an example of processing only one signal that paid off the indicator! MT4 version is here It will provide pretty accurate trading signals and tell you when it's best to open a trade and close it. Most traders improve their trading results during the first trading week with the help of
RelicusRoad Pro MT5
Relicus LLC
4.82 (22)
Maintenant 147 $ (augmentant à 499 $ après quelques mises à jour) - Comptes illimités (PCS ou Mac) Manuel d'utilisation RelicusRoad + Vidéos de formation + Accès au groupe Discord privé + Statut VIP UNE NOUVELLE FAÇON DE REGARDER LE MARCHÉ RelicusRoad est l'indicateur de trading le plus puissant au monde pour le forex, les contrats à terme, les crypto-monnaies, les actions et les indices, offrant aux traders toutes les informations et tous les outils dont ils ont besoin pour rester renta
L'indicateur de Carré Gann est un puissant outil d'analyse du marché basé sur l'article "Formule Mathématique pour les Prédictions de Marché" écrit par W.D. Gann. Cet outil utilise des concepts mathématiques et des théories de Gann pour réaliser une analyse précise du marché. Il utilise les carrés de 144, 90, 52 et aussi le carré de 9. De plus, il intègre la méthode du  pour le carré de 9 et sa relation avec les canaux et le modèle en étoile de ce carré. Manuel d'Utilisateur et Application : Ava
TPSpro TRENDPRO  - is a trend indicator that automatically analyzes the market and provides information about the trend and each of its changes, as well as giving signals for entering trades without redrawing! The indicator uses each candle, analyzing them separately. referring to different impulses - up or down impulse. Exact entry points into transactions for currencies, crypto, metals, stocks, indices!  -  Version MT4                  DETAILED DESCRIPTION        /       TRADING SETUPS       
Advanced Supply Demand MT5
Bernhard Schweigert
4.53 (15)
La meilleure solution pour tout commerçant débutant ou expert ! Cet indicateur est un outil de trading unique, de haute qualité et abordable car nous avons intégré un certain nombre de fonctionnalités propriétaires et une nouvelle formule. Avec cette mise à jour, vous pourrez afficher des zones à double horaire. Vous pourrez non seulement afficher un TF plus élevé, mais afficher les deux, le graphique TF, PLUS le TF supérieur : AFFICHAGE DES ZONES NICHÉES. Tous les traders Supply Demand vont ado
A key element in trading is zones or levels from which decisions to buy or sell a trading instrument are made. Despite attempts by major players to conceal their presence in the market, they inevitably leave traces. Our task was to learn how to identify these traces and interpret them correctly. Reversal First Impulse levels (RFI)   -  Version MT4                  INSTRUCTIONS                 RUS                 ENG                         R ecommended to use with an indicator   -  TREND PRO  
Présentation       Quantum Breakout PRO   , l'indicateur révolutionnaire MQL5 qui transforme la façon dont vous négociez les zones d'évasion ! Développé par une équipe de traders expérimentés avec une expérience commerciale de plus de 13 ans,       Évasion quantique PRO       est conçu pour propulser votre parcours commercial vers de nouveaux sommets grâce à sa stratégie de zone de discussion innovante et dynamique. Quantum Breakout Indicator vous donnera des flèches de signalisation sur le
XQ Indicator MetaTrader 5
Marzena Maria Szmit
5 (1)
Step into the realm of Forex trading with confidence and precision using XQ, a cutting-edge Forex indicator designed to elevate your trading game to unprecedented heights. Whether you're a seasoned trader or just stepping into the world of currency exchange, XQ Forex Indicator empowers you with the insights and signals needed to make informed trading decisions. The signal conditions are a combination of three indicators, and XQ Forex Indicator only display  medium and long-term trends . The ind
MetaBands M5
Vahidreza Heidar Gholami
4.67 (3)
MetaBands uses powerful and unique algorithms to draw channels and detect trends so that it can provide traders with potential points for entering and exiting trades. It’s a channel indicator plus a powerful trend indicator. It includes different types of channels which can be merged to create new channels simply by using the input parameters. MetaBands uses all types of alerts to notify users about market events. Features Supports most of the channel algorithms Powerful trend detection algorith
Malaysian SNR Levels
Matthias Horst Pieroth
This indicator can be used to display Support and Resistance levels according to  the  Malaysian SNR concept , in which Support and Resistance are exact levels of a line chart. Malaysian SNR There are 3 different horizontal levels in Malaysian SNR: A-Level : This level is located at the peak of this line chart. (shape looks like the letter A) V-Level : Level at the valley of a line chart, (shape looks like the letter V) Gap-Leve l: This level is located at the Close/Open gap between two cand
The Volume by Price Indicator for MetaTrader 5 features Volume Profile and Market Profile TPO (Time Price Opportunity). Get valuable insights out of currencies, equities and commodities data. Gain an edge trading financial markets. Volume and TPO histogram bar and line charts. Volume Footprint charts. TPO letter and block marker charts including split structures. Versatile segmentation and compositing methods. Static, dynamic and flexible ranges with relative and/or absolute visualizations. Lay
TPA True Price Action indicator reveals the true price action of the market makers through 100% non-repainting signals strictly at the close of a candle! TPA shows entries and re-entries, every time the bulls are definitely stronger than the bears and vice versa. Not to confuse with red/green candles. The shift of power gets confirmed at the earliest stage and is ONE exit strategy of several. There are available now two free parts of the TPA User Guide for our customers. The first "The Basics"
Owl Smart Levels MT5
Sergey Ermolov
4.47 (36)
Version MT4   |  FAQ L' indicateur Owl Smart Levels est un système de trading complet au sein d'un seul indicateur qui comprend des outils d'analyse de marché populaires tels que les fractales avancées de Bill Williams , Valable ZigZag qui construit la structure d'onde correcte du marché et les niveaux de Fibonacci qui marquent les niveaux exacts d'entrée. sur le marché et les endroits où prendre des bénéfices. Description détaillée de la stratégie Mode d'emploi de l'indicateur Conseiller-Assis
Golden Gate Algo MT5
James David Lane
4 (6)
40% DE RÉDUCTION POUR NOËL ! AUGMENTATION DES PRIX À 250 $ LE 1er JANVIER ! Présentation de GoldenGate Entries : une solution de trading de pointe ! Découvrez une approche révolutionnaire du trading avec GoldenGate Entries (GGE), un indicateur avancé conçu pour améliorer votre expérience de trading. GGE offre un ensemble complet de fonctionnalités pour donner aux utilisateurs la précision et la confiance nécessaires dans leurs décisions de trading. Paires : Toutes (FX - Matières premières
Boom and Crash Spike Detector v1.0 Boom and Crash spike detector prints Down non repaint Arrow for catching crash spikes and Up non repaint arrow for catching boom spikes.  It is suitable for 1M time frame for majorly crash500 and Boom 500.  When the Red arrow prints in a red zone moving averages, it indicates high probability of crash spikes downwards, likewise, blue arrow printing in a blue zone of moving average, it indicates high probability of boom spikes.  Its pretty straight forward since
Bill Williams Advanced
Siarhei Vashchylka
5 (3)
Bill Williams Advanced is designed for automatic chart analysis using Bill Williams' "Profitunity" system. The indicator analyzes four timeframes at once. Manual (Be sure to read before purchasing) Advantages 1. Automatically analyzes the chart using the "Profitunity" system of Bill Williams. The found signals are placed in a table in the corner of the screen. 2. Equipped with a trend filter based on the Alligator indicator. Most of the system signals are recommended to be used only accordi
TrendMaestro5
Stefano Frisetti
note: this indicator is for METATRADER4, if you want the version for METATRADER5 this is the link:  https://www.mql5.com/it/market/product/108106 TRENDMAESTRO recognizes a new TREND in the bud, he never makes mistakes. The certainty of identifying a new TREND is priceless. DESCRIPTION TRENDMAESTRO identifies a new TREND in the bud, this indicator examines the volatility, volumes and momentum to identify the moment in which there is an explosion of one or more of these data and therefore the mome
- 50% off - Telegram group : https://t.me/+5RIceImV_OJmNDA0 MT4 version : https://www.mql5.com/en/market/product/84526?source=Unknown%3Ahttps%3A%2F%2Fwww.mql5.com%2Fen%2Fmarket%2Fmy Master Pullback is a complete system that gives unique trading opportunities and a clear indication of the market: trend, signals as well as stop loss and take profit levels. This system has been designed to be as simple as possible and detects extreme overbought and oversold zones, support and resistance levels, a
Professional Scalping Tool on Deriv Attention! The indicator will be sold in limited quantities!!! Description: This trading indicator is designed for professional traders focused on scalping. Designed with the market in mind, it provides highly accurate spike trading signals. It works on the M1 timeframe and supports the following symbols: Boom 300 Index, Boom 500 Index, Boom 1000 Index, Crash 300 Index, Crash 500 Index, Crash 1000 Index. Functional Features: - Direction: - Trading is ca
Eng Gold
Ely Alkrar Xshkaky
ENG-GOLD Scalper It is an auxiliary indicator that identifies potential targets and determines the place of entry with a stop loss that works on Heiken Ashi candles  The green lines are usually the targets, the red lines are the stop loss, and the yellow lines are the entry location.  This file is recognized on small and medium frames, usually less than the watch frame I highly recommend using XAUUSD US100 US30 USOIL 
Gartley Hunter Multi
Siarhei Vashchylka
5 (5)
Gartley Hunter Multi - An indicator for searching for harmonic patterns simultaneously on dozens of trading instruments and on all classic timeframes: (m1, m5, m15, m30, H1, H4, D1, Wk, Mn). Manual (Be sure to read before purchasing) | Version for MT4 Advantages 1. Patterns: Gartley, Butterfly, Shark, Crab. Bat, Alternate Bat, Deep Crab, Cypher 2. Simultaneous search for patterns on dozens of trading instruments and on all classic timeframes 3. Search for patterns of all possible sizes. Fr
Quantum Heiken Ashi PRO MT5
Bogdan Ion Puscasu
4.5 (8)
Présentation du   Quantum Heiken Ashi PRO Conçues pour fournir des informations claires sur les tendances du marché, les bougies Heiken Ashi sont réputées pour leur capacité à filtrer le bruit et à éliminer les faux signaux. Dites adieu aux fluctuations de prix déroutantes et bonjour à une représentation graphique plus fluide et plus fiable. Ce qui rend le Quantum Heiken Ashi PRO vraiment unique, c'est sa formule innovante, qui transforme les données traditionnelles des chandeliers en barres col
Gartley Hunter MT5
Siarhei Vashchylka
5 (13)
Gartley Hunter - An indicator for searching for harmonic patterns (Gartley patterns) and their projections. The indicator is equipped with a system of alerts and push notifications. Manual (Be sure to read before purchasing) | Version for MT4 Advantages 1. 12 harmonic patterns: 7 classical and 5 exotic. New patterns will be added as the indicator develops. 2. Constant automatic search for harmonic patterns. The indicator is capable of finding from the smallest to the largest patterns. 3. Autom
PipFinite Breakout EDGE MT5
Karlo Wilson Vendiola
4.84 (114)
The Missing Edge You Need To Catch Breakouts Like A Pro. Follow a step-by-step system that detects the most powerful breakouts! Discover market patterns that generate massive rewards based on a proven and tested strategy. Unlock Your Serious Edge Important information here www.mql5.com/en/blogs/post/723208 The Reliable Expert Advisor Version Automate Breakout EDGE signals using "EA Breakout EDGE" Click Here Have access to the game changing strategy that will take your trading to the n
Anchored VWAP with Alert MT5
Trade The Volume Waves Single Member P.C.
What is the Volume Weighted Average Price (VWAP)? The volume weighted average price (VWAP) is a trading benchmark used by traders that gives the average price an instrument has traded at throughout the day, based on both volume and price.  It is important because it provides traders with insight into both the trend and value of the instrument. What is the Difference between VWAP and AVWAP? While VWAP is having as starting point the beggining of the day,week,month etc. in the AVWAP you can p
Plus de l'auteur
PTS Precision Index Oscillator V2
PrecisionTradingSystems
5 (1)
L'oscillateur de l'indice de précision (Pi-Osc) de Roger Medcalf de Precision Trading Systems La version 2 a été soigneusement recodée pour être ultra-rapide à charger sur votre graphique, et quelques autres améliorations techniques ont été incorporées pour améliorer l'expérience. Le Pi-Osc a été créé pour fournir des signaux de synchronisation de trading précis conçus pour trouver des points d'épuisement extrêmes, les points auxquels les marchés sont contraints d'aller simplement pour élim
PTS - Divergence Buy Finder par Precision Trading Systems Le Precision Divergence Finder a été conçu pour trouver les points bas du marché avec une précision extrême, et il le fait fréquemment. En analyse technique, l'art de choisir les creux est généralement beaucoup plus facile que de choisir les sommets, et cet outil est précisément conçu pour cette tâche. Après avoir identifié une divergence haussière, il est sage d'attendre que la tendance s'inverse avant d'acheter. Vous pouvez utilise
L'indicateur de vente PTS Divergence Finder de Roger Medcalf - Precision Trading Systems. Cet indicateur ne fournit que des indications baissières de vente. Tout d'abord, on m'a souvent demandé pourquoi je n'avais pas fourni un indicateur de divergence de vente tout en fournissant volontiers un outil de recherche de divergence de signaux d'achat depuis de nombreuses années. J'ai répondu que les divergences de vente sont moins fiables que les divergences d'achat, ce qui est toujours vrai. Certain
L'oscillateur de l'indice de précision (Pi-Osc) de Roger Medcalf de Precision Trading Systems La version 2 a été soigneusement recodée pour être ultra-rapide à charger sur votre graphique, et quelques autres améliorations techniques ont été incorporées pour améliorer l'expérience. Le Pi-Osc a été créé pour fournir des signaux de synchronisation de trading précis conçus pour trouver des points d'épuisement extrêmes, les points auxquels les marchés sont contraints d'aller simplement pour élim
Demand Index
PrecisionTradingSystems
Code PTS Demand Index par Precision Trading Systems Le Demand Index a été créé par James Sibbet et utilise un code complexe pour faciliter l'interprétation du volume et du prix en tant que combinaison. Comprendre les volumes n'est jamais une tâche facile, mais ce magnifique morceau de programmation simplifie certainement les choses. Il existe plusieurs façons dont cet indicateur peut bénéficier aux traders et aux investisseurs. Divergences (en tant qu'indicateur de premier plan) Apr
PTS - Divergence Buy Finder par Precision Trading Systems Le Precision Divergence Finder a été conçu pour trouver les points bas du marché avec une précision extrême, et il le fait fréquemment. En analyse technique, l'art de choisir les creux est généralement beaucoup plus facile que de choisir les sommets, et cet outil est précisément conçu pour cette tâche. Après avoir identifié une divergence haussière, il est sage d'attendre que la tendance s'inverse avant d'acheter. Vous pouvez utilise
Filtrer:
Aucun avis
Répondre à l'avis