ATR Zone
- Indicateurs
- Sergey Ermolov
- Version: 1.1
- Activations: 10
ATR est un indicateur important pour tout marché financier. L'abréviation ATR correspond à Average True Range. Cet indicateur est un instrument permettant de déterminer la volatilité du marché, ce qui est son objectif direct. ATR indique le mouvement moyen du prix pour la période de temps sélectionnée.
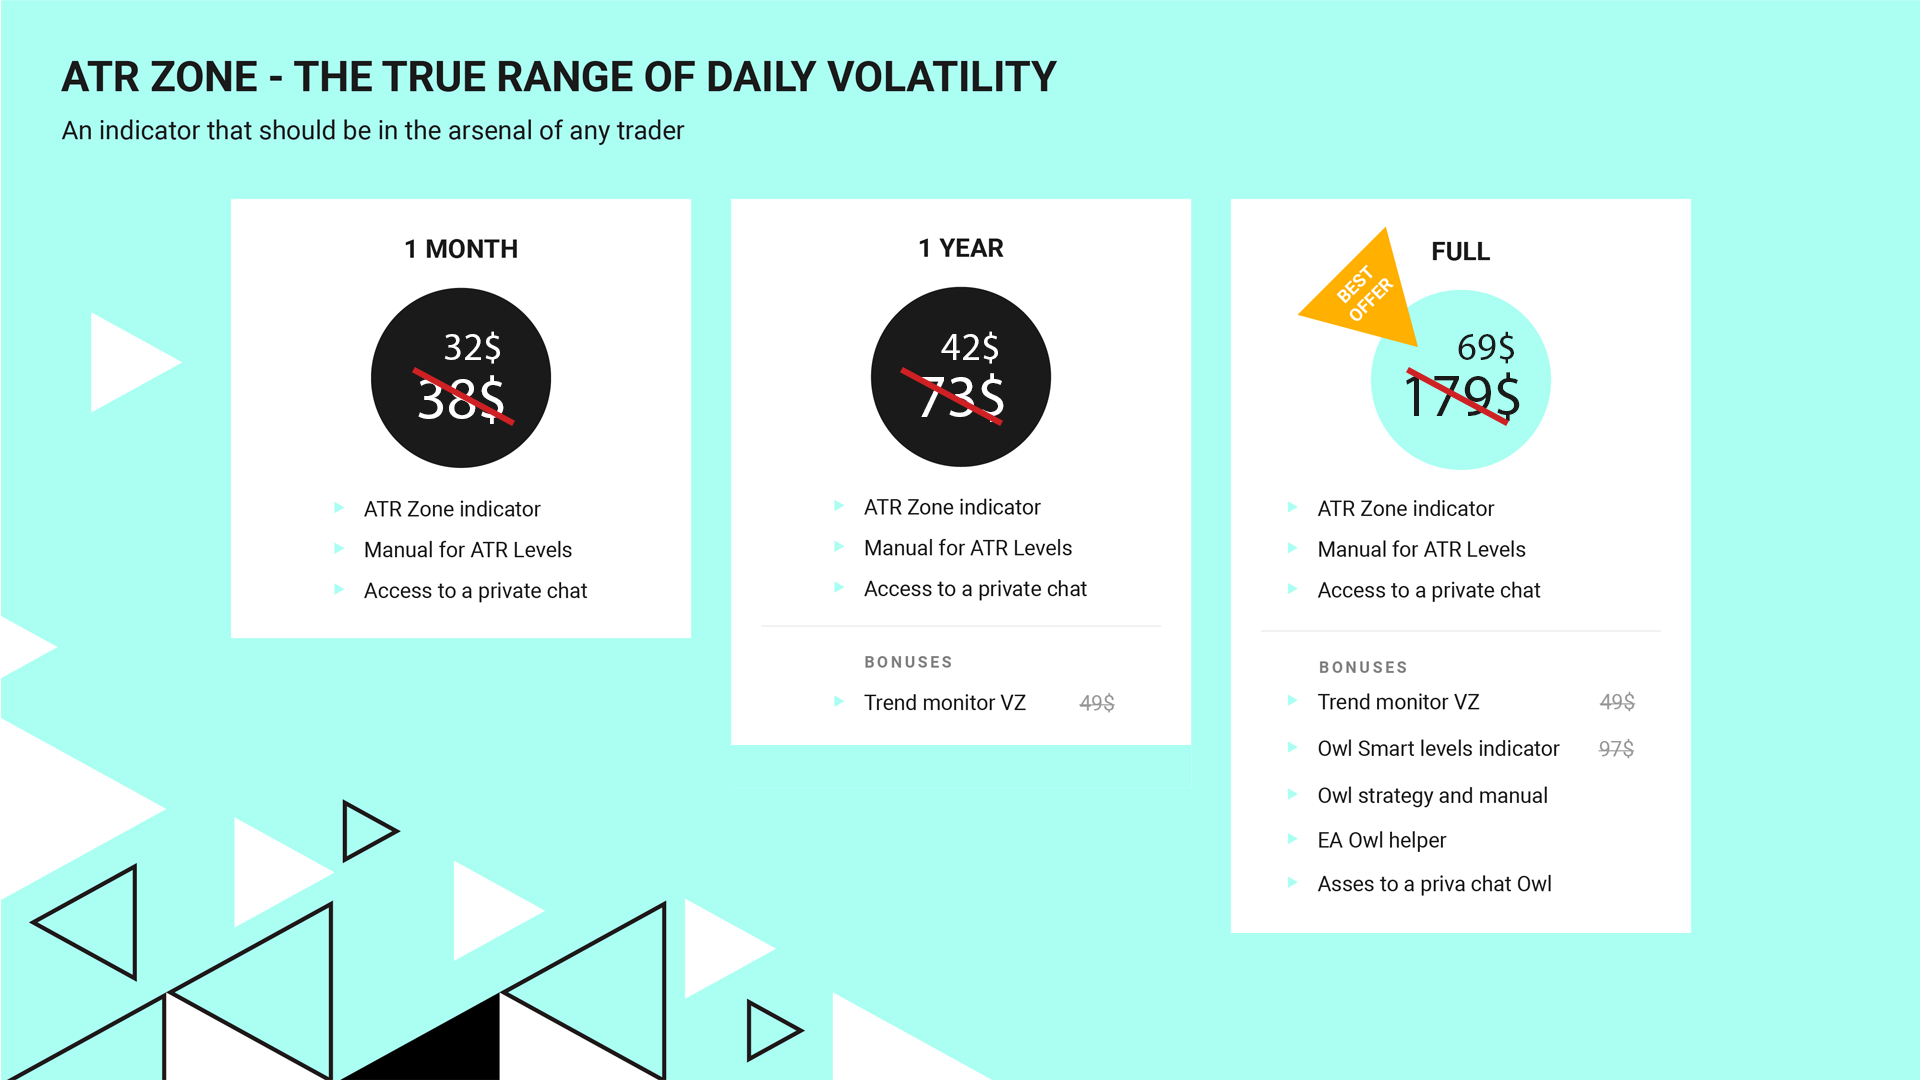
Le prix initial de l'indicateur est de 63$. Le prix augmentera toutes les 10 ventes jusqu'à 179$
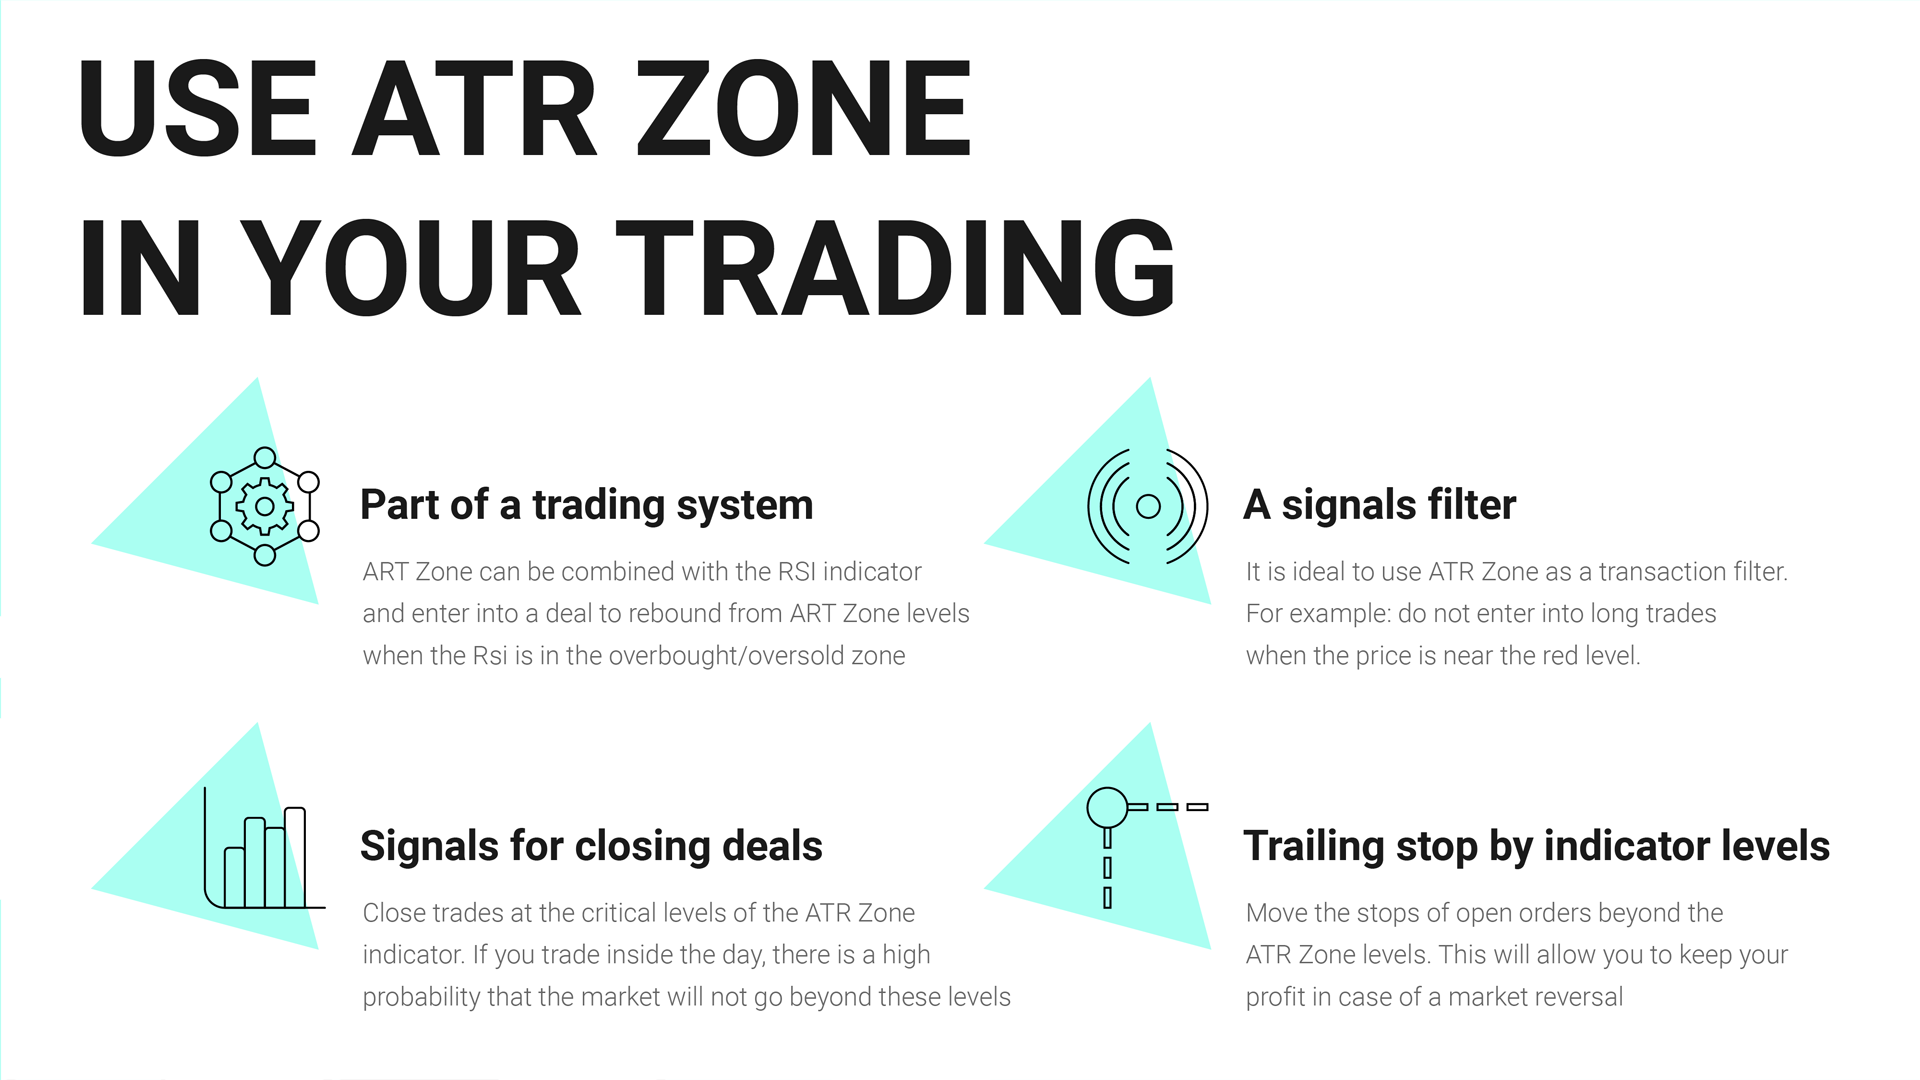
L'indicateur ATR original est présent dans de nombreux programmes de trading. L'indicateur ATR n'est pas très informatif, j'ai donc modifié ses données et j'ai obtenu l'indicateur ATR Zone. L'indicateur ATR Zone affiche des niveaux sur le graphique, qui sont plus compréhensibles et plus pratiques pour prendre des décisions de trading. En outre, j'ai ajouté quelques recommandations importantes sur le calcul de l'indicateur de la part du gourou du trading Alexander Gerchik.
Après l'achat, écrivez-moi dans les messages privés et vous recevrez :
- Un manuel avec des instructions détaillées pour l'indicateur
- Indicateur Trend Monitor
- Indicateur Owl Smart Levels
- Expert Advisor Owl Helper
- Un accès au chat privé des utilisateurs
Comment l'indicateur est-il calculé ?
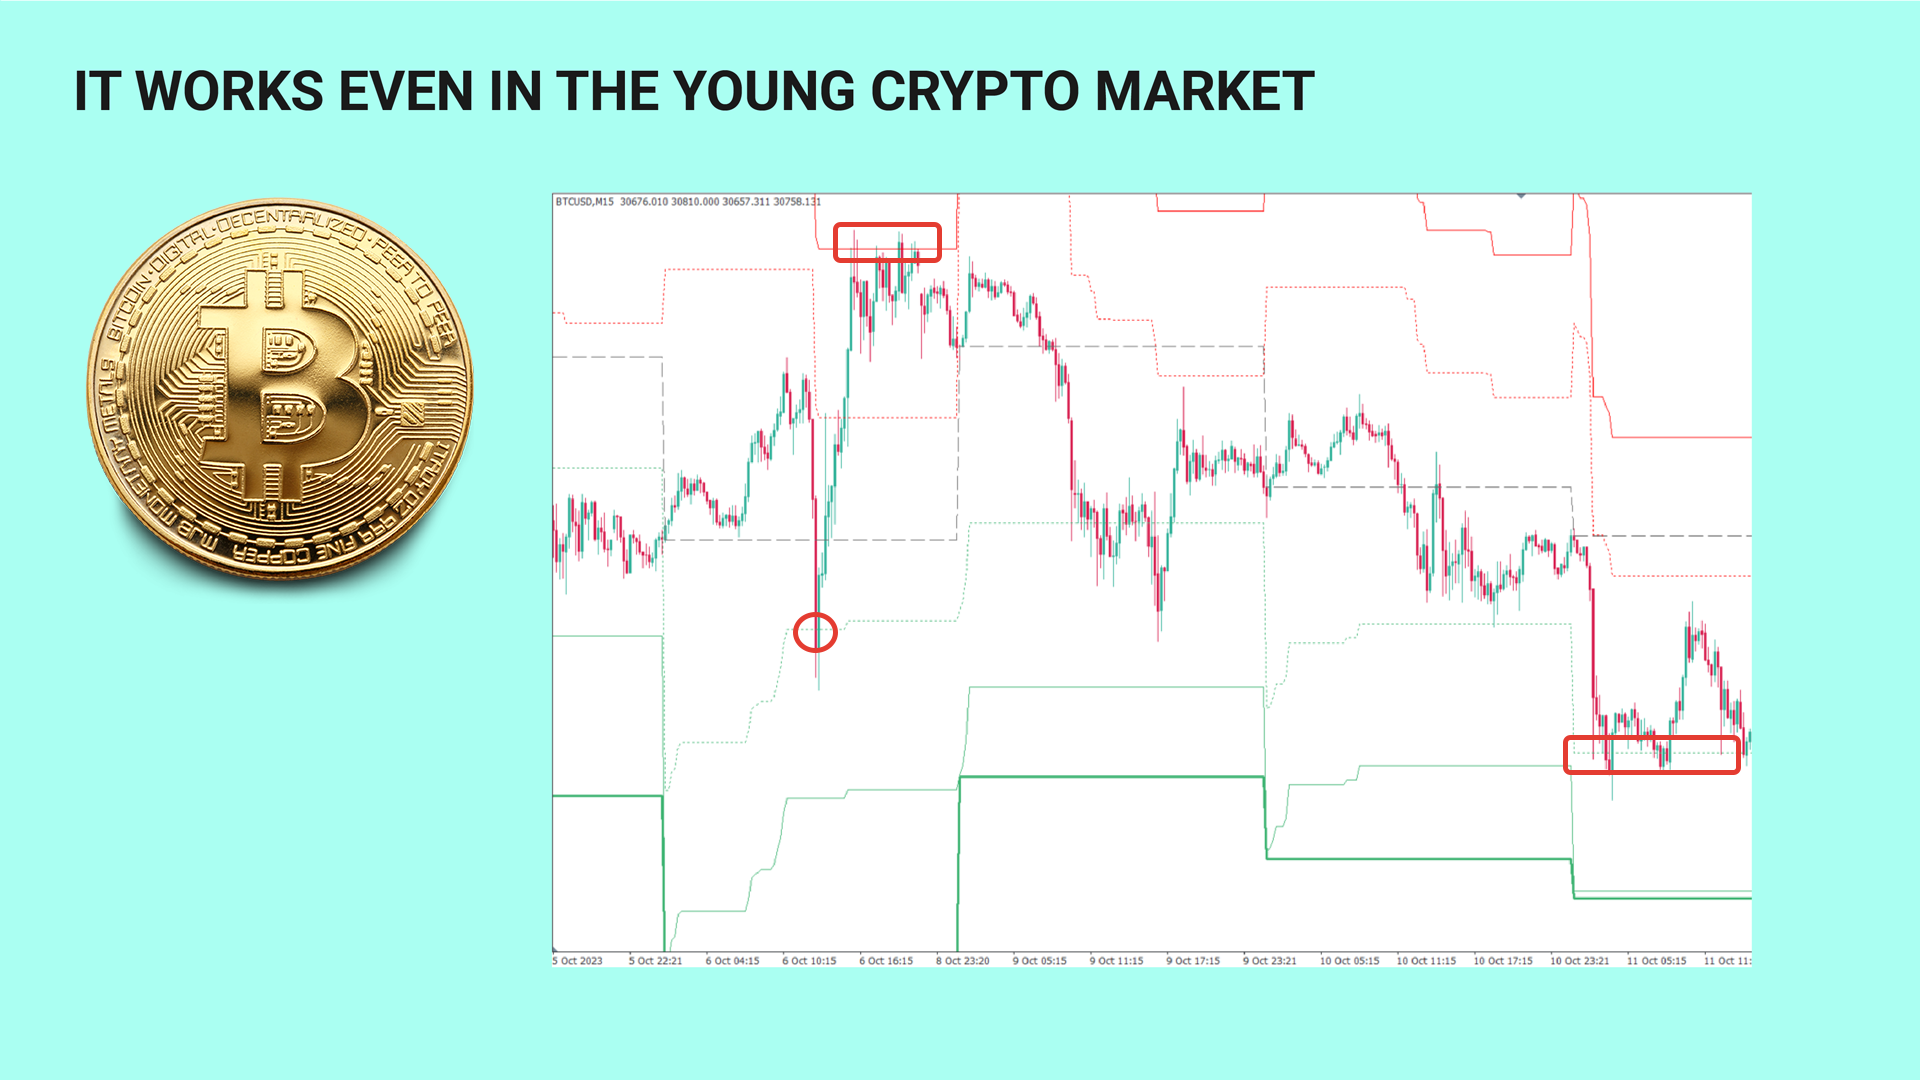
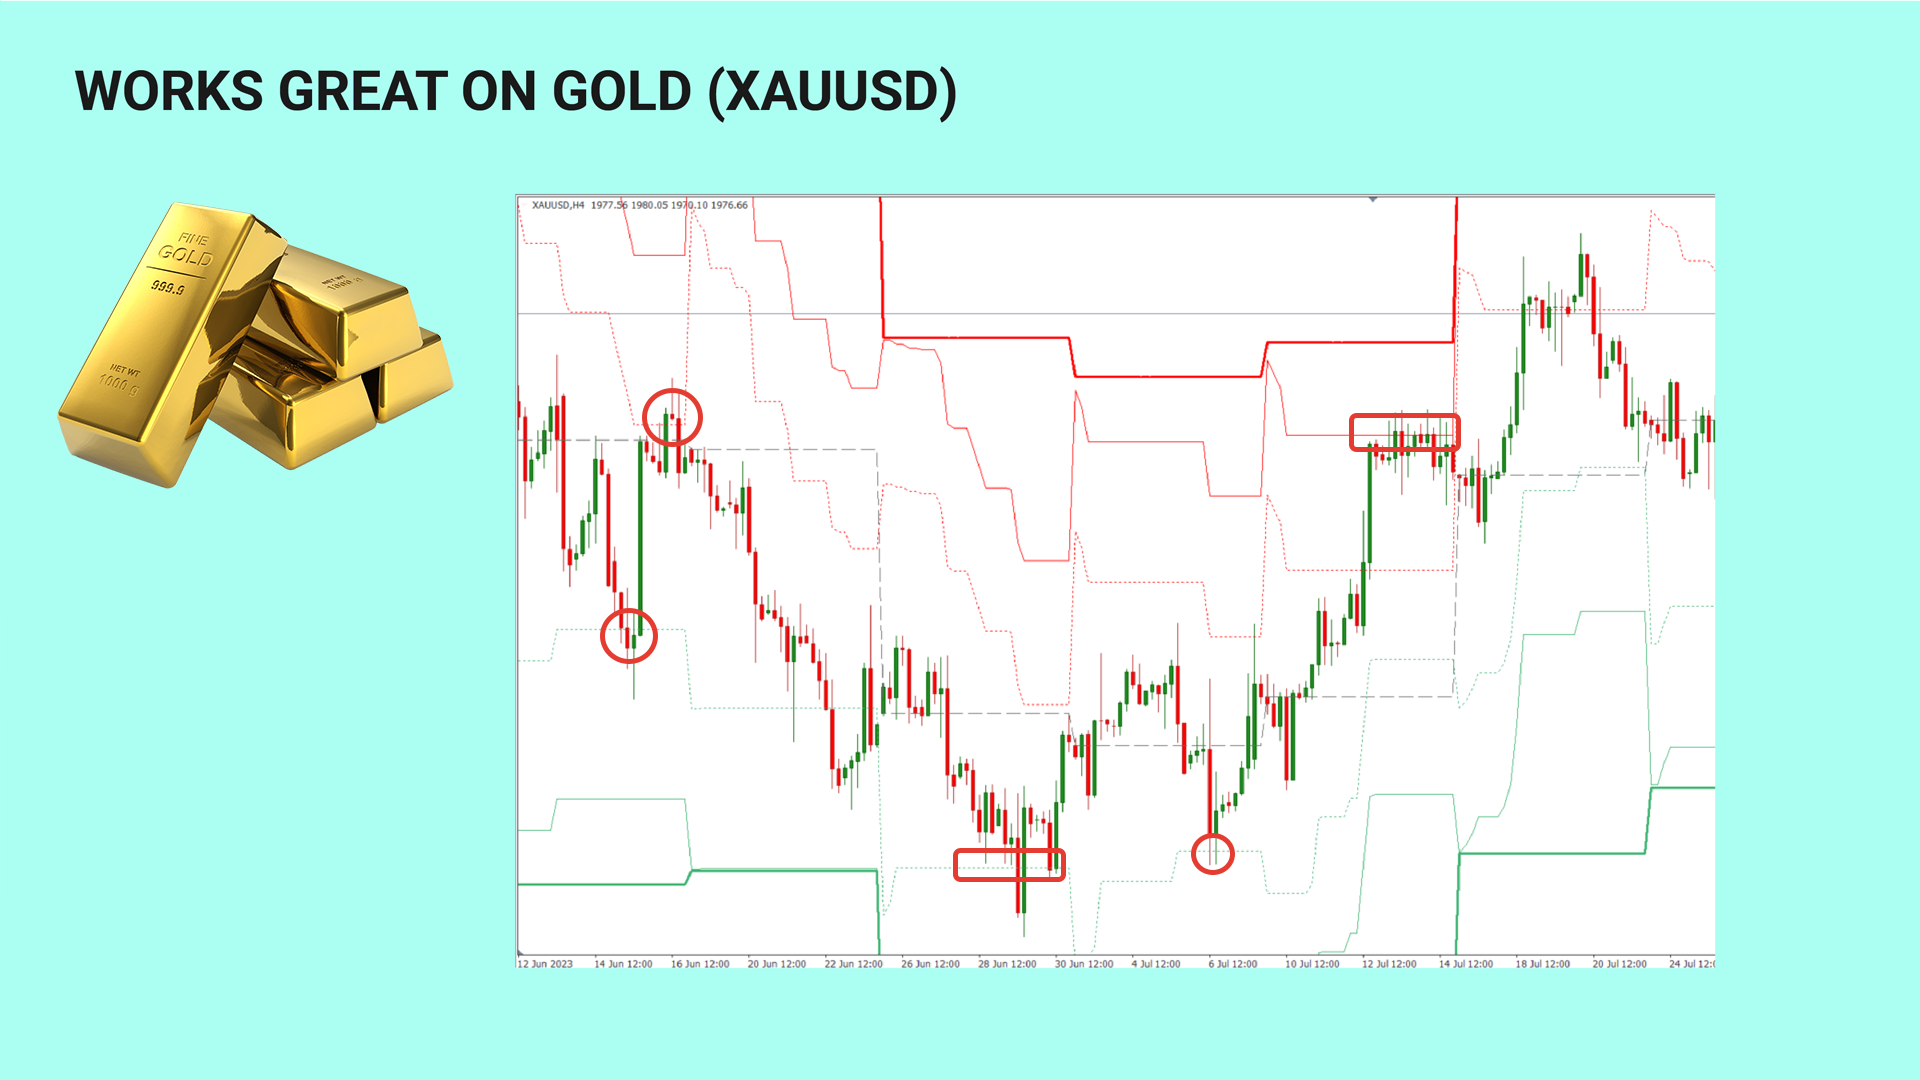
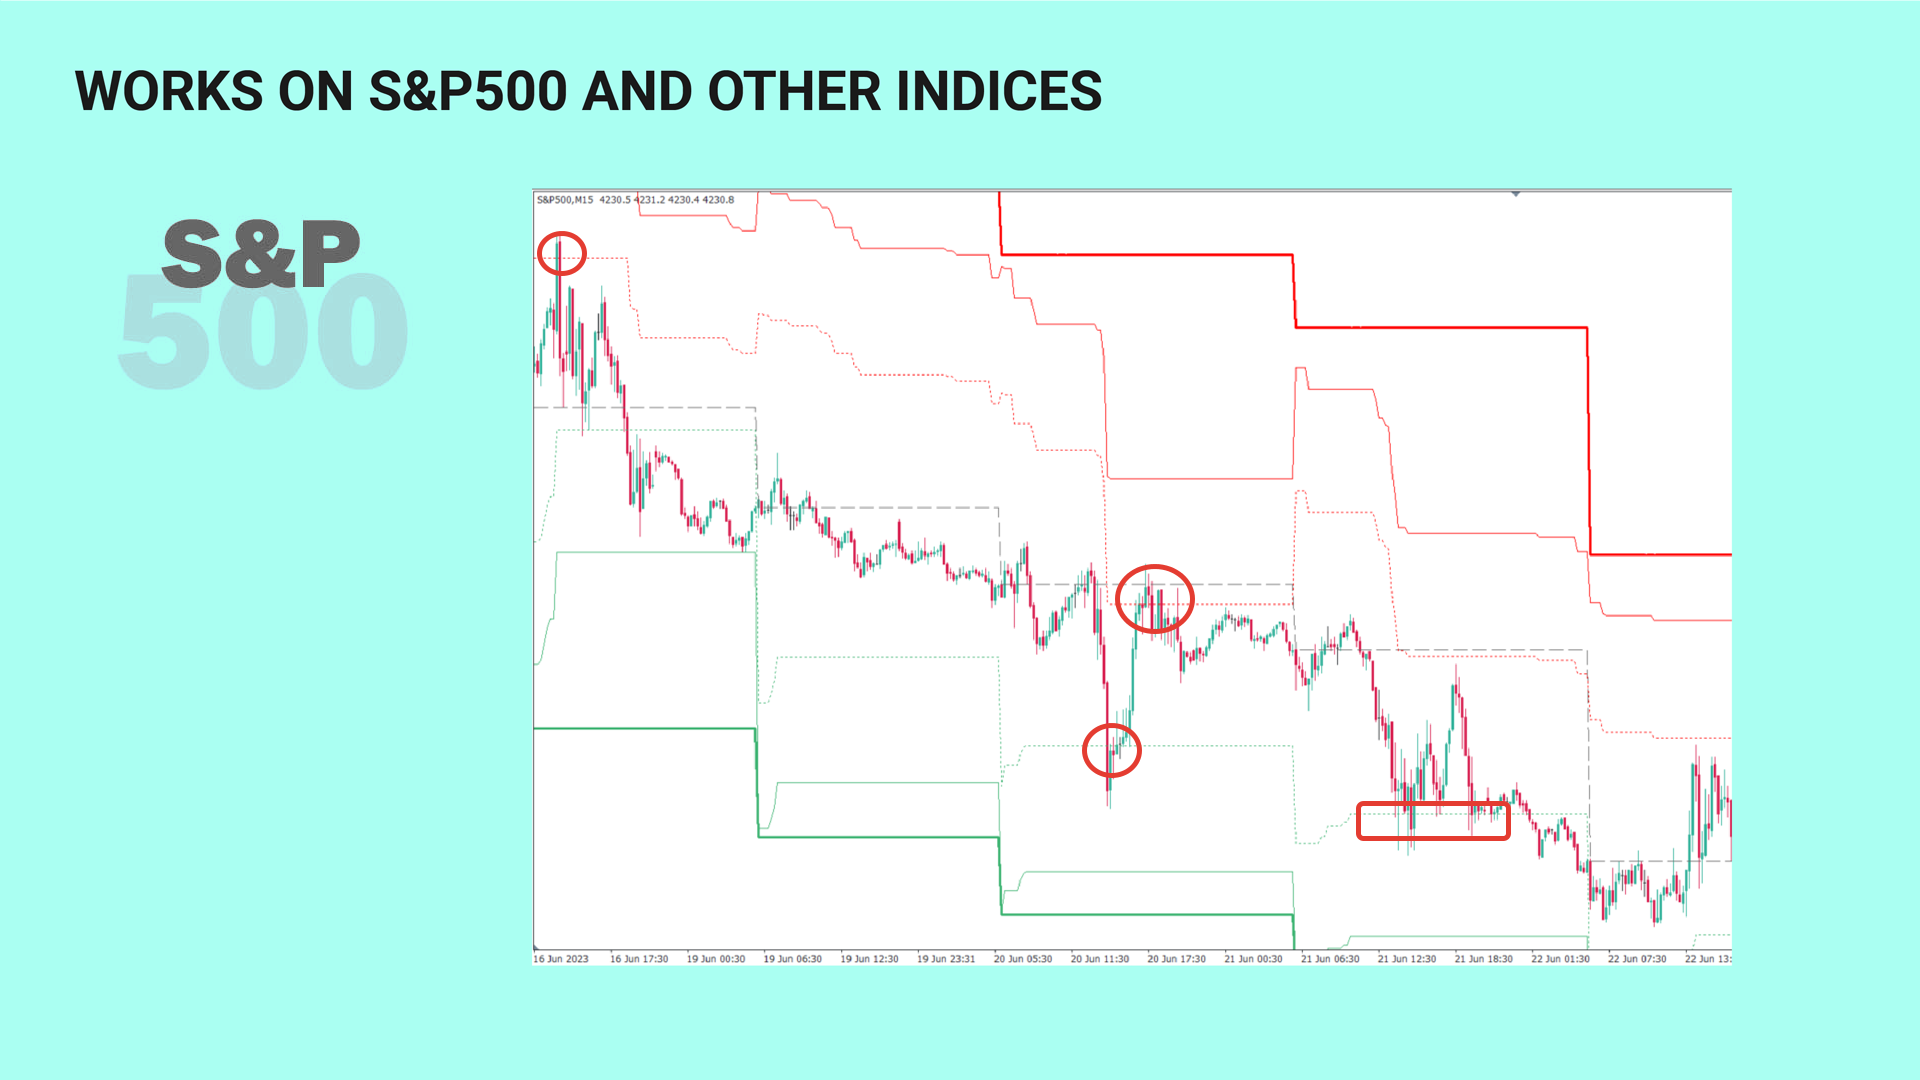
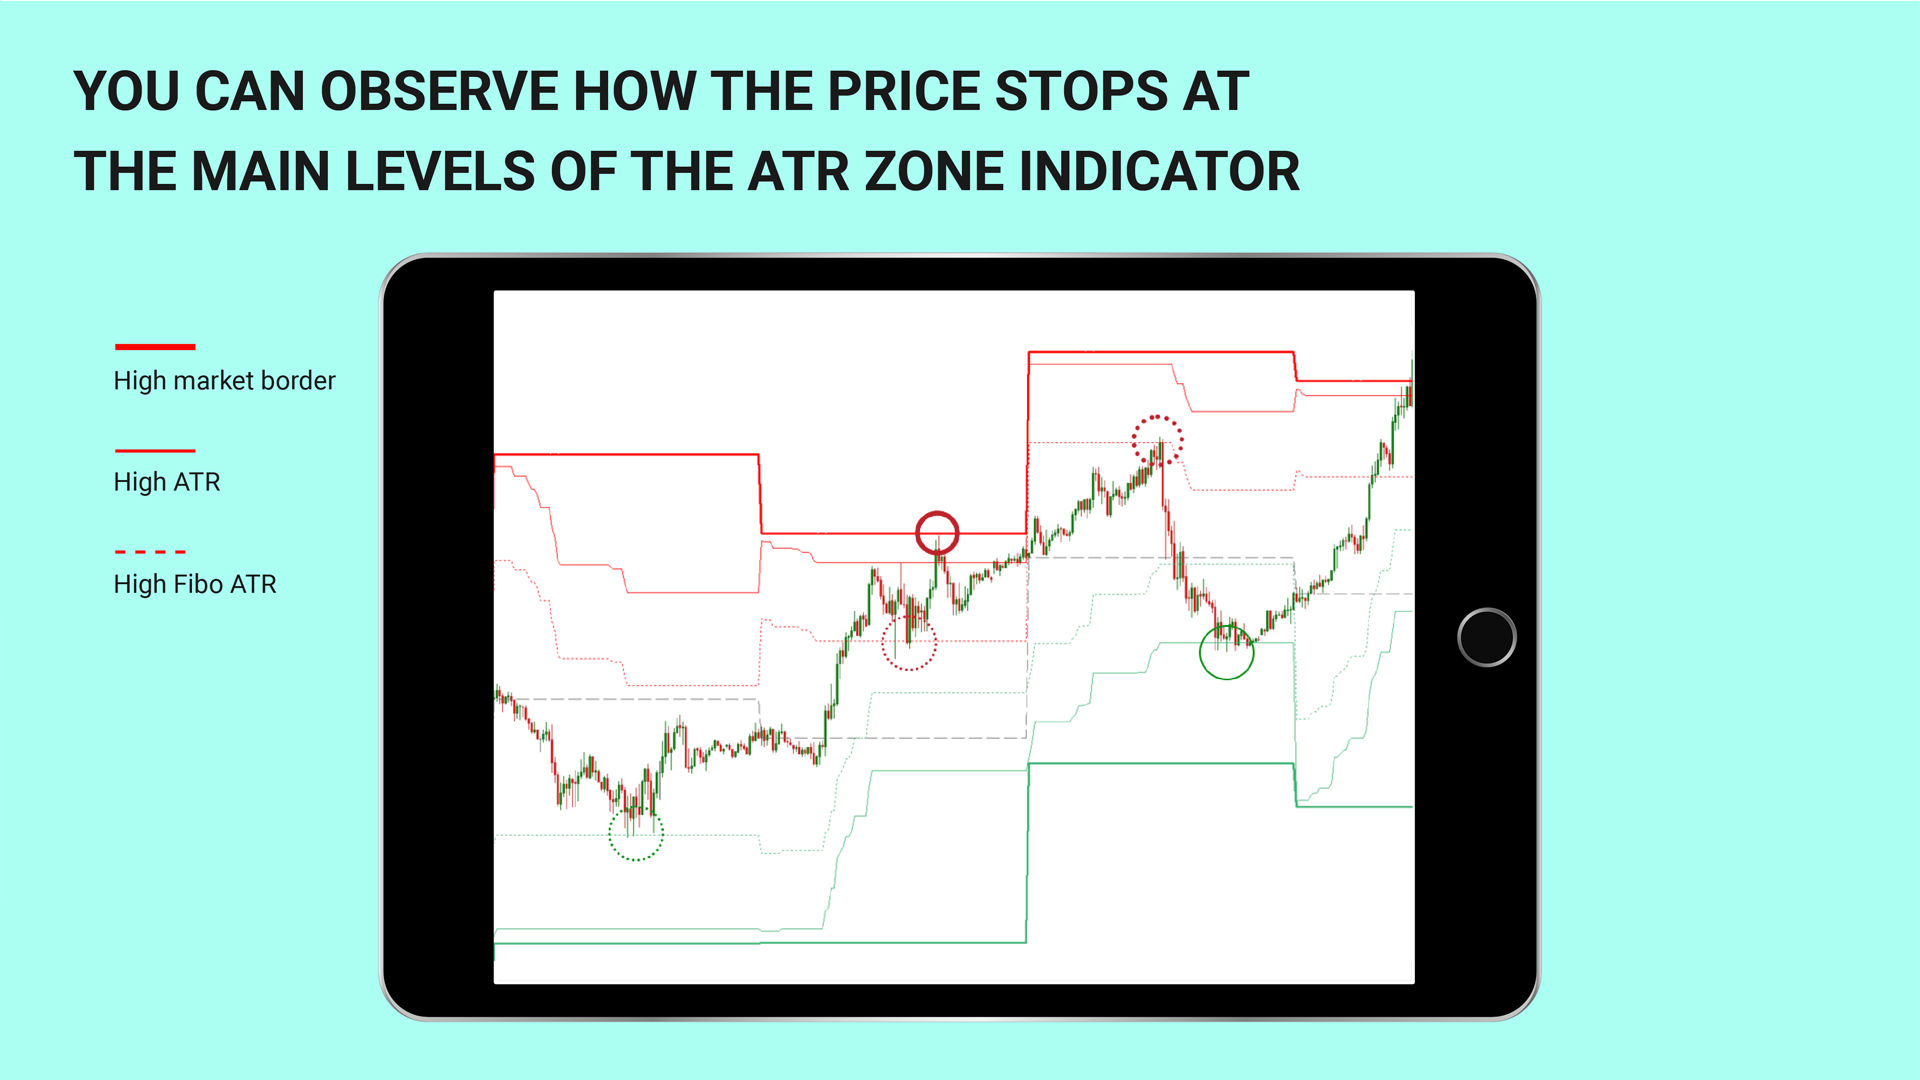
L'indicateur le plus important dont nous avons vraiment besoin dans le trading intraday est le mouvement de prix quotidien moyen. En connaissant le mouvement moyen du prix quotidien, nous pouvons fixer les limites (niveaux de trading) sur le graphique, à partir desquelles le marché perdra de l'énergie. Ces niveaux sont marqués par l'indicateur ATR Zone avec des lignes rouges et vertes en gras.
IMPORTANT !!! L'indicateur ATR Zone calcule la fourchette quotidienne moyenne du mouvement des prix (compte les chandeliers D1), et construit les niveaux sur une timeframe plus petite.
Ainsi, même sur timeframe M1, M5, M15, H1, vous obtenez les niveaux de la fourchette quotidienne moyenne, ce qui est plus instructif lors du trading intrajournalier.
Plus tôt, j'ai parlé des ajouts importants à l'indicateur. Le célèbre trader Alexander Gerchik recommande d'utiliser la valeur moyenne du mouvement des prix sur les 5 derniers jours, mais vous ne devez pas prendre en compte les barres quotidiennes extrêmement grandes et extrêmement petites. J'ai écouté sa recommandation et appliqué cette règle à l'indicateur ATR Zone.
Paramètres de l'indicateur ATR Zone.
- The beginning of the day - le début du compte à rebours de l'indicateur.
Je pense qu'il est erroné de prendre le début du compte à rebours à 00:00 heure du jour en cours. Il est plus correct de prendre comme point de départ l'heure du début de la séance de trading dans l'une des zones de trading. Dans mes trading, je prends comme point de départ l'heure de début de la séance de trading européenne.
- ATR averaging period - nombre de jours pour calculer la valeur moyenne du mouvement quotidien des prix.
- Exclude the bar more - le coefficient des grandes barres, qui exclut les barres trop grandes du calcul de la valeur moyenne de l'ATR (la valeur 2 signifie que les barres, qui sont plus de 2 fois l'ATR moyen, ne participent pas aux calculs).
- Exclude smaller bars - le coefficient des petites barres, qui exclut les barres trop petites du calcul de la valeur moyenne de l'ATR ( la valeur de 0,5 signifie que les barres qui sont inférieures à 50 % de l'ATR moyen ne participent pas aux calculs).
- Fibo level - niveau de Fibonacci pour la construction de niveaux supplémentaires (niveaux en pointillés)
- The number of bars to calculate - nombre de barres à gauche à afficher sur le graphique
Je suis Sergey Ermolov, suivez-moi pour les mises à jour !