• Aperçu
  • Avis
  • Commentaires

Cobra Levels

Niveaux Cobra

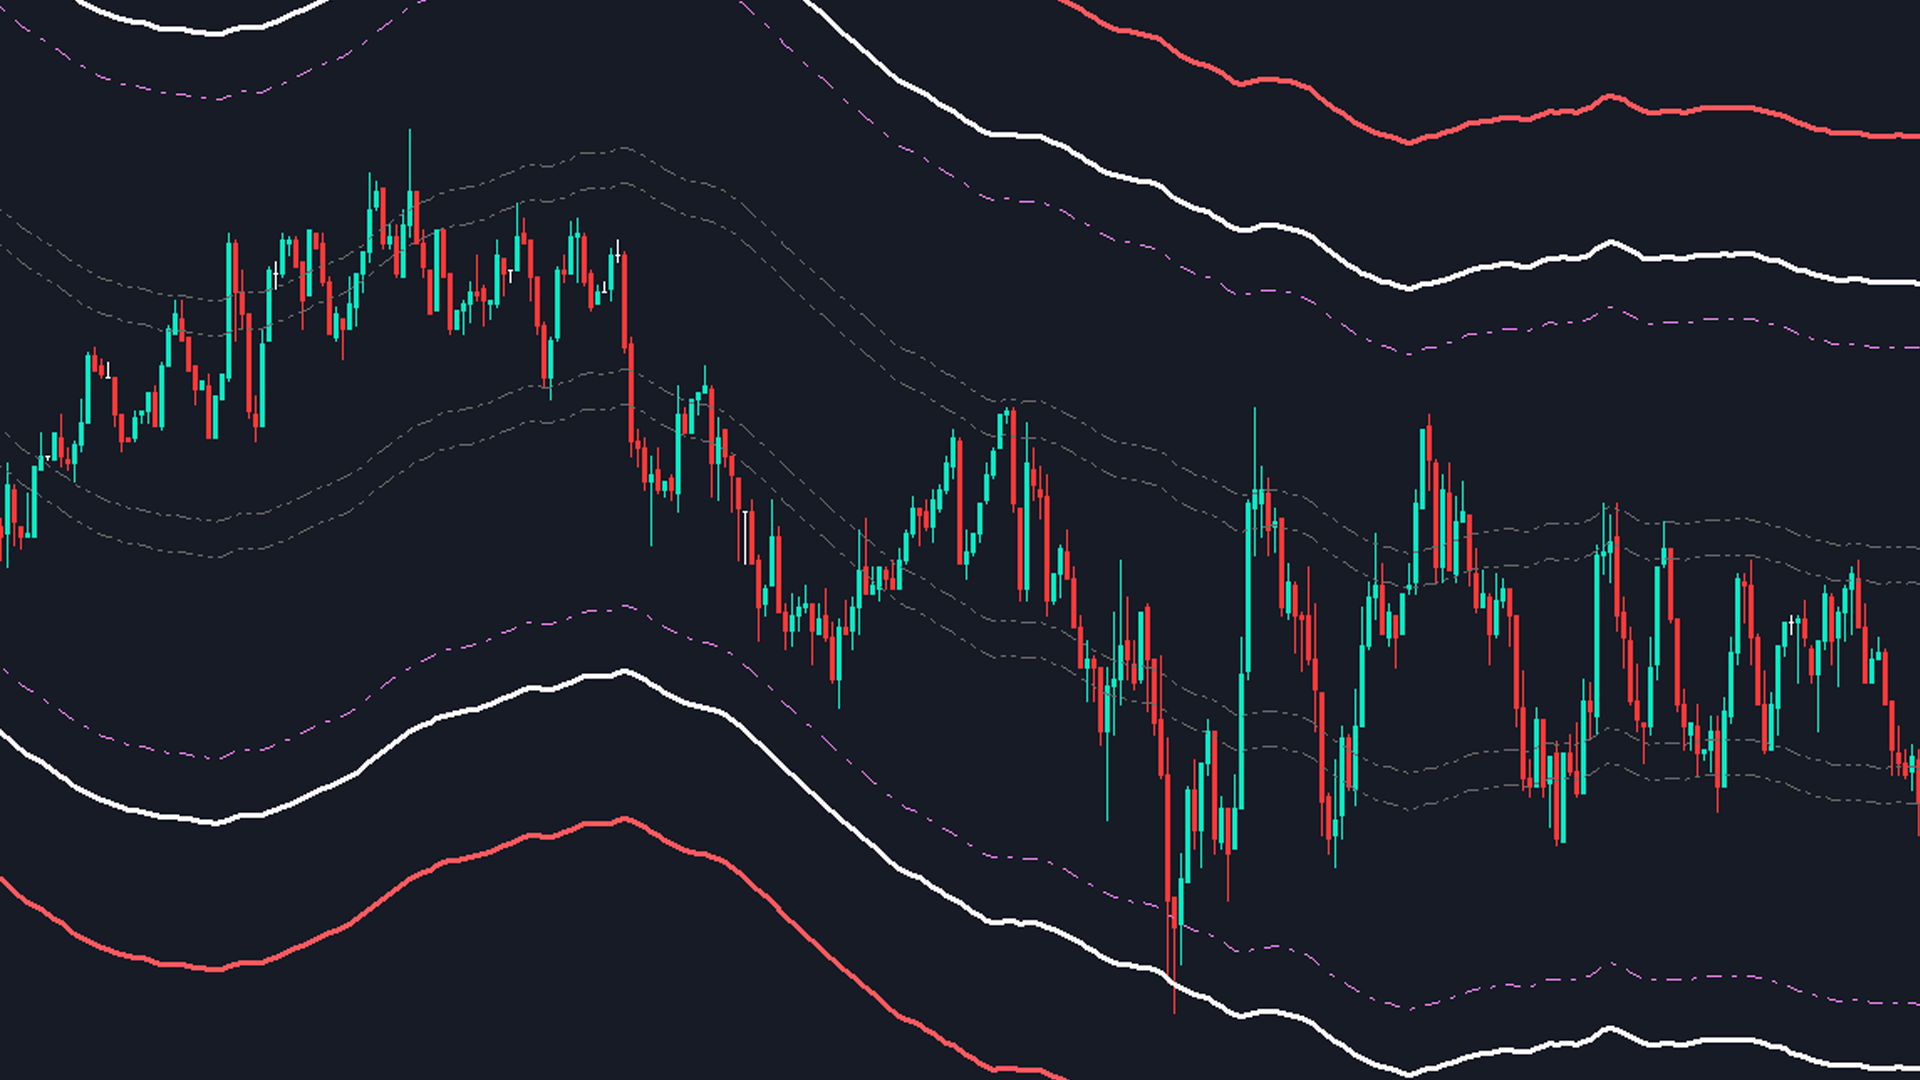
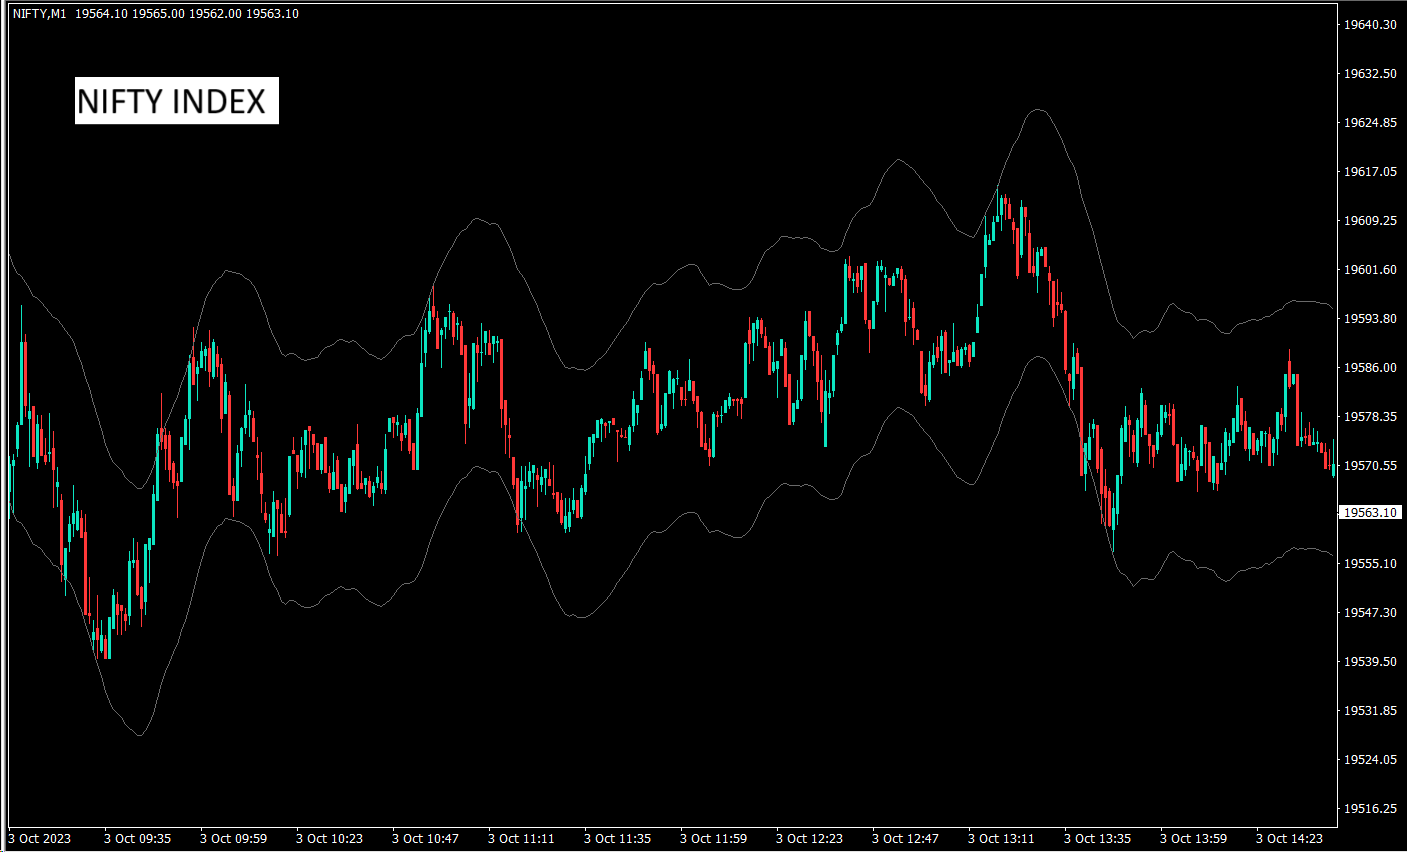
Il s'agit de 6 ensembles de niveaux avec deux modes de fréquence qui fonctionnent sur le marché universel, notamment le forex, la crypto, les matières premières, nifty et banknifty. Ils sont publiés après les meilleures recherches sur les instruments financiers.

Les niveaux supérieurs sont appelés U1 à U5 et les niveaux inférieurs sont appelés D1 à D5.
Le marché peut circuler soit dans les canaux internes jusqu'à U3 ou D3 dans des conditions normales, soit dans les canaux externes U4 à U5 ou D4 à D5 dans des conditions volatiles. Lorsque le prix atteint U3 U4 U5 ou D3 D4 D5, les chances de retournement sont très élevées et un trader doit attendre la clôture d'un chandelier pour confirmer l'entrée et peut négocier avec une gestion des risques valide.


Cet indicateur vous propose de décaler les niveaux grâce aux options de personnalisation dans les paramètres de l'indicateur. Un utilisateur peut personnaliser les niveaux en ajoutant des points + ou -

1. Ils travaillent sur les délais : M1, M3, M5, M15, H1 et H4 uniquement.
2. Convient aux méthodes de trading intrajournalier, swing et positionnel
3. Aide à trouver les meilleurs points tournants de surachat et de survente sur la base de la recherche par rapport à tout autre indicateur
4. Niveaux dynamiques : la valeur du niveau change chaque minute, mais lorsque le prix dépasse les critères pour atteindre ces niveaux dans toutes les conditions, un cycle est suivi et une inversion peut être observée.
5. Inclure les alertes et les notifications push


Pour plus d'informations sur la stratégie de trading, vous pouvez me contacter via DM.
Produits recommandés
EMAGapCtrend
Eadvisors Software Inc.
O Robô Trader EMAGap faz operações de curto prazo no timeframe 1min buscando as pequenas variações do mercado no instrumento: Mini-índice(B3), utiliza nova tecnologia de trade, os resultados no intraday são íncríveis.    Versão exclusiva para os instrumentos WIN$ e IND$ (Mini-índice B3).  Estratégia utilizada: média móvel e volatilidade. Lote Inicial: Versão Mini-índice, a partir de 1 lote. Versão Bra50, a partir de 0.05 Mini-Lotes. StopLoss e Take Profit Ajustáveis. Gerenciamento de risco:
Setup Double 7s
Luigi Nunes Labigalini
Entry and exit signals from the Double 7's Strategy by Larry Connors in his book "Short Term Trading Strategies That Work". Larry claims this strategy predicted the market's direction over 80% of the time since 1995. Picking up the gains and being exposed in the market less than 25% of the time. Good for swing trading on Daily charts of SPY, Nasdaq, China's FXI, Brazil's EWZ and the majority of the equity ETFs and World Indices. How does it work? The indicator activates the buy signal when
WAPV Box Effort x Result
Eduardo Da Costa Custodio Santos
WA_PV_BOX_EFFORT X RÉSULTAT pour MT5 L'indicateur WAPV Box Effort x Result fait partie du groupe Package Indicators (Wyckoff Academy Wave Market). L'indicateur WAPV Box Effort x Result pour MT5 vous aide à lire le prix et le volume. Sa lecture consiste à aider à l'identification effort x résultat dans les vagues créées par le graphique. L'indicateur WAPV Box Effort x Result pour MT5 lorsque la case est verte signifie que le volume est en faveur de la demande et lorsque la case est rouge le volum
Coppock Curve
Abraao Moreira
Fundamentação teórica Rate of Change - taxa de mudança (ROC) O ROC é um oscilador que flutua acima e abaixo de uma linha de zero, medindo a variação percentual de preços ao longo de determinado período. O ROC de 20 períodos mede a variação percentual de preços ao longo de 20 períodos, quanto maior a diferença entre o preço atual e o de 20 períodos atrás, maior o valor do ROC. Quando o indicador está acima de zero, a variação percentual é positiva indicando tendência bullish, se o indicador está
FREE
Limitless MT5
Dmitriy Kashevich
Limitless MT5 is a universal indicator suitable for every beginner and experienced trader. works on all currency pairs, cryptocurrencies, raw stocks Limitless MT5 - already configured and does not require additional configuration And now the main thing Why Limitless MT5? 1 complete lack of redrawing 2 two years of testing by the best specialists in trading 3 the accuracy of correct signals exceeds 80% 4 performed well in trading during news releases Trading rules 1 buy signa
Weis Wave with Alert MT5
Trade The Volume Waves Single Member P.C.
4.93 (15)
Rental/Lifetime Package Options and Privileges  * For optimum results the yearly or lifetime package is suggested due to live training ! Rent Monthly Six Months   Yearly/Lifetime Weis Wave with Speed with Alert+Speed Index x x x Manual  x x x Quick Set up Video x x x Blog x x x Lifetime Updates x x x Setup and Training Material x x Free Rectangle Break Alert Tool      x Discord Access Channel "The SI traders" x 2-hour live methodology training x How to trade with it:    http://
Pendiente de Precio
Cesar Juan Flores Navarro
Indicador en base a la pendiente de la linea de precio, dibuja una línea de color cuando sube a base de los precios que previamente has sido procesados o linealizados, y cuando baja la pendiente la linea linealizada toma otro color. En este caso se a considerado 6 lineas de diferentes procesos desde pendientes largas hacia las cortas, observándose que cuando coincidan las pendientes se produce un máximo o mínimo, lo que a simple vista nos permitirá hacer una COMPRA O VENTA.
The Red Devil Shorter is a fully automatic short setup based on EMAs and SMAs. Attention:  Only 9 of 10 copies left at the price of $250, after that the price goes up to $499 Signal:  https://www.mql5.com/de/signals/1826330 We use this great EA exclusively for the EUR/CHF pair, as we developed it specifically for that. The idea behind the setup is the weakness the EUR/CHF shows in the default time.  The trades are mainly closed by counter signals or the set time. In rare cases, trades are closed
Exclusive FOREX account HEDGE FuzzyLogicTrendEA is based on fuzzy logic strategy based on  analysis 5 indicators and filters. When the EA analysis all this indicators, it decides, based on its fuzzy strategy, which trade will be better: sell or buy. As additional functions, it´s possible defines spread maximum, stop loss and others. Recomm. Symbol: EURUSD, AUDUSD, GBPUSD, NZDUSD, USDCAD, AUDCAD, EURCAD e USDJPY Recomm. timeframe: H1. Backtest were done on EURUSD, H1, 01/07/2023 - 26/0
The best time to trade Using this Indicator is when the time reach exactly hour,half,45 minutes,15 minutes and sometimes 5 minutes.. This indicators is helpful to those who trade boom and crash indecies.How to read this indicator first you'll see Blue allow and Red allow all these allows used to indicate or to detect the spike which will happen so the allow happens soon before the spike happen.This indicator works properly only in boom and crash trading thing which you have to consider when
The "Super Trend Alert MT5" is an indicator designed for the MetaTrader 5 (MT5) trading platform. The specific details and functionality of this indicator may depend on the version or settings you are using. The Super Trend indicator is a popular technical analysis tool that helps identify the direction of the current market trend. It is displayed as a line on the price chart and is accompanied by alerts to notify traders of potential trend changes. To use the "Super Trend Alert MT5" indicator i
QuantumAlert RSI Navigator is a free indicator available for MT4/MT5 platforms, its work is to provide "alerts" when the market is inside "overbought and oversold" regions in the form of "buy or sell" signals. This indicator comes with many customization options mentioned in the parameter section below, user can customise these parameters as needful. Join our MQL5 group , where we share important news and updates. You are also welcome to join our private channel as well, contact me for the priva
FREE
CPT ea
Khalid Ait
5 (2)
Let me share one of my best EAs with you. CPT or Consistent P******** Trading  is a shortcut for three words. a name that explains a purpose. I cannot say it because MQ instructions doesn't allow me to, but when you use this EA, you will understand what I'm talking about. As a beginner, I passed from the phase of losing in the market to the phase of being a winner. I made parties at that time because I thought it was the top, and now everything will be easy. But... I got into a painful los
Robo davi I
Lucas Silvino Da Silva
Robô Davi I by Êxodo Capital is a professional system for traders created for the MT5 platform and optimized to work with MINI FUTURE INDEX (WIN) at B3 in BRAZIL. The system uses bias algorithms. After identifying the trend, the position is opened and the robot conducts the trade through a trailing stop that will be driven by the 13-period average. Maximum GAIN of 2200 pts. Main features Our setup has the option to use martingale, the EA has the option to customize. Presentation in the
DemsFx BC Entry EA
Desmond Ebimobowei Dogubo
1. The Expert Adviser is built with a basic, simple and stable trading strategy with i touch or Price Action Principle that is highly effective and accurate with a sniper entry system for a good money management.. 2. The expert advisor works best as from 15 minutes time frame and above.... 3. The expert advisor work with all broker all currency pair and synthetic indices... 4. Use a reasonable lot size and correct settings if you want to get the best of the Expert Advisor.. 5. With Default setti
FREE
Balance Aggression
Edson Cavalca Junior
The indicator measures the balance of aggression. The formula is as follows:   Aggression  = Purchase Volume - Sales Volume. Note : It is rec ommended to use the default configuration and VPS values. It does not work in Forex. Meet Our Products     Parameters : Numbers of days prior to the current one for calculation; Volume Divider e; Enables calculation of the current candle; Histogram Line style and; Size; Line Line style and; Size;  Follow us on our website to check the next new
Swiss VWAPsimple
Terence Gronowski
5 (4)
Swiss VWAPsimple Motivation Did not find free VWAP that works, the one that I found craseh. So I created a VWAP which calculates values only for the actual day. So computer resouces are not over stressed. What is VWAP, how is it used?  VWAP stands for Volume Weighed Average Price, it calculates the running sum of tick volume and the runnung sum of price times tickvolume. The division of these sums result in a weighed price (Sum P*V/Sum V). The calculation starts normally at midnight. The value
FREE
Easy GOLD MT5
Franck Martin
4.91 (11)
Easy Gold is the latest addition to the BotGPT family. It is surprising and very powerful. It is ideal for beginners due to its simplicity.  There is absolutely nothing to do, it's 100% automated, simply indicate the percentage of risk you want to take per trade and the EA is ready. Whatever your capital, the EA takes care of everything. Optimized on (XAUUSD).  Unleash all the power with the professional version (AGI Gold) and its connection to the neural network, available in my store. My othe
FREE
Recommended Use: XAUUSD , EURUSD,  USDJPY. This EA does NOT USE risky strategies like Martingale or Grid ! Each order has its own stop loss. EA built by me and experienced investors with multiple strategies included. Taylored to auto adapt to inumerous market conditions, uses a lot of indicators, and some of them build internaly. Use brokerage accounts with low spreads (ICMarkets, Tickmill ...) Observation: 1. There is no guarantee of future results, but use only brokerage accounts wit
ADR ST Patterns Strategy
Vladimir Poltoratskiy
4.5 (4)
ADR ST Patterns Strategy  is a modification of the classical  ADR  indicator. This simple indicator corresponds to the parameters specified in the  ST Patterns Strategy ( https://stpatterns.com/ ) .  Structural Target Patterns represents the market consistently divided into components. No trend lines, geometric proportions of the model itself, trading volume, or open market interest are needed for the formation of  ST Patterns . They are easily recognized and built only on the basis of breaking
FREE
Trend On Close
David Ben Svaiter
TrendOnClose is a sophisticated indicator designed for Binary market investors, focusing on statistical analysis of trends and counter-trends within specific candle cycles. Each cycle is defined by the candle CLOSE price, establishing the trend direction (UP/DOWN - BULL/BEAR) for subsequent statistical analysis until the start of the next cycle. The statistical analysis operates with two configurations: ⦁ Statistical Goal as SUBSEQUENT CANDLE: The algorithm focuses on the subsequent candle withi
Bollinger Bands B
Flavio Javier Jarabeck
5 (3)
John Bollinger created this indicator in 2010 as a way to read the original indicator (Bollinger Bands) in a more "technical" way, shown as an oscillator. The typical range of the Bollinger Bands %B is 0 - 0.5 - 1.0, where "0" represents the lower band, the "0.5" the middle band, and "1" the upper band. The line on the indicator represents the Closing prices. As simple as that. SETTINGS Bollinger Bands period of analysis Standard Deviation multiplier Shift Price type to be analyzed If you
FREE
Key level wedge MT5
Presley Annais Tatenda Meck
The   Key level wedge MT5   indicator automatically draws rising wedge pattern and falling wedge pattern for you on the chart. This pattern is really good when used as a confirmation entry at key support & resistance, supply & demand and reversal zones. Advantages  The   Key level wedge MT5   block DOES NOT RE-PAINT, giving you confidence when a signal appears and also helps when looking back.  The   Key level wedge MT5   includes an on/off button on the chart to easily keep the charts cle
Bollinger Bands Percentage
Emanuel Cavalcante Amorim Filho
Bollinger Bands %  or Bollinger Bands Percentage is one of the indicators used in the Sapphire Strat Maker - EA Builder . It is calculated using the following formula: Perc = (CLOSE_PRICE - LOWER_BOLLINGER) / (UPPER_BOLLINGER - LOWER_BOLLINGER) * 100 Thus, by taking the difference between closing price to the lower band and dividing it by the difference of the upper and the lower price levels of a Bollinger Bands indicator, we can calculate this indicator. It shows how far the price is f
FREE
MIDAS Super VWAP
Flavio Javier Jarabeck
4.29 (14)
Imagine VWAP, MVWAP and MIDAS in one place... Well, you found it! Now you can track the movement of Big Players in various ways, as they in general pursue the benchmarks related to this measuring, gauging if they had good execution or poor execution on their orders. Traders and analysts use the VWAP to eliminate the noise that occurs throughout the day, so they can measure what prices buyers and sellers are really trading. VWAP gives traders insight into how a stock trades for that day and deter
FREE
Compass B3 Trader
Renato Takahashi
Compass B3 Trader é um robô especialista em trades automatizados para o iBovespa (Miniíndice WIN e Minidólar WDO), baseado na estratégia de análise de inclinação de média móvel. A partir de estabelecimento da inclinação desejada, o robô realiza as entradas de trades, seguindo takeprofit e stoploss fixos ou dinâmicos conforme análise de velas. Ainda, pode-se configura um sistema de trail de stoploss possibilitando trades completos e de grandes grandes (+ pontos). Ativos: WIN, WDO. Timeframe: M1,
Donchian Pro
Paulo Henrique Faquineli Garcia
5 (2)
The Donchian Channel Channels are among the most popular tools of technical analysis, as they visually convey to the analyst the limits within which most price movement tends to occur. Channel users know that valuable information can be obtained at any time, whether prices are in the central region of a band or close to one of the border lines. One of the best known techniques to explore these concepts is Bollinger Bands. However, John Bollinger was not the only one to research the applicatio
FREE
Wave Box Market Frenquency
Jean Jacques Huve Ribeiro
4.83 (6)
Totally linked to the result of a movement and the duration he had. Its height records how many ticks the asset walked during a given movement, its width shows us the duration that movement had. Its configuration must be in line with the Weis Wave Indicator configuration to observe the movement force and can indicate a possible accumulation or distribution of the movement;
FREE
Descubra o EA para Mini Índice, o segredo do sucesso no mercado financeiro! Desenvolvido com anos de observação cuidadosa, este EA utiliza sinais exclusivos de entrada e saída para garantir resultados impressionantes. Prepare-se para uma jornada lucrativa! Graças a dois indicadores poderosos, cuidadosamente configurados (e forneceremos as configurações exatas), este EA oferece resultados excelentes. Imagine maximizar sua taxa de acerto e o payoff, enquanto mantém um baixo drawdown. Sim, é possí
Expert Amazo
Guilherme Geovanini Fraga
EXPERT AMAZO é um Expert Advisor projetado especificamente para negociar WIN (mini índice) e WDO (mini dólar). A operação é baseada na abertura de ordens utilizando alguns indicadores como Sars parabólicos, médias móveis, Bandas de Bollinger, Fibonacci, etc., trabalhando de acordo com 3 modalidades de estratégia, o AMAZO procura prever os movimentos do mercado com operações contra ea favor da tendência.        Entre em nosso Grupo de WhatsApp para receber as melhores configurações do Expert.
Les acheteurs de ce produit ont également acheté
This is arguably the most complete harmonic price formation auto-recognition indicator you can find for the MetaTrader Platform. It detects 19 different patterns, takes fibonacci projections as seriously as you do, displays the Potential Reversal Zone (PRZ) and finds suitable stop-loss and take-profit levels. [ Installation Guide | Update Guide | Troubleshooting | FAQ | All Products ] It detects 19 different harmonic price formations It plots primary, derived and complementary Fibonacci p
Good day! I present to you a trading technical indicator for Deriv broker synthetic indices. This indicator ONLY works with the following indices: Boom 300 Index Boom 500 Index Boom 1000 Index Crash 300 Index Crash 500 Index Crash 1000 Index The indicator was created to give signals to open medium-term trades in the direction of Spikes. But you can open trades in the opposite direction to Spikes, at your own risk. Trade only on M1. Other TFs do not guarantee the correct operation of the indic
FxaccurateLS
Shiv Raj Kumawat
WHY IS OUR FXACCCURATE LS MT5 THE PROFITABLE ? PROTECT YOUR CAPITAL WITH RISK MANAGEMENT Gives entry, stop and target levels from time to time. It finds Trading opportunities by analyzing what the price is doing during established trends. POWERFUL INDICATOR FOR A RELIABLE STRATEGIES We have made these indicators with a lot of years of hard work. It is made at a very advanced level. Established trends provide dozens of trading opportunities, but most trend indicators completely ignore them!
Bill Williams Advanced
Siarhei Vashchylka
5 (5)
Bill Williams Advanced is designed for automatic chart analysis using Bill Williams' "Profitunity" system. The indicator analyzes four timeframes at once. Manual (Be sure to read before purchasing) Advantages 1. Automatically analyzes the chart using the "Profitunity" system of Bill Williams. The found signals are placed in a table in the corner of the screen. 2. Equipped with a trend filter based on the Alligator indicator. Most of the system signals are recommended to be used only accordi
TrendMaestro5
Stefano Frisetti
note: this indicator is for METATRADER4, if you want the version for METATRADER5 this is the link:  https://www.mql5.com/it/market/product/108106 TRENDMAESTRO ver 2.4 TRENDMAESTRO recognizes a new TREND in the bud, he never makes mistakes. The certainty of identifying a new TREND is priceless. DESCRIPTION TRENDMAESTRO identifies a new TREND in the bud, this indicator examines the volatility, volumes and momentum to identify the moment in which there is an explosion of one or more of these data a
Professional Scalping Tool on Deriv Attention! The indicator will be sold in limited quantities!!! The previous 5 copies were sold for $250 The next 5 copies will be sold for $350 The next price is $500 Description: This trading indicator is designed for professional traders focused on scalping. Designed with the market in mind, it provides highly accurate spike trading signals. It works on the M1 timeframe and supports the following symbols: Boom 300 Index, Boom 500 Index, Boom 1000 Index,
L'indicateur de Carré Gann est un puissant outil d'analyse du marché basé sur l'article "Formule Mathématique pour les Prédictions de Marché" écrit par W.D. Gann. Cet outil utilise des concepts mathématiques et des théories de Gann pour réaliser une analyse précise du marché. Il utilise les carrés de 144, 90, 52 et aussi le carré de 9. De plus, il intègre la méthode du  pour le carré de 9 et sa relation avec les canaux et le modèle en étoile de ce carré. Manuel d'Utilisateur et Application : Ava
PZ Swing Trading MT5
PZ TRADING SLU
5 (4)
Swing Trading is the first indicator designed to detect swings in the direction of the trend and possible reversal swings. It uses the baseline swing trading approach, widely described in trading literature. The indicator studies several price and time vectors to track the aggregate trend direction and detects situations in which the market is oversold or overbought and ready to correct. [ Installation Guide | Update Guide | Troubleshooting | FAQ | All Products ] Profit for market swings with
Eng Gold
Ely Alkrar Xshkaky
ENG-GOLD Scalper It is an auxiliary indicator that identifies potential targets and determines the place of entry with a stop loss that works on Heiken Ashi candles  The green lines are usually the targets, the red lines are the stop loss, and the yellow lines are the entry location.  This file is recognized on small and medium frames, usually less than the watch frame I highly recommend using XAUUSD US100 US30 USOIL 
IVISTscalp5
Vadym Zhukovskyi
5 (3)
Nous vous présentons l'indicateur iVISTscalp5, qui est non seulement unique, mais également efficace dans les opérations de trading. Cet indicateur est basé sur des données temporelles et est le résultat de nombreuses années d'expérience et d'analyse approfondie des marchés financiers. L'indicateur iVISTscalp5 est un excellent outil pour le trading manuel. La commodité, la simplicité et la visualisation - toute la complexité est cachée à l'intérieur. Nous avons simplifié au maximum les paramètre
Elliot Waves Analyzer Pro
Viktor Weidenthal
3.25 (4)
Elliot Waves Analyzer Pro calculates Elliot Waves to Help Identify Trend direction and Entry Levels. Mainly for Swing Trading Strategies. Usually one would open a Position in trend direction for Wave 3 or a Correction for Wave C . This Indicator draws Target Levels for the current and next wave. Most important Rules for Elliot Wave Analysis are verified by the Indicator.  The Pro version analyzes Multiple Timeframes and shows the Subwaves and Target-Levels.   For an Overview  " Elliot Waves Anal
SMCpro
Arief
5 (1)
SMCpro MT5  Original Price  $440   ---  Currently Price  40% OFF  ( for unlimited use ) Hello World! Introducing.. SMCpro tool and Indicator for  MetaTrader 5 , a cutting-edge feature designed to revolutionize your trading experience. With innovative ICT Smart Money Concept, you gain unparalleled insight into market dynamics, empowering you to make informed trading decisions like never before. Built on the foundation of advanced algorithms and real-time data analysis, SMCpro tool and Indicat
VTrende Pro
Andrii Diachenko
5 (1)
VTrende Pro - MTF indicator for trend trading with a display panel for MT5 *** Videos can be translated into any language using subtitles (video language - Russian) Although the signals of the VTrende Pro indicator can be used as signals of a full-fledged trading system, it is recommended to use them in conjunction with the Bill Williams TS. VTrende Pro is an extended version of the VTrende indicator. Difference between Pro version and VTrende: - Time zones - Signal V - signal 1-2 waves
RAD CRITICAL LEVES RAD indicator tracks “Relevant Volume” in real time, identifying accumulation and distribution processes, projecting them in the chart as SUPPORT or RESISTANCE zones. Natural   support   and resistance levels are generated by Volume Accumulation and Distribution processes. As these processes evolve, levels at which the relevant volume in the market place is positioned, become difficult areas to cross upwards or downwards. By using this information, traders can identify very s
Tricky to find and scarce in frequency, divergences are one of the most reliable trading scenarios. This indicator finds and scans for regular and hidden divergences automatically using your favourite oscillator. [ Installation Guide | Update Guide | Troubleshooting | FAQ | All Products ] Easy to trade Finds regular and hidden divergences Supports many well known oscillators Implements trading signals based on breakouts Displays suitable stop-loss and take-profit levels Configurable oscilla
Introduction to X3 Chart Pattern Scanner X3 Cherart Pattern Scanner is the non-repainting and non-lagging indicator detecting X3 chart patterns including Harmonic pattern, Elliott Wave pattern, X3 patterns, and Japanese Candlestick patterns. Historical patterns match with signal patterns. Hence, you can readily develop the solid trading strategy in your chart. More importantly, this superb pattern scanner can detect the optimal pattern of its kind. In addition, you can switch on and off individu
The indicator is designed to close positions on the market in time. For example: to take profits ahead of schedule if the price has not reached TakeProfit, and the market is turning around. The indicator analyzes the momentum, not the trend. He does not give any information about the trend. The indicator is well suited for finding divergence. The Ershov 38 Parrots indicator dynamically adjusts to the market and detects price movement impulses of medium and high amplitude. It almost does not rea
Multi-currency, multi-timeframe, harmonic pattern indicator AB = CD. Supports sending push notifications about signals to a mobile device, messages on e-mail, as well as messages using alerts on all available currency pairs and timeframes. This indicator was based on the indicator Harmonic ABCD Universal. Version for MetaTrader 5:  https://www.mql5.com/en/market/product/44972 . See also: Harmonic ABCD Universal for MetaTrader 4 . Using modern software development methods has made the indicator a
Cet indicateur est une méthode d'analyse de marché basée sur l'article "Formule mathématique pour les prédictions de marché" écrit par W.D. Gann en fonction du carré de neuf et du carré de 144 méthodes. Manuel de l'Utilisateur: Add Your review And contact us to get it Vous pouvez acheter la version complète MT4 à partir de : https://www.mql5.com/en/market/product/15316 Vous pouvez tester gratuitement sur MT4 : https://www.mql5.com/en/market/product/15320?source=Site +Profile+Seller#!t
PZ Day Trading MT5
PZ TRADING SLU
2.83 (6)
This indicator detects price reversals in a zig-zag fashion, using only price action analysis and a donchian channel. It has been specifically designed for short-term trading, without repainting or backpainting at all. It is a fantastic tool for shrewd traders aiming to increase the timing of their operations. [ Installation Guide | Update Guide | Troubleshooting | FAQ | All Products ] Amazingly easy to trade It provides value on every timeframe It displays suitable SL and TP levels It impl
PZ Trend Trading MT5
PZ TRADING SLU
3.67 (3)
Trend Trading is an indicator designed to profit as much as possible from trends taking place in the market, by timing pullbacks and breakouts. It finds trading opportunities by analyzing what the price is doing during established trends. [ Installation Guide | Update Guide | Troubleshooting | FAQ | All Products ] Trade financial markets with confidence and efficiency Profit from established trends without getting whipsawed Recognize profitable pullbacks, breakouts and early reversals The ind
Elliott Wave Trend was designed for the scientific wave counting. This tool focuses to get rid of the vagueness of the classic Elliott Wave Counting using the guideline from the template and pattern approach. In doing so, firstly Elliott Wave Trend offers the template for your wave counting. Secondly, it offers Wave Structural Score to assist to identify accurate wave formation. It offers both impulse wave Structural Score and corrective wave Structure Score. Structural Score is the rating to sh
"Piranha" - an autonomous trading system that determines overbought and oversold levels on the chart. Red and blue zones represent overbought and oversold levels respectively. Entry points are marked with arrows: a downward arrow in the red zone for "sell" and an upward arrow in the blue zone for "buy". The Take profit level is indicated by the green moving average. Key features: Adjusting the Take profit level as the green moving average changes position. Averaging ability when a new market e
Tatino Super Signals is Non Repaint Indicator for Binary Option trading and Forex trading. Recommendations: Timeframe: All timeframes. For best results we recommend using it on M1, M5 and M15 timeframes. Currency pairs: All Pairs Account type: All Type Broker time: Any Brokers : Alls Binary Trading : Expired 1 Candle Buffer Buy=1, Sell=0, Entry Next Candle Recommended Forex trading stop loss : 15 pips Recommended  Forex tradingTake profit levels : 15 pips Specifications: Does not repaint  
INDICATEUR basé sur l'INTELLIGENCE ARTIFICIELLE qui génère d'éventuelles entrées d'achat et de vente pour les options binaires. l'indicateur fonctionne sur 3 stratégies différentes : 1) en lisant les volumes, il envoie un signal lorsque le prix doit s'inverser 2) à travers la divergence entre prix et volume, il envoie un signal lorsque la tendance doit se poursuivre ou s'inverser 3) grâce à la convergence entre le prix et le volume, il envoie un signal lorsque la tendance doit se poursu
How to use Pair Trading Station Pair Trading Station is recommended for H1 time frame and you can use it for any currency pairs. To generate buy and sell signal, follow few steps below to apply Pair Trading Station to your MetaTrader terminal. When you load Pair Trading Station on your chart, Pair Trading station will assess available historical data in your MetaTrader platforms for each currency pair. On your chart, the amount of historical data available will be displayed for each currency pai
Indicateur unique qui met en œuvre une approche professionnelle et quantitative pour signifier le trading de réversion. Il capitalise sur le fait que le prix dévie et revient à la moyenne de manière prévisible et mesurable, ce qui permet des règles d'entrée et de sortie claires qui surpassent largement les stratégies de trading non quantitatives. [ Installation Guide | Update Guide | Troubleshooting | FAQ | All Products ] Des signaux de trading clairs Étonnamment facile à échanger Couleurs et
This is the famous Sunflower indicator for Metatrader5. This indicator marks possible tops and bottoms on price charts. The indicator identifies tops and bottoms in the asset's price history, keep in mind that the current sunflower of the last candle repaints, as it is not possible to identify a top until the market reverses and it is also not possible to identify a bottom without the market stop falling and start rising. If you are looking for a professional programmer for Metatrader5, please
ZigZag de Suavizador
Cesar Juan Flores Navarro
Teniendo una entrada de precios suavizados, los cuales son procesador por un ZigZag en tiempo real, dando como resultado un suavizador ajustado a un ZigZag. Con valores de entrada (periodo) mayores se vuelve un poco lenta en M1,, Ideal para H1, H4, D1 Trabaja bien con otros suavizadores, ya que su intersección es ideal Al iniciar empiza con mayor precisión desde el momento de activación, siendo el historial (anterior) de referencia ----------------------------------------------------------------
Super Suavizador
Cesar Juan Flores Navarro
Indicador en MQL5 que obtiene el promedio de 10 EMAS que son alineadas y procesadas según Fibonacci luego el promedio es suavizado"  Se ingresa un número de 2 a N que multiplica los EMA-Fibonacci y por consiguiente aumenta los fibonacci, resultando un promedio.   Se ingresa un número que suaviza los EMA-Fibonacci. Considerando los números 1/1 seria la suavización minima. Considerando los números 3/5 seria la suavización media. Considerando los números 10/30 seria la suavización alta.....etc
Plus de l'auteur
Crypto Charting
Rajesh Kumar Nait
5 (3)
Graphiques de crypto-monnaie pour MT5. Caractéristiques : 1. Graphique OHLC en direct via Websocket (wss) 2. Mettre à jour l'historique des barres depuis l'API 3. Mise à jour automatique de l'historique sur les graphiques lorsque MT5 est redémarré pour s'assurer qu'il n'y a aucune donnée manquante dans les barres et qu'il est toujours tenu à jour comme le graphique natif 4. Mise à jour programmée de l'historique depuis l'API : en cas de déconnexion Internet pendant une millisecond
Les structures de marché sont celles qui, lorsqu'elles éclatent dans un délai plus long, peuvent aider à dégager une tendance pour un commerçant. 1. Cet indicateur attirera ZigZag sur les 2 dernières structures (haut et bas précédents de ZigZag) et une nouvelle barre de ZigZag ne sera formée que lorsque la rupture de la structure se produira 2. Il donne une notification Terminal et Push en cas de rupture de structure 3. Augmentez et diminuez la profondeur de ZigZag à partir des touches
Cette bibliothèque vous permettra de gérer les transactions en utilisant n'importe lequel de vos EA et elle est très facile à intégrer sur n'importe quel EA que vous pouvez faire vous-même avec le code de script mentionné dans la description ainsi que des exemples de démonstration en vidéo qui montrent le processus complet. - Placer des ordres Limit, SL Limit et Take Profit Limit - Placer les ordres Market, SL-Market, TP-Market - Modifier l'ordre limite - Annuler la commande - Com
Cette bibliothèque vous permettra de gérer les transactions en utilisant n'importe lequel de vos EA et elle est très facile à intégrer sur n'importe quel EA que vous pouvez faire vous-même avec le code de script mentionné dans la description ainsi que des exemples de démonstration en vidéo qui montrent le processus complet. Ce produit permet des opérations de trading via API et n'inclut pas de graphiques. Les utilisateurs peuvent utiliser les graphiques des courtiers qui fournissent des graphiqu
This indicator finds Double Top and Double bottom Example : What is Double Top When price establishes a new high and then falls, then reverse to the same candle area of High then its considered a valid double top and vice versa for double bottom. 1. It plots and high and low on visible chart if ChartChange is set to true else it searches on new bar opening 2. If there is double top and double bottom found in visible chart window then it plots a line 3. It has options to customize text color, te
FREE
La bougie précédente multi-devises ou le scanner de barres précédentes vous aident à numériser des graphiques multi-symboles avec n'importe quelle période personnalisée que vous sélectionnez dans les paramètres de l'indicateur. Basé sur le produit : https://www.mql5.com/en/market/product/110229 Il peut être utilisé pour numériser plusieurs symboles pour le haut-bas du jour précédent, le haut-bas de la semaine précédente, le haut-bas du mois précédent ou toute période personnalisée, par ex
L'indicateur graphique Perfect Seconds vous permet de convertir les bougies minutes en secondes 1. Choisissez n'importe quel nombre de secondes pour fermer une barre à 100 % avec une heure précise. 2. Il s'agit de données basées sur les taux. Cela fonctionne même si les ticks ne sont pas disponibles. 3. Aucune DLL externe requise, cela fonctionne correctement sur VPS 4. Code rapide et optimisé 5. Prend en charge les paires cryptographiques telles que BInance, Kucoin et tous les au
Crypto Ticks and Depth
Rajesh Kumar Nait
5 (1)
Crypto-monnaie Live Tick Data Bid and Ask et profondeur de réservation pour EA Échange disponible : 1. Binance Spot (prend en charge la profondeur du carnet de commandes dans la fenêtre graphique active) et Futures (prend en charge plusieurs profondeurs du carnet de commandes) 2. Kucoin Spot et Futures, prend en charge la profondeur du carnet de commandes sur la fenêtre graphique active 3. Bybit Futures et Inverse Futures Cochez les données Bid Ask Last Échange à venir : OKX, MEXC
Véritable indicateur de toupie Il détecte une toupie précise sur le graphique avec un rapport équilibré entre le corps et la hauteur de la mèche, ce qui est la véritable signification de la toupie qui la diffère de Hammers and Doji ou Null Candlestick. Cet indicateur trace une icône de wingdings au nombre de toupies trouvées sur le graphique. Les paramètres incluent Nombre de barres : Pour ajuster la recherche sur le nombre de barres Couleur de l'icône : changer la couleur de l'ic
FREE
Outil de trading Binance pour MT5 1. Ce produit comprend un graphique en direct de websocket, un graphique historique, mises à jour automatiques au redémarrage du terminal mt5 pour le rendre fluide sans intervention manuelle, ce qui vous permet d'échanger Binance en douceur. Trading, graphiques en direct et données historiques disponibles pour le spot et les contrats à terme Comment utiliser : 1. Vous devez ajouter votre clé API et votre secret dans le champ de saisie de cet utilita
Double-cliquez sur plusieurs symboles n'importe où sur le graphique pour définir une alerte de prix et être averti par Terminal Alert ou Push Notification 1. Ajouter l'utilitaire EA sur le graphique 2. Parcourez le graphique avec les touches fléchées <- gauche ou -> droite 3. Double-cliquez n'importe où sur le graphique et cela ajoutera une ligne, faites glisser cette ligne pour définir le prix souhaité et le tour est joué, l'alerte est définie ! Lorsque le prix atteindra la ligne, il v
Cet indicateur trace jusqu'à 6 niveaux qui peuvent être activés / désactivés pour rendre le graphique plus propre selon les exigences du commerçant Ces 6 niveaux sont en 2 ensembles : Haut et Bas Pour chaque ensemble, différents délais peuvent être sélectionnés Il est basé sur la stratégie d'inversion du précédent haut bas, car il est considéré que le prix montre généralement un rejet dans un délai plus court comme 5 minutes lorsque le prix atteint le haut bas quotidien, hebdomadaire ou m
Ajoutez cet indicateur au graphique et définissez le paramètre ExtDepth de ZigZag Il donne une alerte instantanée lorsque le prix touche le canal supérieur, inférieur ou moyen de la ligne de tendance Caractéristiques : -Activer / Désactiver les alertes sur la ligne supérieure, inférieure ou médiane - Ajouter une pause après une alerte en quelques secondes - Mettre en pause ou réactiver le canal de tendance avec le bouton sur le graphique - Ajoutez des alertes précoces en ajoutant des poin
Crypto to MT5
Rajesh Kumar Nait
Crypto.com à MT5 Flux de bougies en direct vers Metatrader 5 à partir du websocket Crypto.com C'est une donnée de taux en direct OHCLV (Open High Low Close Real Volume)  commerçants, si dans un graphique minute, les données OHLC ne sont pas correctes, elles peuvent donner une mauvaise analyse dans l'étude graphique technique, ce produit garantit qu'il fournit des données précises en temps réel qui peuvent aider à l'analyse manuelle vous pouvez vérifier mon autre produit crypto sur mon p
Cobra Pivot Points est un indicateur permettant de tracer les points pivots les mieux optimisés que vous pouvez tester vous-même en téléchargeant la DÉMO. 1. Sélectionnez les deux meilleurs modes de pivotement : pivots Cobra ou pivots Camrilla 2. Vous pouvez utiliser n’importe quelle période non limitée à D1. 3. Vous pouvez jouer avec la valeur High Low Close du jour précédent avec le paramètre Shift. 1 = Barre précédente, 2 = Barre avant la barre précédente et ainsi de suite. Ces param
Pivot Points Multi Symbol Scanner analyse tous les symboles disponibles dans Marketwatch pour les points pivots Floor, Woodie, Camarilla, Demark ou Fibonacci. Vous pouvez sélectionner n'importe quelle période pour calculer les points pivots et recevoir des alertes lorsque le prix touche ces niveaux de support et de résistance. Pour les points pivots visuels Ce produit pourrait vous intéresser : https://www.mql5.com/en/market/product/110231 Il propose des options pour choisir différents
Explorateur de motifs pour les motifs triangulaires tels que triangle symétrique, triangle asymétrique ou triangle à angle droit, motif en coin tel que coin montant ou coin descendant, motif d'expansion et canal de tendance Cet indicateur explore le modèle historique ainsi que les modèles actuels. C'est le meilleur indicateur pour ceux qui essaient de gagner du temps en dessinant manuellement une ligne de tendance ou un triangle et qui souhaitent l'utiliser pour une analyse automatisée du tra
Cet indicateur trace jusqu'à 6 niveaux qui peuvent être activés / désactivés pour rendre le graphique plus propre selon les exigences du commerçant Ces 6 niveaux sont en 2 ensembles : Haut et Bas Pour chaque ensemble, différents délais peuvent être sélectionnés Il est basé sur la stratégie d'inversion du précédent haut bas, car il est considéré que le prix montre généralement un rejet dans un délai plus court comme 5 minutes lorsque le prix atteint le haut bas quotidien, hebdomadaire ou m
Panneau de mise à jour de l'historique des contrats à terme de Kraken Crypto Exchange Traits : 1. Il créera un symbole basé sur la configuration et mettra entièrement à jour l'historique qui est disponible à partir de l'API Kraken pour le symbole. Ce panneau met à jour l'historique des symboles Kraken Futures avec les données Open High Low Close. Il imprime également un message lorsque la mise à jour de l'historique est terminée. Veuillez noter qu'il ne s'agit pas de données en direct.
5 EMA Scalping Strategy Multi Symbol Scanner This EA utility will scan all symbols which are selected in marketwatch and alert when such condition is formed in chart when Candle low is above EMA 5 for Sell alert and Candle high is lower from EMA5 so you can be ready before selling or buying for scalping purpose on 5min chart For more details watch attached video Logic : When a candle closes above 5 EMA in 5 mins chart, Wait for its low to break and Sell when low is broken by wick, Your SL sh
Multi Symbol ZigZag Breakout Scanner scanne tous les symboles sélectionnés dans marketwatch. Cela vous aidera à trouver facilement le double haut, le double bas ou tout niveau d'extension Fibonacci lorsque le prix est sur le point d'atteindre ces niveaux. Vous pouvez sélectionner Timeframe et plusieurs Extdepths (jusqu'à 3) de Zigzag. Les zigzag recommandés sont 21, 34 et 55, ce qui couvre tous les types de zigzag et de bruit de filtre Vous pouvez configurer pour recevoir soit une alert
Scanner de dérivation Fibo Musang FMBCR CB1 MT5 Fibo Musang CB1 ou Candle Break 1 est une stratégie qui fonctionne très bien sur l'or XAUUSD et d'autres symboles forex. Ce scanner vous aidera à scanner très rapidement les devises multisymboles et à recevoir des alertes sur l'évasion FMCBR CB1 Veuillez voir la vidéo pour plus de détails car elle est entièrement personnalisable selon les préférences du commerçant : 1. Vous pouvez sélectionner la période et l'historique des barres 2.
Double-cliquez sur plusieurs symboles n'importe où sur le graphique pour définir une alerte de prix et être averti par Terminal Alert ou Push Notification 1. Ajouter l'utilitaire EA sur le graphique 2. Parcourez le graphique avec les touches fléchées <- gauche ou -> droite 3. Double-cliquez n'importe où sur le graphique et cela ajoutera une ligne, faites glisser cette ligne pour définir le prix souhaité et le tour est joué, l'alerte est définie ! Lorsque le prix atteindra la ligne, il v
Control Candle is the candlestick which holds multiple inside bars and are in control until its high low range is broken by close of any candlestick. When control candle is broken, price may act on these control candle as support and resistance. This indicator create rectangles on chart which will help you find control candles fast. Control candle indicator box is customizable by color, style, width and other options in indicator settings.
Cet indicateur vous permet d'afficher les étiquettes des niveaux de Fibonacci avec une grande taille de police . Il prend en charge jusqu'à 25 niveaux de Fibonacci - Dès que vous dessinez Fibonacci, il affiche les niveaux que vous avez ajoutés comme paramètre d'entrée avec une grande taille de police avec la couleur et la police que vous choisissez. Options personnalisables : 1. Police de texte Fibo 2. Taille du texte Fibo 3. Couleur du texte Fibo 3. Ajoutez une description
Cet indicateur suit efficacement tous les autres chandeliers temporels que vous souhaitez suivre sur le même graphique. 1. Sélectionnez n'importe quel délai supérieur pour charger les barres sur le même graphique 2. Personnalisez les couleurs et le style des chandeliers 3. Choisissez le nombre de barres pour dessiner les chandeliers 4. Suivez les bougies complètes dans un délai plus long, ainsi que la mèche et le corps. 5. Facile et pratique pour ceux qui ne veulent pas changer de
Cobra Pivot Points est un indicateur permettant de tracer les points pivots les mieux optimisés que vous pouvez tester vous-même en téléchargeant la DÉMO. 1. Sélectionnez les deux meilleurs modes de pivotement : pivots Cobra ou pivots Camrilla 2. Vous pouvez utiliser n’importe quelle période non limitée à D1. 3. Vous pouvez jouer avec la valeur High Low Close du jour précédent avec le paramètre Shift. 1 = Barre précédente, 2 = Barre avant la barre précédente et ainsi de suite. Ces param
La bougie précédente multi-devises ou le scanner de barres précédentes vous aident à numériser des graphiques multi-symboles avec n'importe quelle période personnalisée que vous sélectionnez dans les paramètres de l'indicateur. Basé sur le produit : https://www.mql5.com/en/market/product/78657 Il peut être utilisé pour numériser plusieurs symboles pour le haut-bas du jour précédent, le haut-bas de la semaine précédente, le haut-bas du mois précédent ou toute période personnalisée, par exe
Pivot Points Multi Symbol Scanner analyse tous les symboles disponibles dans Marketwatch pour les points pivots Floor, Woodie, Camarilla, Demark ou Fibonacci. Vous pouvez sélectionner n'importe quelle période pour calculer les points pivots et recevoir des alertes lorsque le prix touche ces niveaux de support et de résistance. Pour les points pivots visuels Ce produit pourrait vous intéresser : https://www.mql5.com/en/market/product/110072 Il propose des options pour choisir différents
Filtrer:
Aucun avis
Répondre à l'avis