VIX Fix Market Bottoms and Tops MT5
- Indicateurs
- Timo Kosiol
- Version: 1.0
- Activations: 5
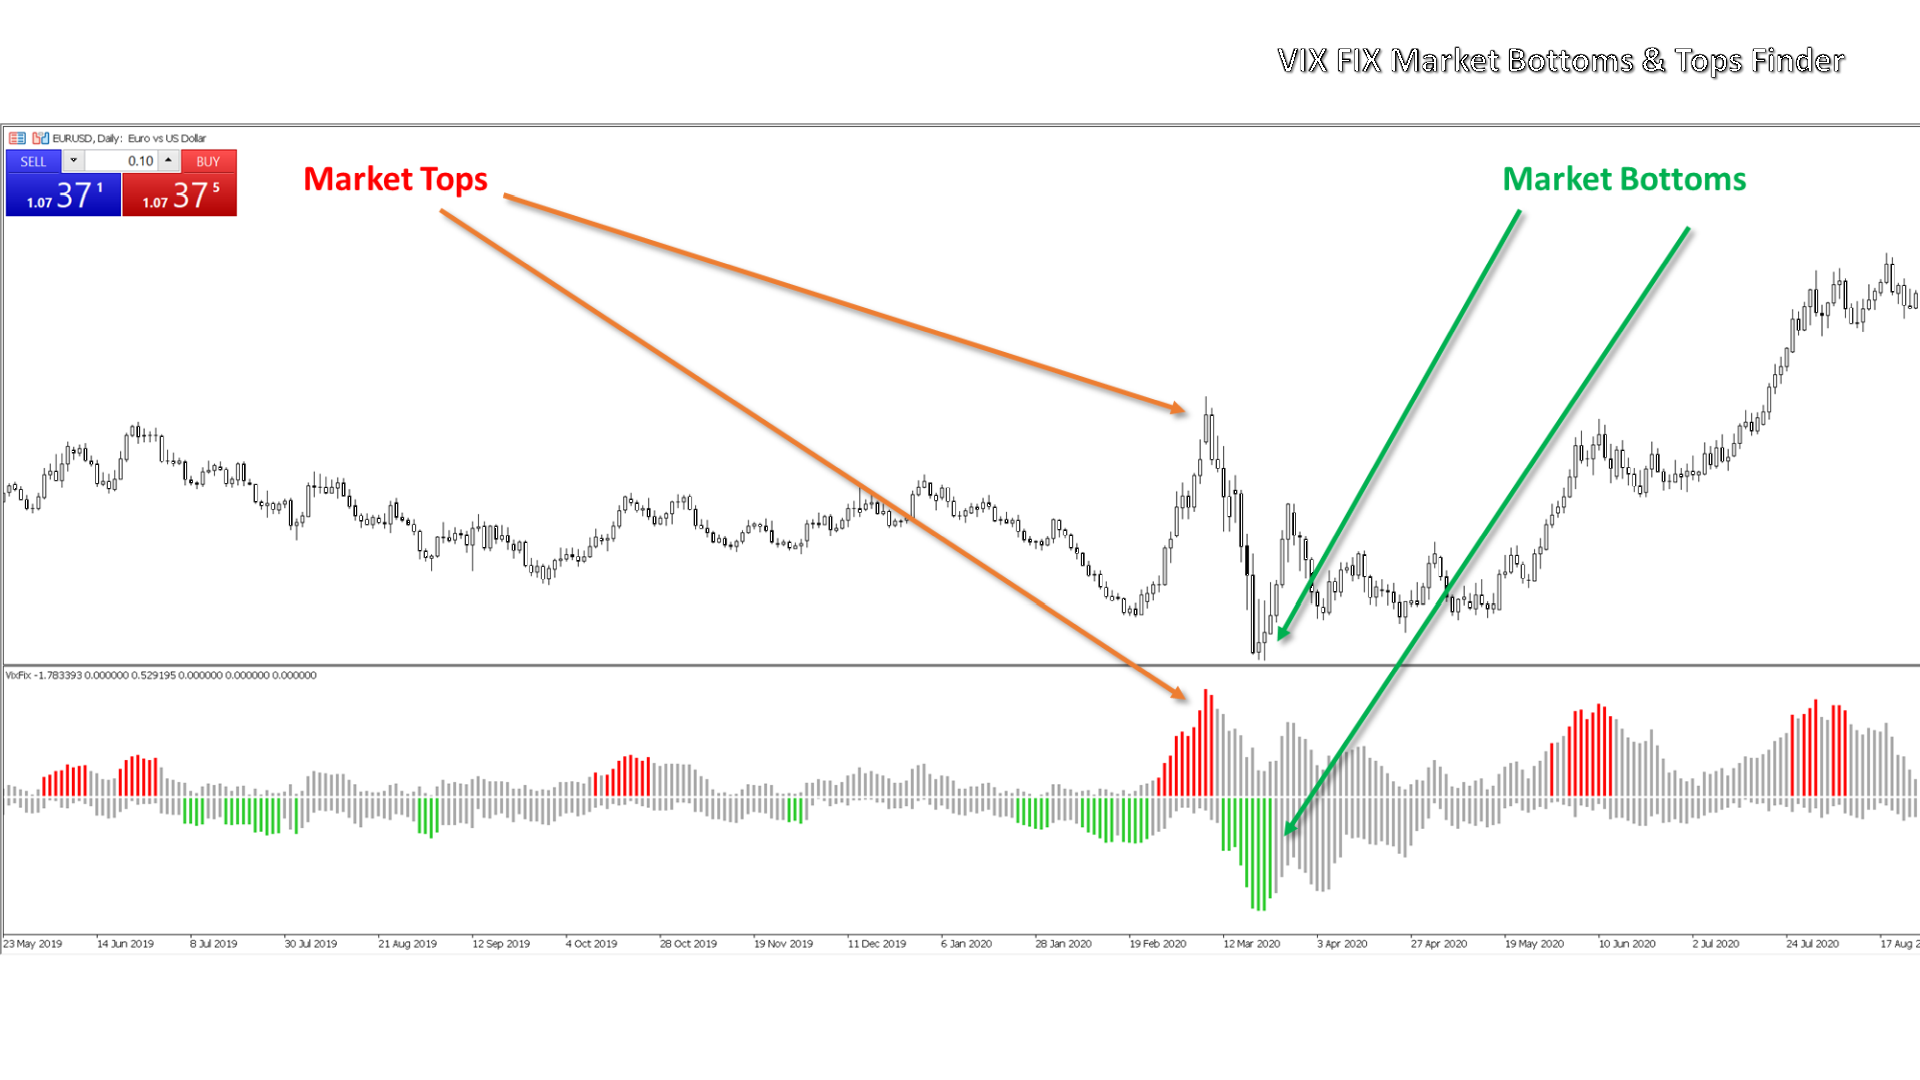
The VIX Fix is a volatility indicator developed by renowned trader Larry Williams. It's designed to measure volatility in assets that don't have options or futures, such as individual stocks and forex markets. Essentially, it acts as a synthetic VIX (Volatility Index) for any asset, providing a gauge of market uncertainty.
This modified version of William's indicator helps you to find market bottoms and market tops.
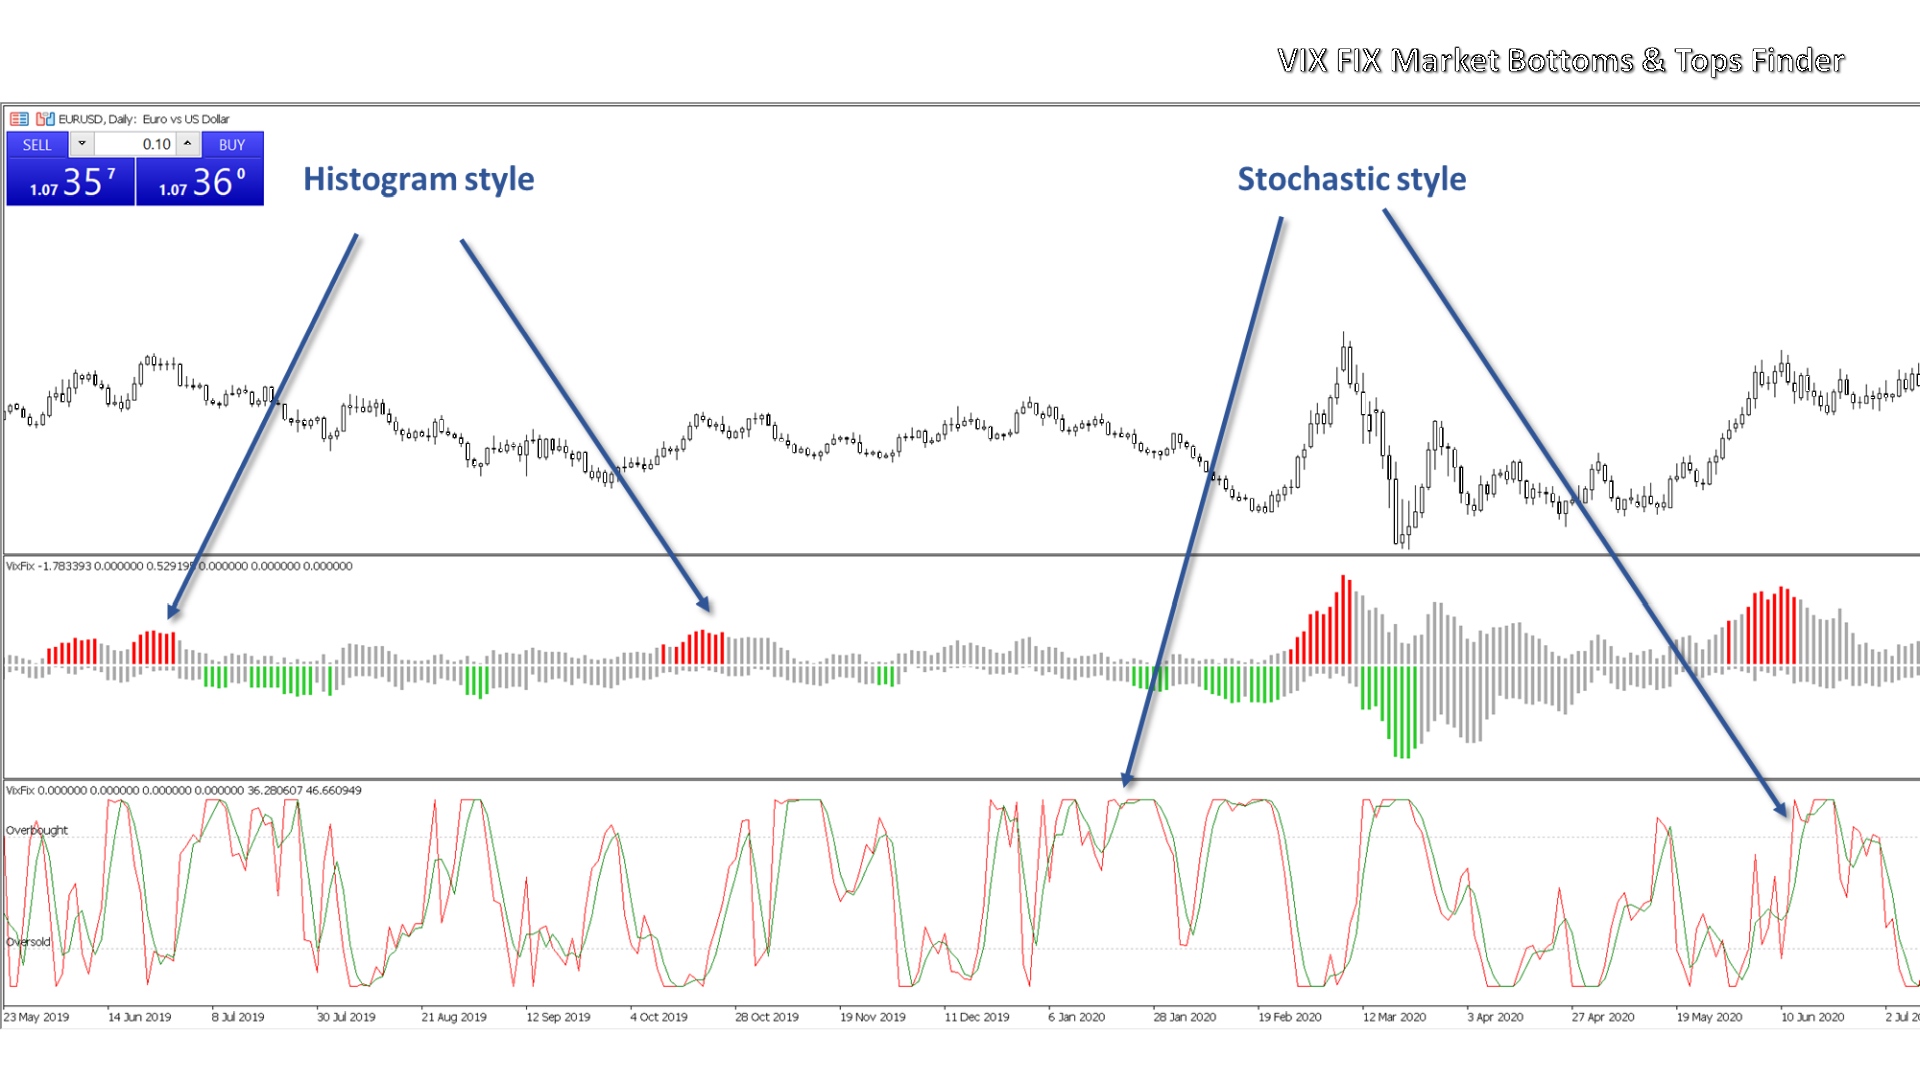
It comes with 2 styles: Stochastic and histogram style.
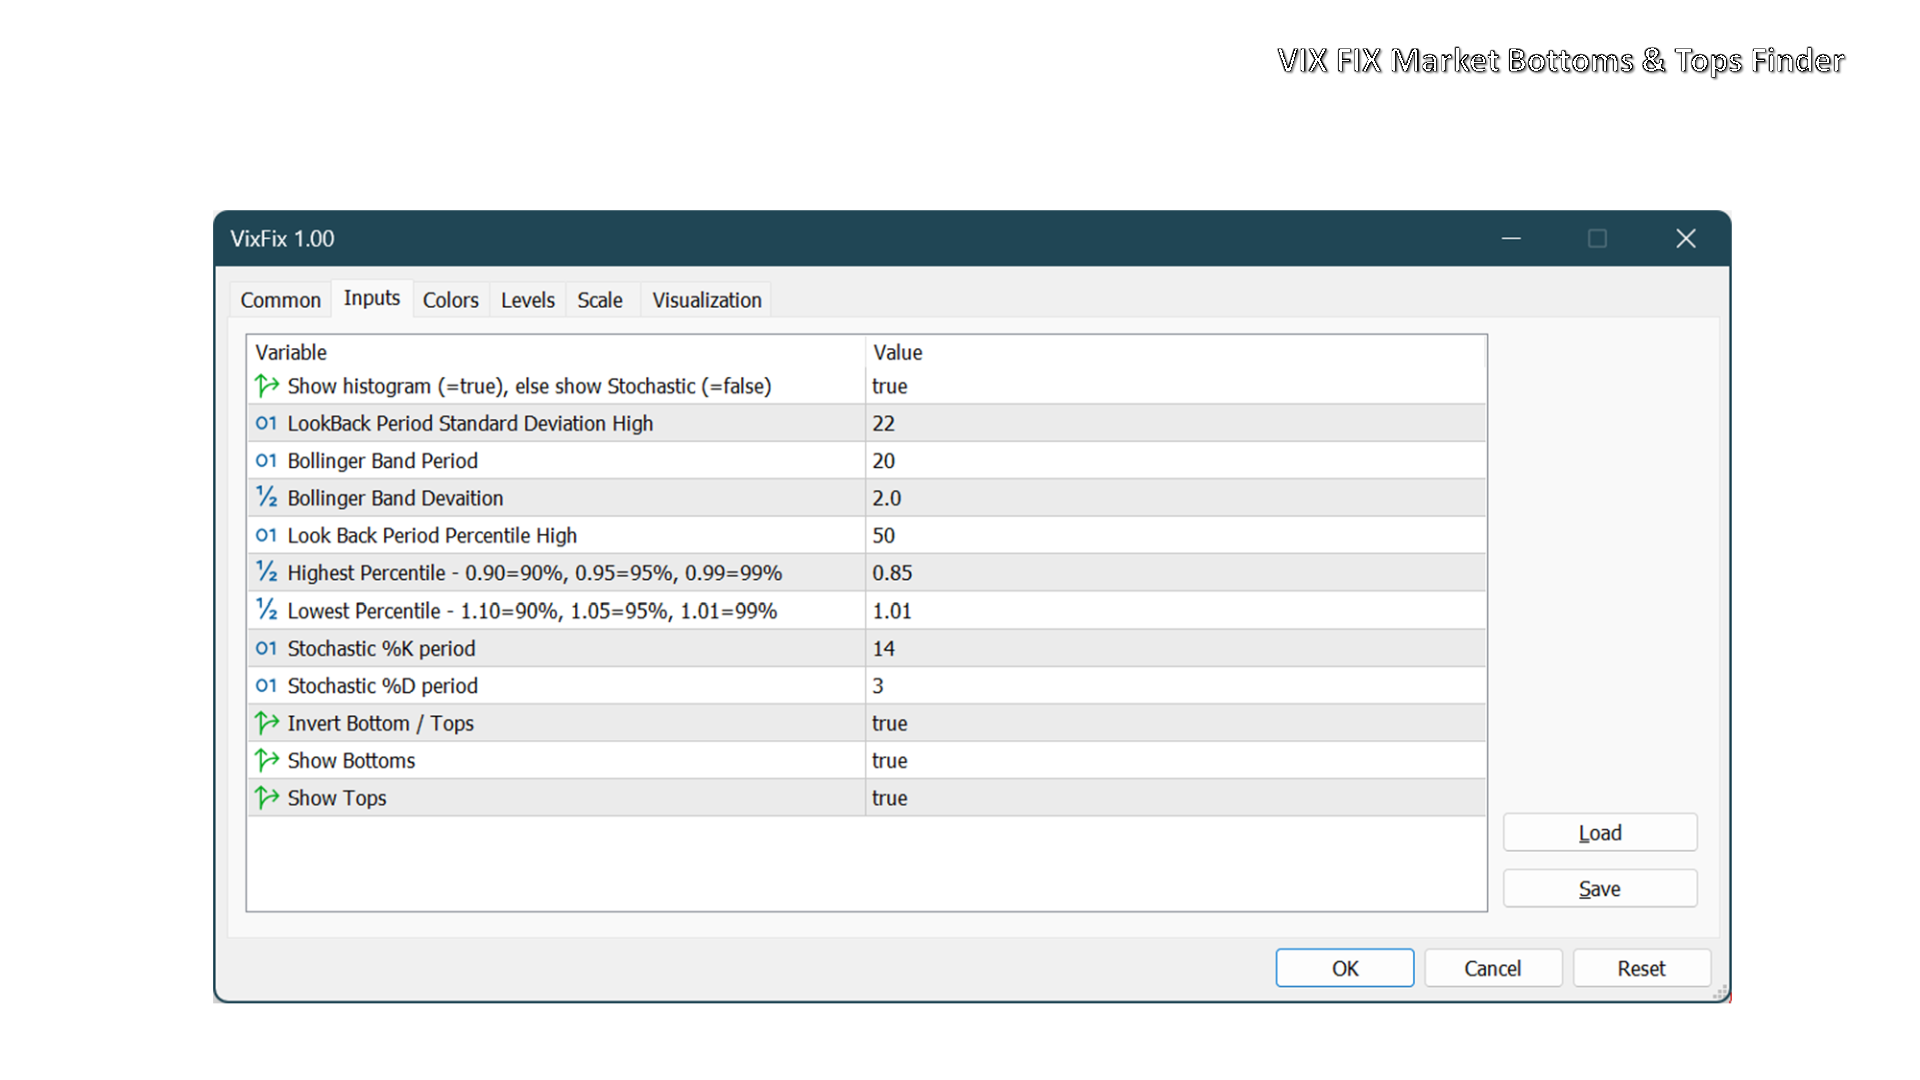
Please see screenshots for more information.