ON Trade Joker Levels
- Indicateurs
- Abdullah Alrai
- Version: 1.0
- Activations: 5
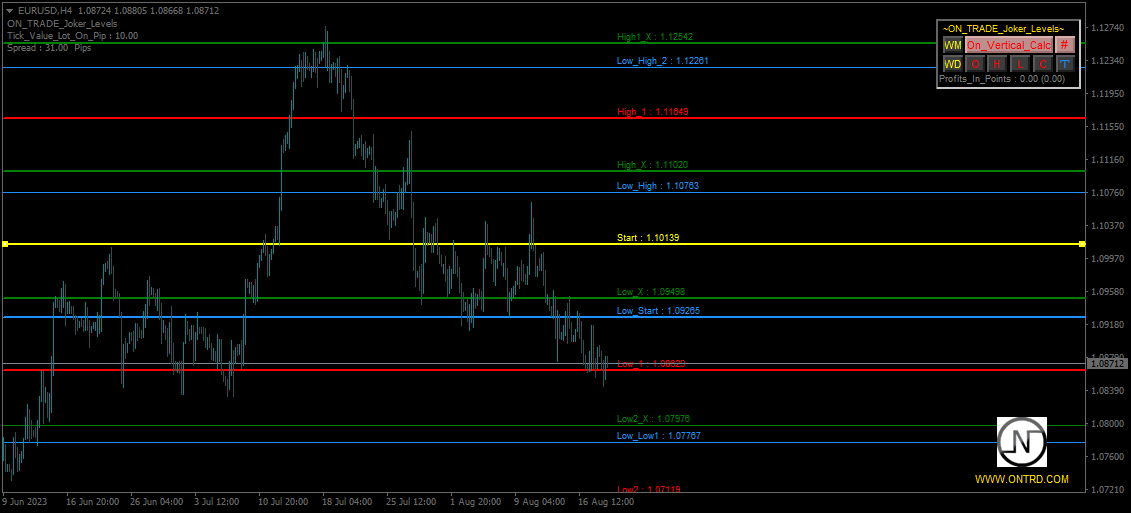
Indicateur de Support et Résistance Basé sur la Numérologie pour MetaTrader
Introduction : Découvrez une nouvelle dimension dans l'analyse technique avec notre Indicateur de Support et Résistance Basé sur la Numérologie pour MetaTrader. Cet outil unique exploite la puissance de la numérologie pour identifier des niveaux clés de support et de résistance sur vos graphiques, vous offrant des informations précieuses sur les mouvements potentiels des prix.
Concepts Clés :
La Numérologie dans le Trading : La numérologie est l'étude mystique des nombres et de leur signification dans nos vies. Appliquer les principes de la numérologie au trading consiste à identifier des nombres spécifiques ayant une importance symbolique et à les utiliser pour prédire les niveaux de prix susceptibles d'attirer des activités d'achat ou de vente.
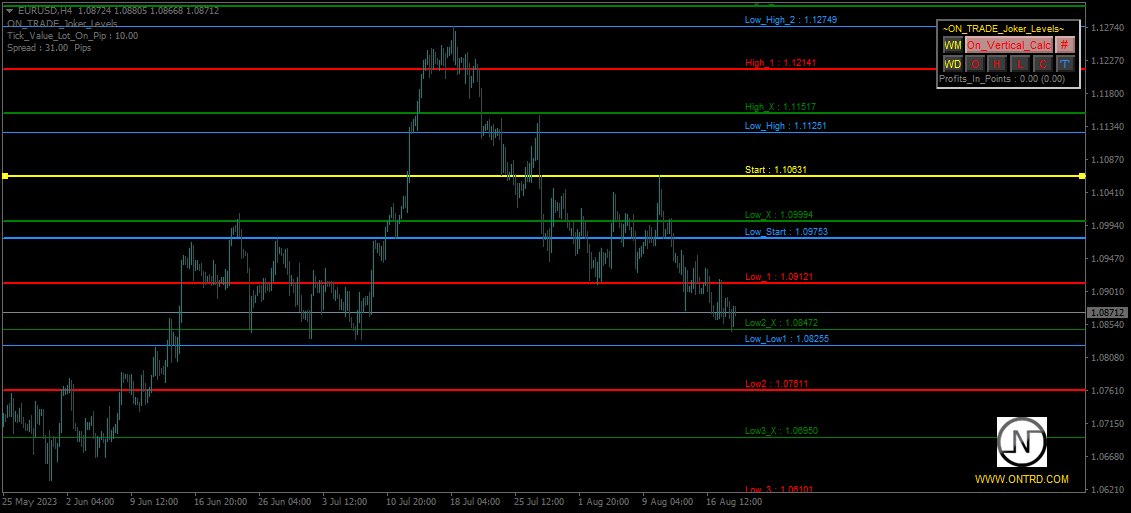
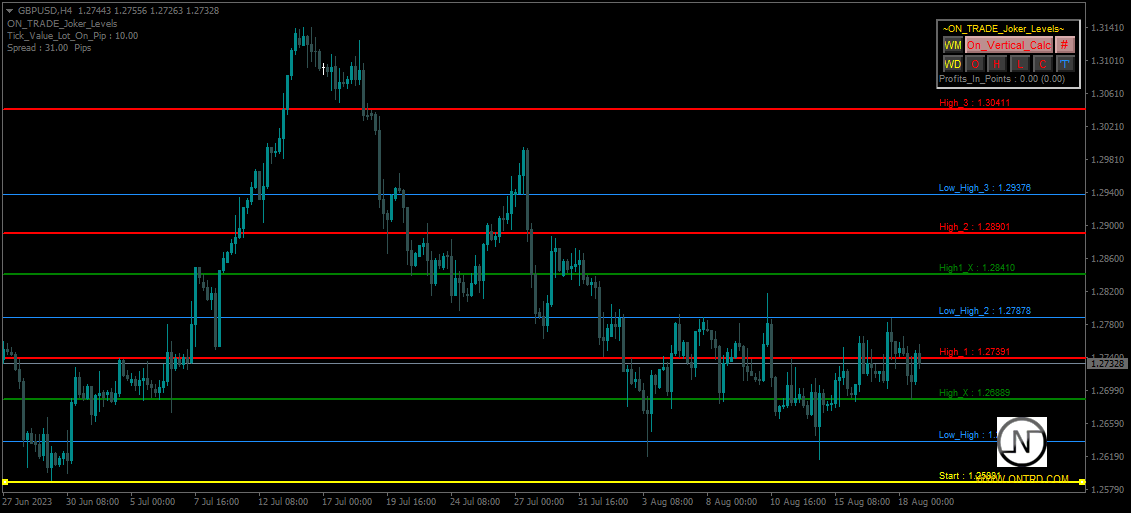
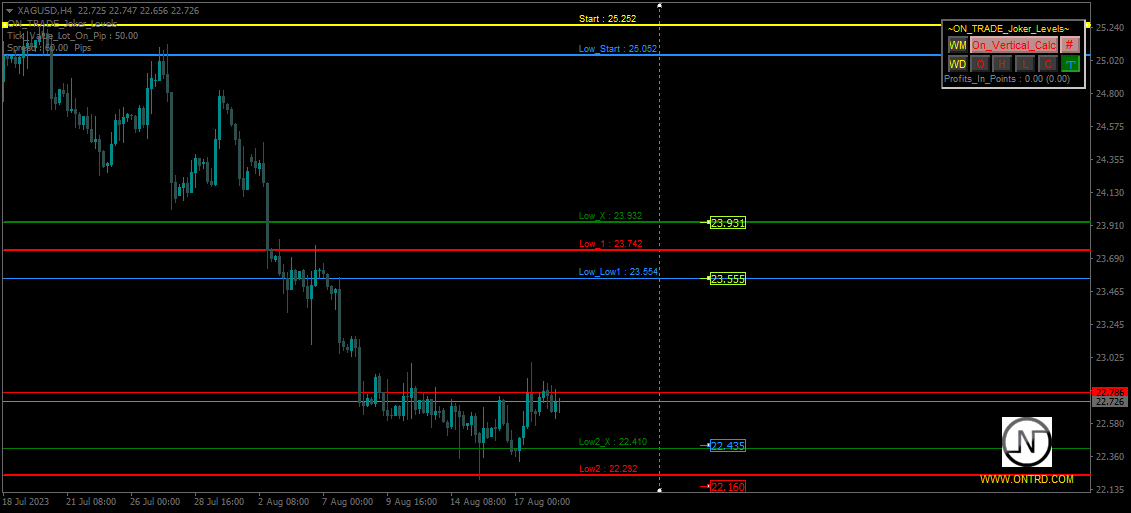
Fonctionnalités de l'Indicateur : Notre indicateur exploite les schémas cachés de la numérologie pour dessiner des niveaux de support et de résistance sur vos graphiques. Ces niveaux sont dérivés de nombres clés de la numérologie ayant une importance avérée sur les marchés financiers.
Étapes Préférées pour Apprendre :
Comprendre la Numérologie : Avant d'utiliser l'indicateur, prenez le temps de comprendre les bases de la numérologie et sa pertinence dans le trading. Apprenez les nombres significatifs, leurs significations et comment ils se rapportent aux marchés financiers.
Installation de l'Indicateur : Commencez par installer l'Indicateur de Support et Résistance Basé sur la Numérologie sur votre plateforme MetaTrader. Suivez les instructions d'installation fournies dans le guide utilisateur.
Choix d'une Période : Ouvrez un graphique de l'instrument de trading de votre choix et sélectionnez la période que vous souhaitez analyser. L'indicateur fonctionne sur différentes périodes, ce qui vous permet d'identifier des niveaux basés sur la numérologie pour le trading à court et à long terme.
Ajustement des Paramètres de l'Indicateur : Personnalisez les paramètres de l'indicateur en fonction de vos préférences de trading. L'indicateur pourrait vous permettre de spécifier les nombres de numérologie que vous souhaitez utiliser et d'ajuster les niveaux de sensibilité.
Interprétation des Niveaux : L'indicateur dessinera automatiquement des niveaux de support et de résistance sur votre graphique en fonction des principes de la numérologie qu'il intègre. Ces niveaux sont des zones potentielles où le prix pourrait inverser ou se consolider.
Confirmation par l'Action des Prix : Comme avec tout outil de trading, il est crucial de confirmer les niveaux basés sur la numérologie par d'autres analyses techniques et fondamentales. Recherchez des facteurs supplémentaires, tels que des configurations de chandelier ou des lignes de tendance, qui étayent les niveaux identifiés.
Pratique et Observation : Pour améliorer votre compétence avec l'indicateur, pratiquez son utilisation sur des graphiques historiques. Observez comment le prix réagit autour des niveaux basés sur la numérologie dans différentes conditions de marché.
Gestion des Risques : Implémentez toujours des stratégies appropriées de gestion des risques lors du trading. Utilisez des ordres stop-loss et des tailles de position pour protéger votre capital.
Conclusion : Notre Indicateur de Support et Résistance Basé sur la Numérologie est un outil puissant qui intègre le monde mystique de la numérologie dans votre stratégie de trading. En identifiant des niveaux potentiels de support et de résistance influencés par la numérologie, vous pouvez prendre des décisions de trading plus éclairées. N'oubliez pas que, bien que la numérologie ajoute une couche d'analyse unique, il est essentiel de la combiner avec d'autres techniques de trading éprouvées pour obtenir les meilleurs résultats.
[Avertissement : Le trading comporte des risques, et l'indicateur doit être utilisé dans le cadre d'une approche de trading globale. Effectuez toujours vos propres recherches et analyses avant de prendre des décisions de trading.]
N'hésitez pas à personnaliser et ajuster ces étapes pour correspondre à votre indicateur spécifique et à votre public cible.
L'utilisateur n'a laissé aucun commentaire sur la note
Follow us on telegram if you like
https://t.me/On_Trade_Telegram