Selective PinBar mt5
- Indicateurs
- Daniel Opoku
- Version: 1.0
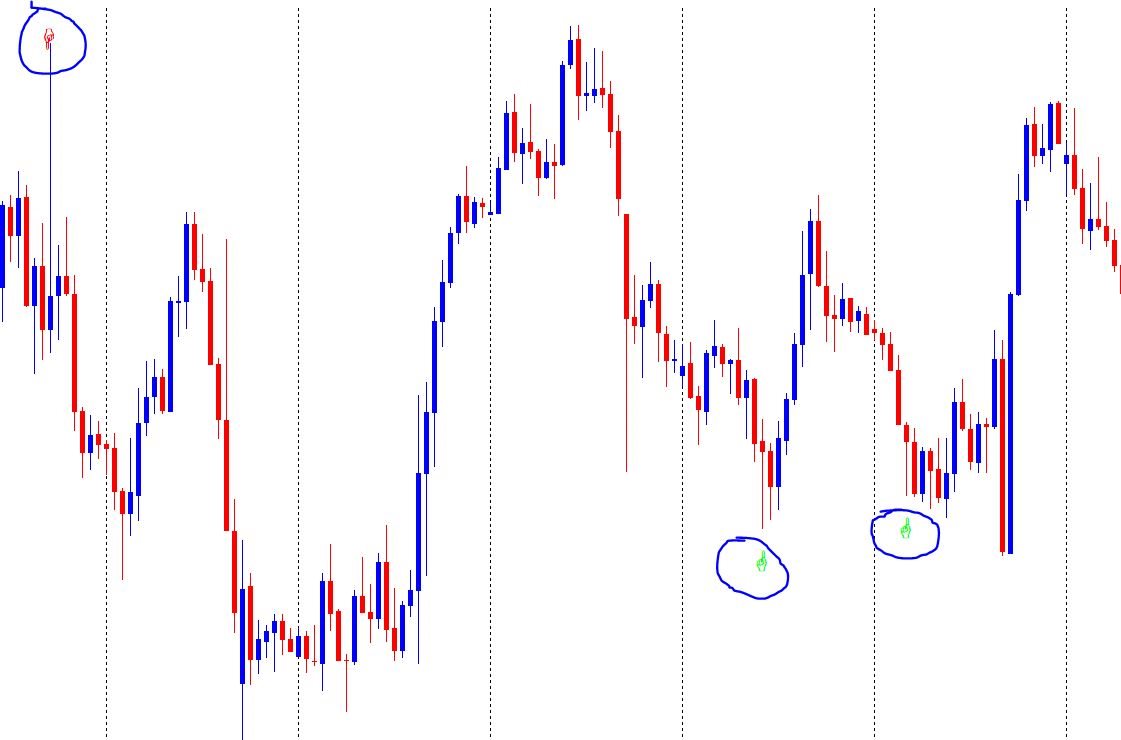
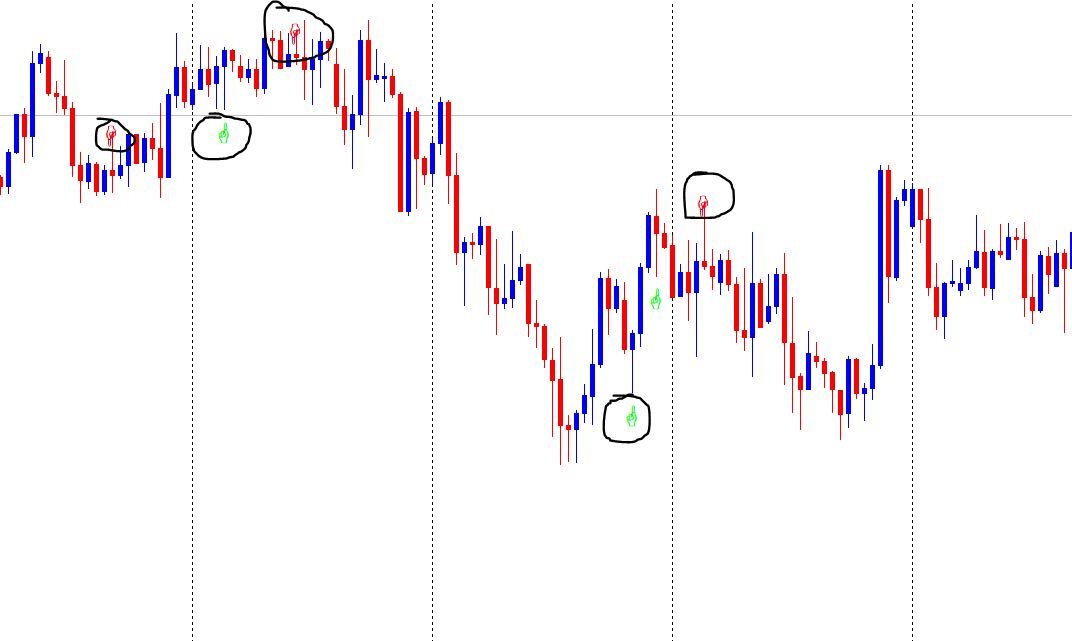
The selective pin bar is designed to identify reversals.
To use the selective pin bar effectively, traders typically look for Strong Rejection: The tail of the pin bar should extend significantly beyond the surrounding price action. It indicates that there was a sharp rejection of higher or lower prices during the trading period. A strong rejection suggests that the market sentiment may be changing.