Traders Club BB Data and Angle for MT5
- Indicateurs
- Koji Kobayashi
- Version: 3.5
- Mise à jour: 14 avril 2024
- Activations: 5
ボリンジャーバンドは、価格変動を分析するためのテクニカル分析の1つのツールになります。
ボリンジャーバンドには、中心線と2つのバンドがあります。
中心線は、一般的には移動平均線(通常は20日間の単純移動平均)として計算されます。この中心線は、一定期間の価格の平均値を表しています。
ボリンジャーバンドのバンドは、中心線の上と下に等間隔で配置されます。通常は中心線から2つの標準偏差分だけ離れた位置に設定されます。
拡大(Expansion)とは、ボリンジャーバンドが広がる状態を指します。
つまり、上下のバンドが中心線から離れ、価格の変動範囲が広がっていることを示します。拡大は、相場が活発になり、価格の大幅な変動が起こりやすいことを示すことがあります。
収縮(Contraction)とは、ボリンジャーバンドが狭くなる状態を指します。
つまり、上下のバンドが中心線に近づき、価格の変動範囲が狭まっていることを示し、相場が方向感を失い、一時的に価格変動が鈍化していることを示すことがあります。
■ ボリンジャーバンドの収縮と拡大は、価格変動のパターンや相場の特徴を捉えるために重要な指標になります。
このインジケータを使用することによりボリンジャーバンドの幅や、幅の広がりの割合、バンドの角度を視覚化することにより、
より戦略的にトレードに取り組めるようになるでしょう。
こちらにも詳細情報あります。
https://toushika.top/tc-bbdata/
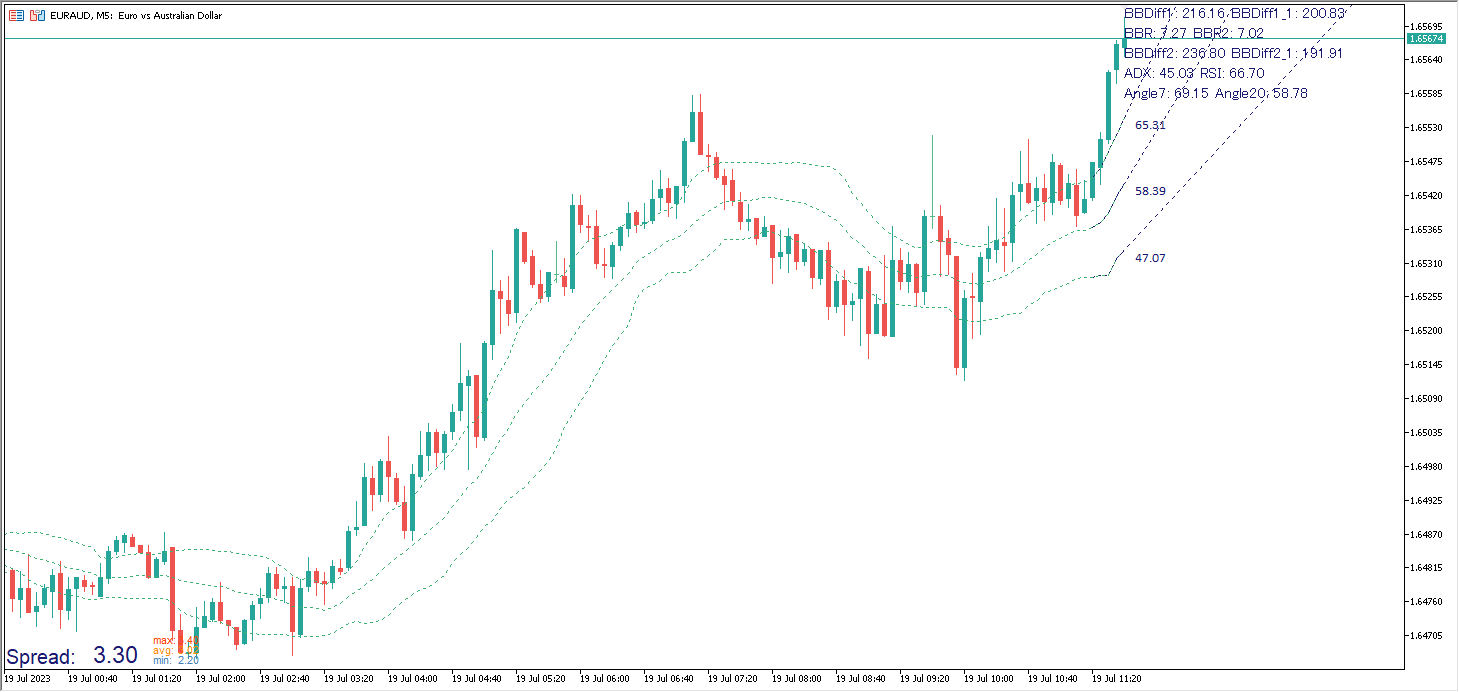
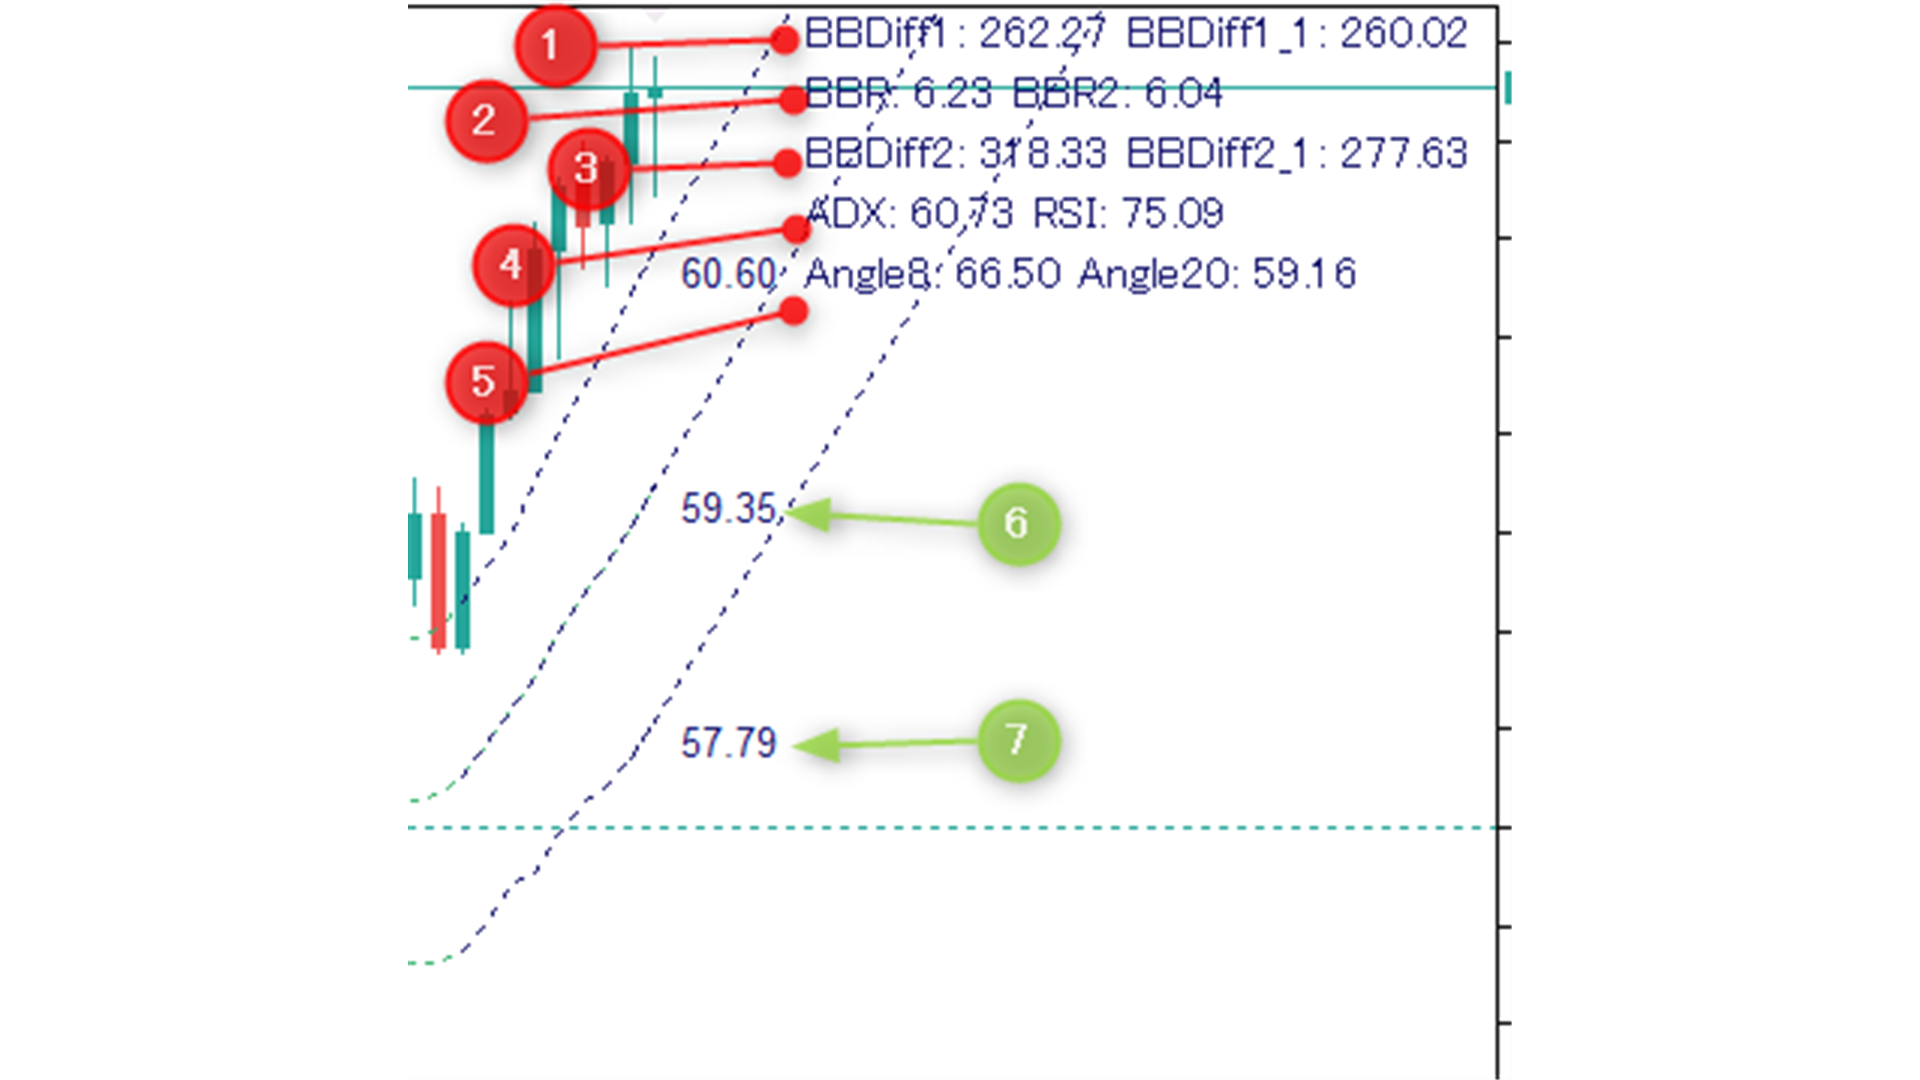
① ボリンジャーバンドの幅(現在足)
ディフォルトで 現在足の期間20の1σの上のバンドと下のバンドの幅をポイントで表示しています。
左側から現在値のバンドの幅、1本前のバンドの幅を表示しています。
※時間足、期間、標準偏差は変更可能になります。
② ボリンジャーバンドの拡大縮小パーセンテージ
ディフォルトで現在のバンドの幅とローソク足2本前のバンドの幅の割合をパーセンテージで表示します。
左側:{(現在値の幅 - 2本前の値の幅)÷ 2本前の値の幅} x 100
右側:(現在値の幅 - 2本前の値の幅)÷ {(現在値の幅 + 2本前の値の幅)÷ 2} x 100
③ ボリンジャーバンドの幅(15分足)
ディフォルトで15分足の期間20の1σの上のバンドと下のバンドの幅をポイントで表示しています。
左側から現在値のバンドの幅、1本前のバンドの幅を表示しています。
※時間足、期間、標準偏差は変更可能になります。
⓸ ADXとRSI
ディフォルトで5分足、期間14のADXの値と1時間足、期間14のRSIを表示しています。
※RSIの時間足、期間は変更可能になります。
⑤ 移動平均線の角度
ディフォルトで5分足、期間7と20の移動平均線の角度を表示しています。
※時間足、期間は変更可能になります。
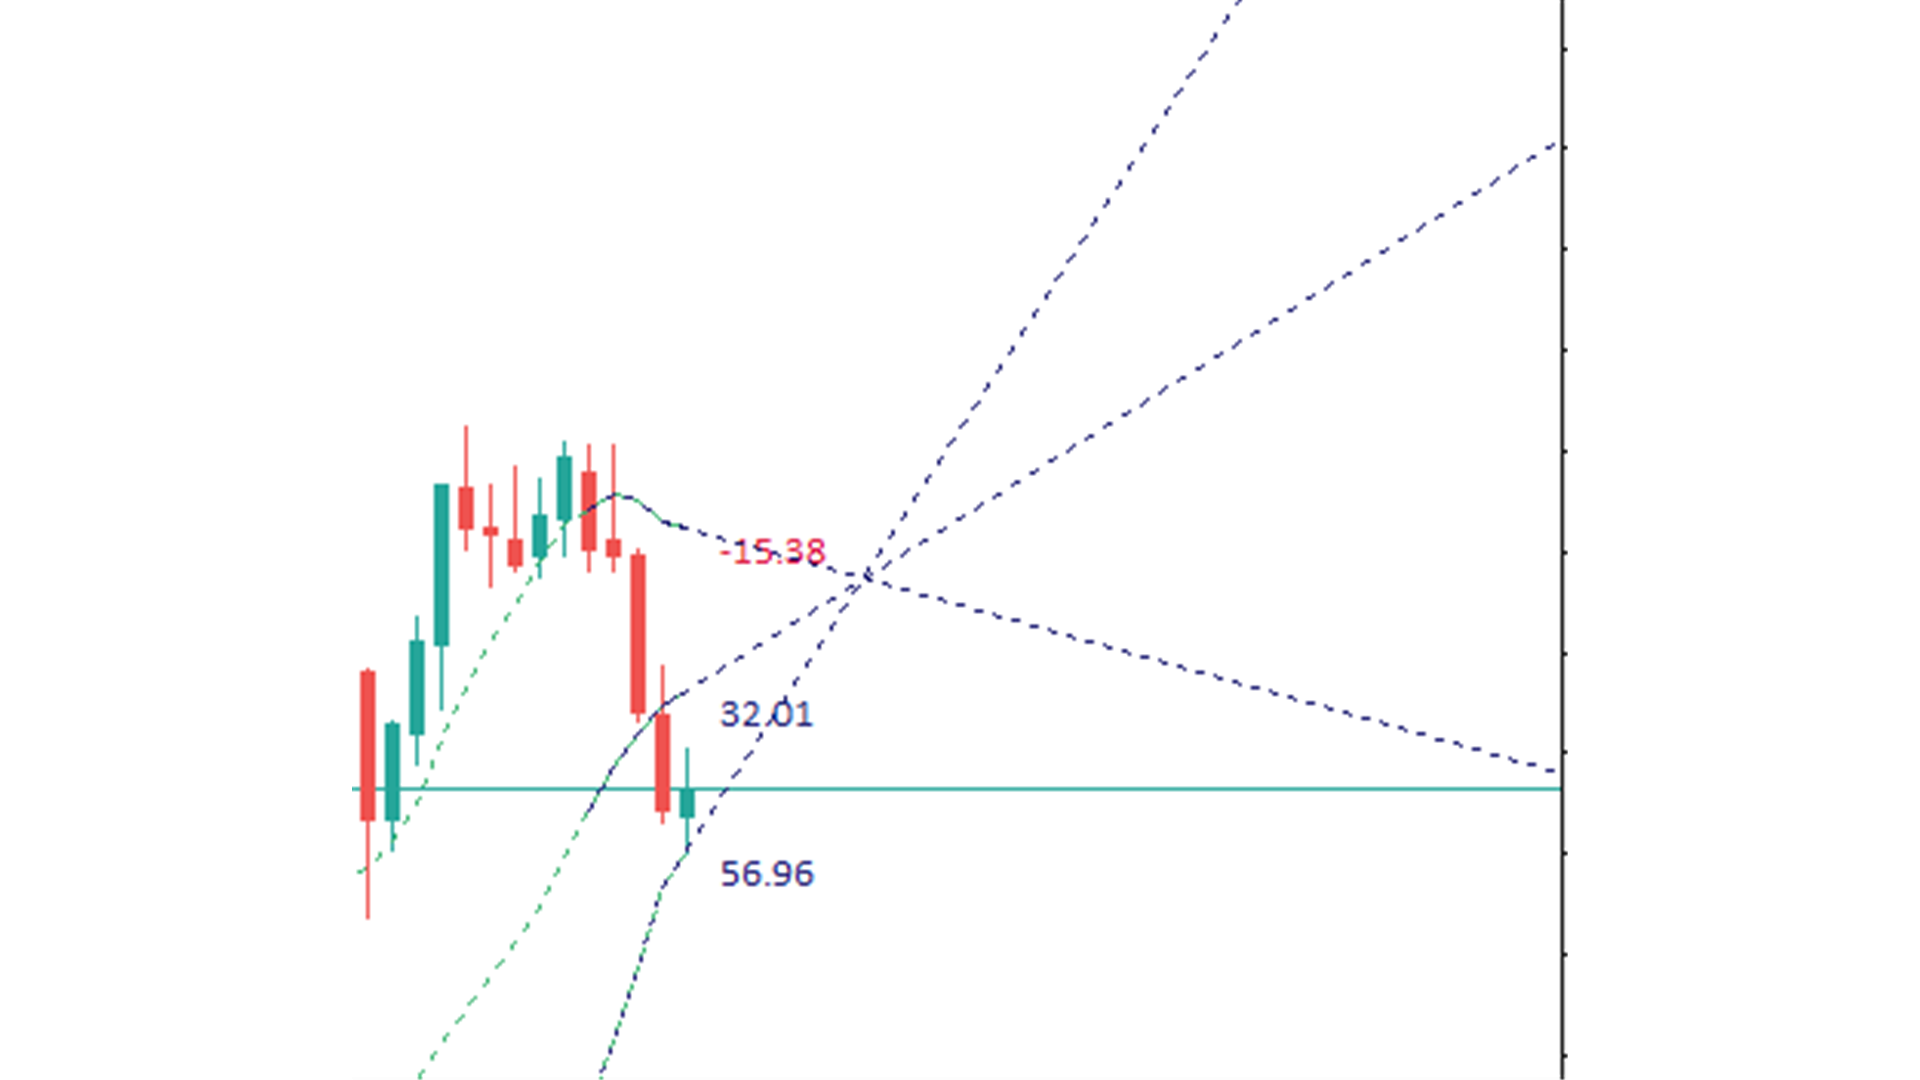
⑥ ボリンジャーバンドの中央線の角度
⑦ ボリンジャーバンドの下のバンドの角度
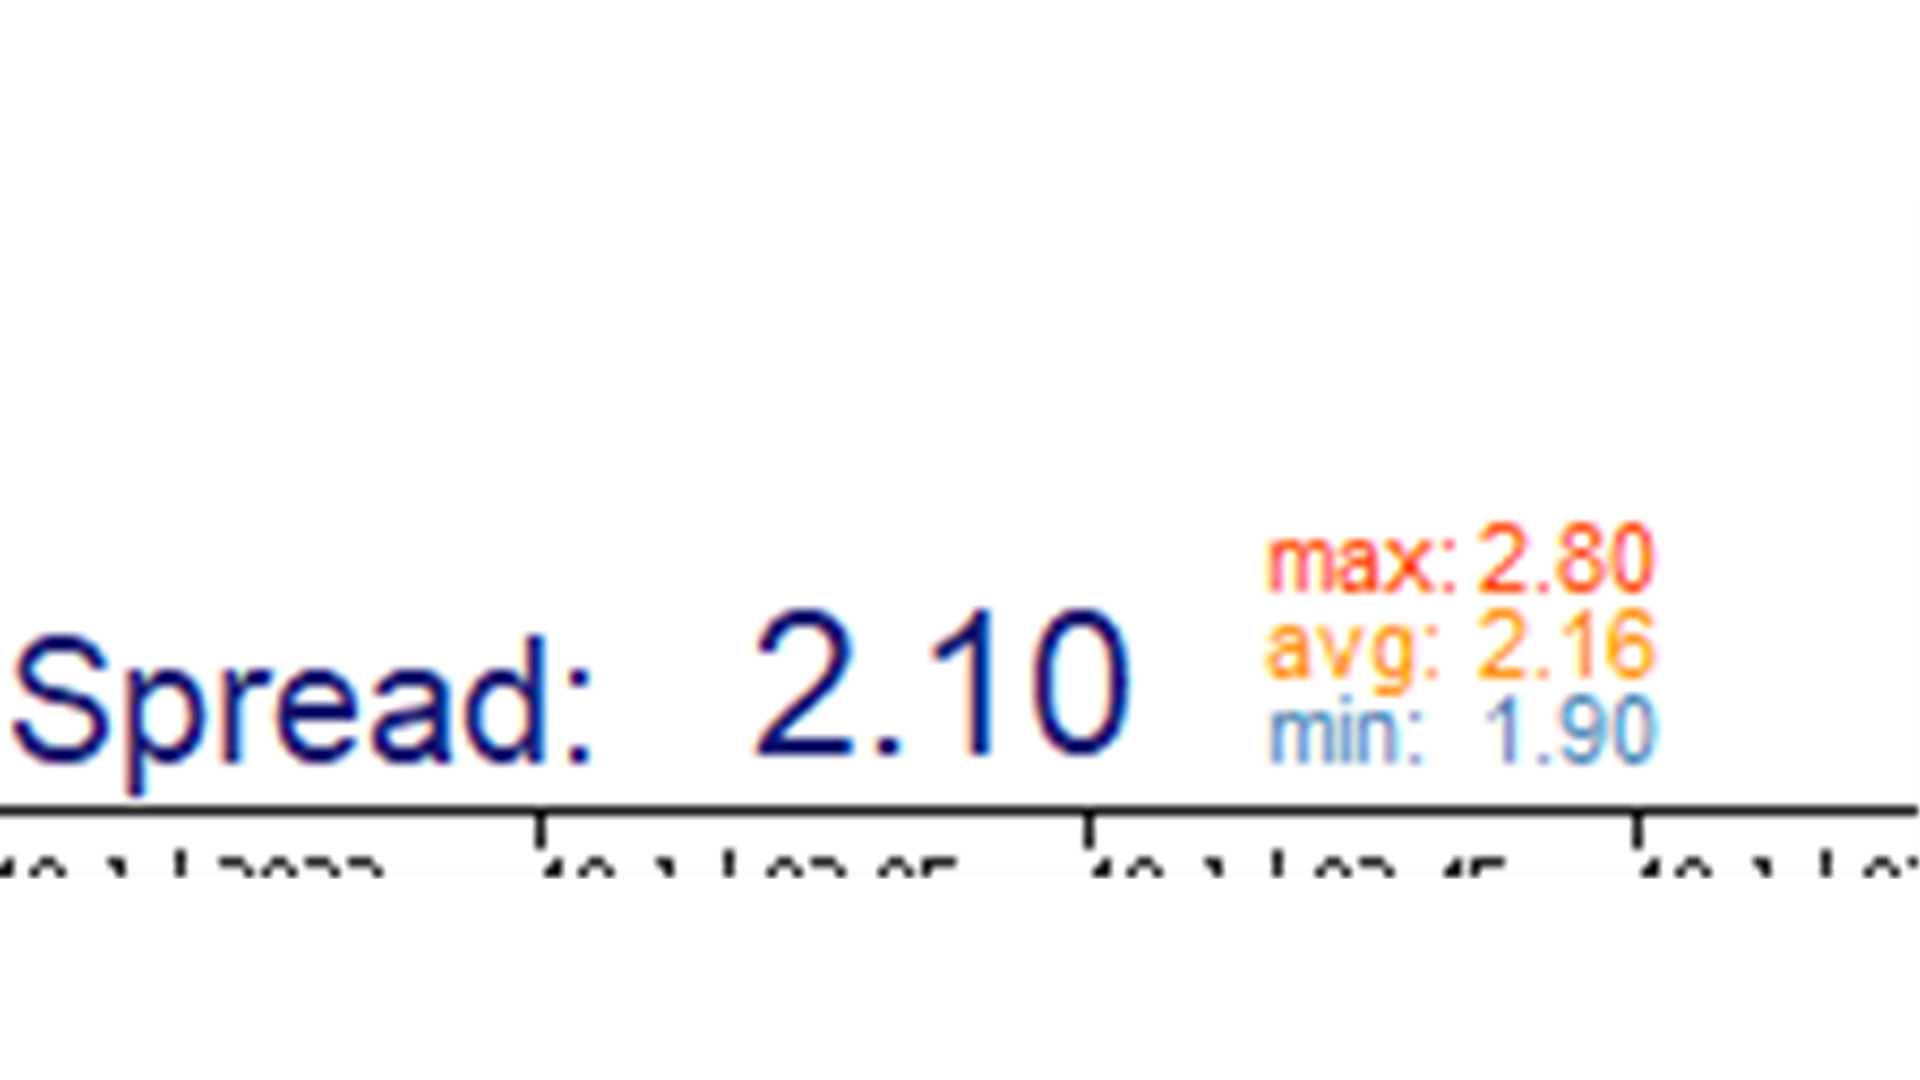
左下にスプレッドの情報も表示されます。
適用後の最大スプレッド、平均スプレッド、最小スプレッドを表示します。
※スプレッドを非表示も可能
TC-BBDataパラメータ
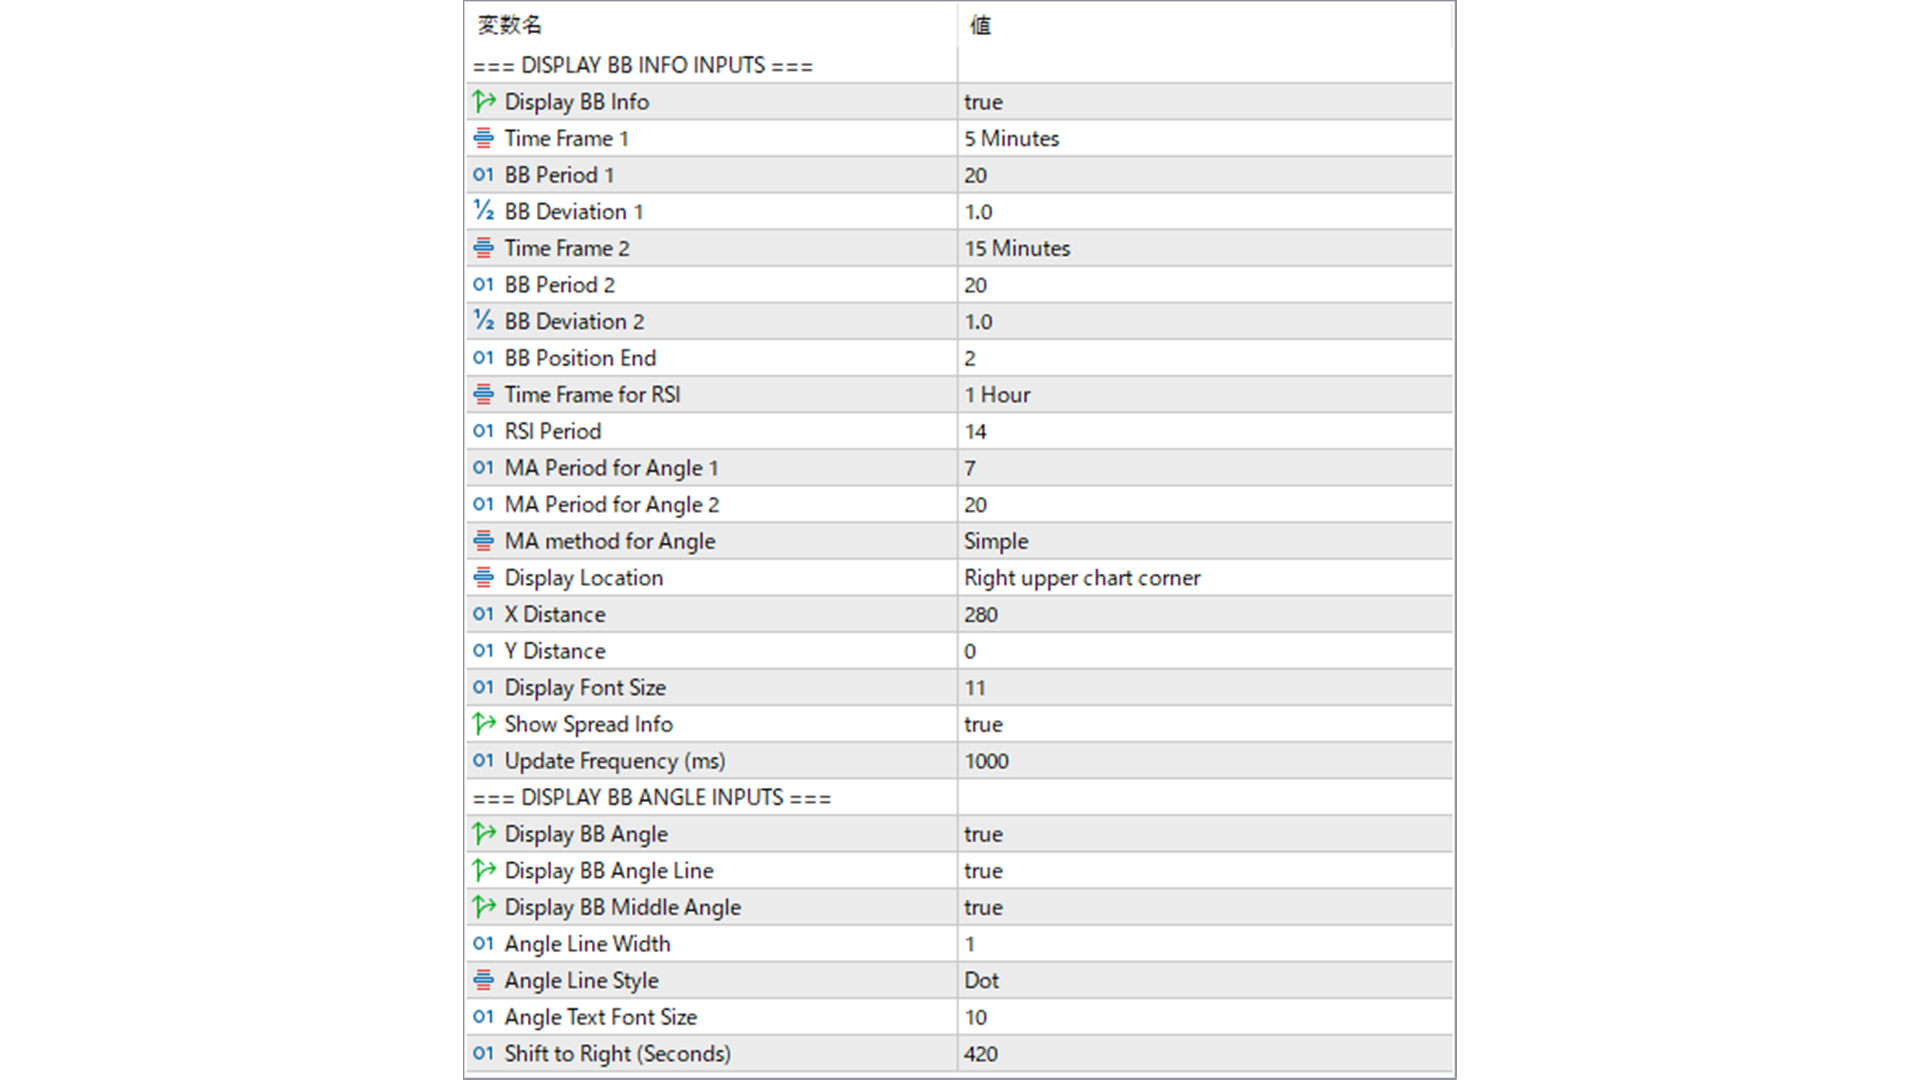
=== DISPLAY BB INFO INPUTS ===
■Display BB Info:BBの情報を表示(右上)するかを設定します。
■Time Frame 1:時間足を設定します。(MA,BB,ADXが使用)
■BB Period 1:BBの期間の設定します。
■BB Deviation 1:BBのDeviationを設定します。
■Time Frame 2:時間足を設定します。
■BB Period 2:BBの期間の設定します。
■BB Deviation 2:BBのDeviationを設定します。
■BB Position End:比較するBBの位置を設定します。
■Time Frame for RSI:RSIの時間足を設定します。
■RSI Period:RSIの期間の設定します。
■MA Period for Angle 1:角度1で使用する期間の設定します。
■MA Period for Angle 2:角度2で使用する期間の設定します。
■MA Method for Angle:MAの種類設定をします。
■Display Location:表示位置を設定します。
■X Distance:表示位置Xを設定します。
■Y Distance:表示位置Yを設定します。
■Display Font Color:表示の色の設定します。
■Squeeze Font Color:表示の色の設定します。(BB収縮時、角度がマイナスの場合)
■Display Font Size:表示のフォントサイズを設定します。
■Show Spread Info:スプレッド(左下)を表示するかを設定します。
■Update Frequency (ms):表示頻度を設定します。(1秒=1000ms)
=== DISPLAY BB ANGLE INPUTS ===
■Display BB Angle:BBの角度を表示するかを設定します。
■Display BB Angle Line:BBの角度のラインを表示するかを設定します。
■Display BB Middle Angle:BBの中央線を表示するかを設定します。
■Angle Line Width:ラインの太さを設定します。
■Angle Line Style:使用しているラインのタイプを設定します。
■Angle Text Font Size:フォントサイズを設定します。
■Angle Digits(0-2) : 角度表示の小数点以下を指定します。(0-2)
■Shift to Right (Seconds):BBの角度の表示を右側にどれだけシフトするかを設定します。