VR Grid Mt5
- Indicateurs
- Vladimir Pastushak
- Version: 24.40
- Mise à jour: 23 avril 2024
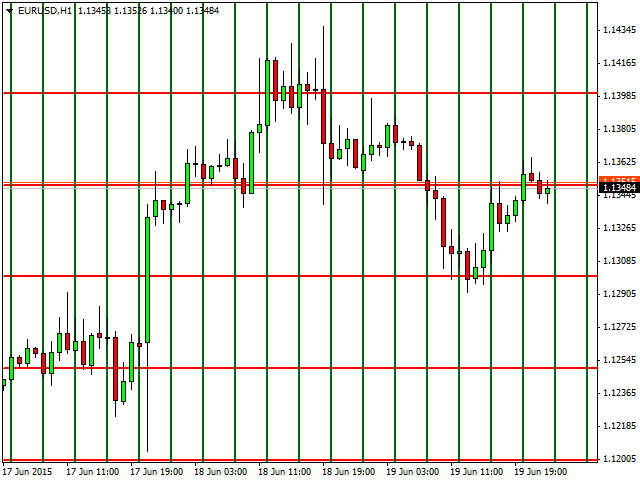
L'indicateur VR Grid est conçu pour créer une grille graphique avec des paramètres définis par l'utilisateur. Contrairement à la grille standard, VR Grid est utilisée pour créer des niveaux circulaires. Selon le choix de l'utilisateur, le pas entre les niveaux ronds peut être arbitraire. De plus, contrairement à d'autres indicateurs et utilitaires, VR Grid maintient la position de la grille même lorsque la période de temps change ou que le terminal est redémarré.
Les paramètres, les fichiers de configuration, les versions de démonstration, les instructions, la résolution de problèmes peuvent être obtenus auprès de [Blog]
Vous pouvez lire ou écrire des critiques sur [lien]
Version pour [MetaTrader 4]
Les niveaux verticaux sont basés sur des intervalles de temps réels et ignorent les périodes manquantes ou inexistantes. Ainsi, le pas entre les niveaux correspond strictement à la valeur sélectionnée par l'utilisateur.
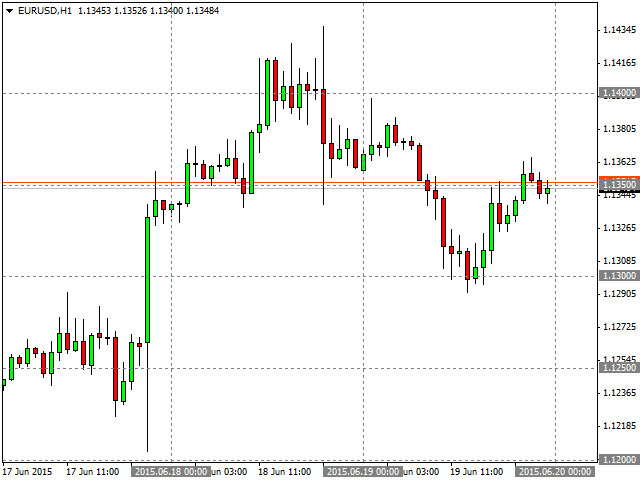
Lorsqu'il utilise l'indicateur VR Grid, un trader peut modifier le style, la couleur et l'épaisseur des lignes verticales et horizontales à n'importe quel niveau. Cela vous permet de contrôler les niveaux ronds d'un instrument financier.
Les niveaux ronds sont les prix qui se terminent par deux zéros ou plus (par exemple : 1,23500, 5,65900, 1923,200). On pense que de tels niveaux agissent souvent comme des points forts de support ou de résistance.
- Horizontal line settings
- Horizontal line step
- Horizontal line color
- Horizontal line style
- Horizontal line Width
- Vertical line settings
- Vertical line period step
- Period for step calculation
- Vertical line color
- Vertical line style
- Vertical line Width
- Other settings
- Button size
- Prefix object


Excellent indicator