Provlepsis Simple
- Indicateurs
- Ioannis Xenos
- Version: 1.0
Bienvenue dans l'indicateur Provlepsis.
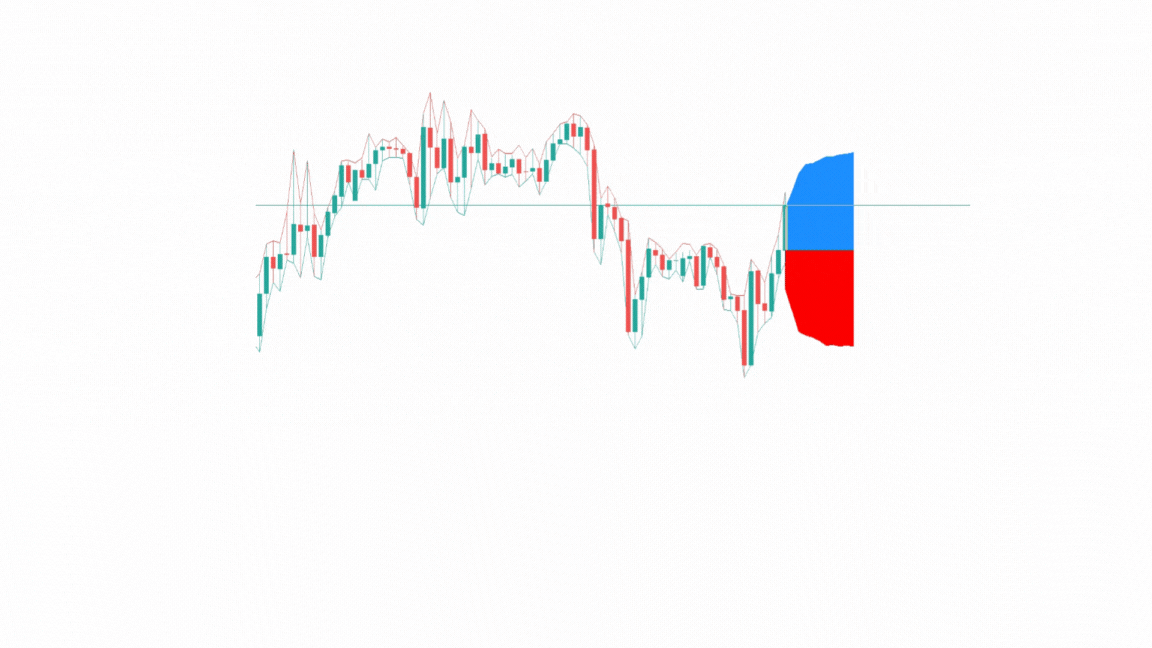
"Provlepsis" est un indicateur très avancé conçu pour le marché MQL. En analysant les bougies précédentes à la même heure de la journée, il calcule avec précision la plage potentielle de mouvement du marché, fournissant des informations précieuses sur les futures fluctuations de prix. Contrairement à l'indicateur ATR traditionnel, "Provlepsis" prend en compte le facteur temps, ce qui en fait un outil plus puissant qui s'adapte aux différentes conditions du marché. Pendant la nuit, l'indicateur prédit une plage plus étroite, tandis que pendant les heures de trading actives, il anticipe une plage plus large.
Obtenez un avantage concurrentiel dans votre stratégie de trading grâce à l'analyse complète de la plage fournie par "Provlepsis".
Vous pouvez vérifier ici la version complète, où vous pouvez changer la longueur et le décalage de l'indicateur Provlepsis !
https://www.mql5.com/fr/market/product/98802
Pourquoi utiliser Provlepsis
- Trading basé sur les gammes : La capacité de l'indicateur à identifier la plage potentielle de mouvement du marché peut être précieuse pour les stratégies de trading basées sur les gammes. Les traders peuvent utiliser l'indicateur pour identifier les niveaux clés de support et de résistance à l'intérieur de la plage projetée et exécuter leurs transactions en conséquence.
- Analyse de la volatilité : En tenant compte du facteur temps, "Provlepsis" peut fournir des informations sur la volatilité du marché. Les traders peuvent utiliser l'indicateur pour évaluer les périodes de volatilité faible ou élevée et ajuster leur gestion des risques et la taille de leurs positions en conséquence.
- Stratégies sensibles au temps : La focalisation de l'indicateur sur des périodes spécifiques permet aux traders de développer des stratégies adaptées à différentes sessions de marché. Par exemple, un trader peut ajuster son approche de trading pendant la nuit lorsque l'indicateur suggère une plage plus étroite, puis adopter une approche plus agressive pendant les heures de trading actives où une plage plus large est attendue.
- Confirmation de tendance : "Provlepsis" peut servir d'outil complémentaire pour la confirmation des tendances. Les traders peuvent comparer la plage projetée par l'indicateur avec la direction de la tendance pour valider la force de la tendance et prendre des décisions de trading plus éclairées.
- Placement des ordres stop loss : L'estimation de la plage par l'indicateur peut aider à déterminer les niveaux appropriés de stop loss. Les traders peuvent placer leurs ordres de stop loss en dehors de la plage projetée pour tenir compte des fluctuations potentielles du marché tout en maintenant une gestion des risques adéquate.
Guide de l'utilisateur
https://www.mql5.com/en/blogs/post/752850

Very smart and useful! Thanks for sharing!