Regardez les tutoriels vidéo de Market sur YouTube
Comment acheter un robot de trading ou un indicateur
Exécutez votre EA sur
hébergement virtuel
hébergement virtuel
Test un indicateur/robot de trading avant d'acheter
Vous voulez gagner de l'argent sur Market ?
Comment présenter un produit pour qu'il se vende bien
Nouveaux Expert Advisors et indicateurs pour MetaTrader 5 - 134

This indicator is an extended implementation of Weis waves. It builds Weis waves on absolute volumes (which is the classical approach) or delta of volumes (unique feature) using different methods of wave formation and visualization. It works with real volumes, if available, or with tick volumes otherwise, but also provides an option to use so called "true volume surrogates", as an artificial substitution for missing real volumes (for example, for Forex symbols), which was introduced in correspo

This is a non-parametric ZigZag providing 4 different methods of calculation. Upward edge continues on new bars while their `highs` are above highest `low` among previous bars, downward edge continues on next bars while their `lows` are below lowest `high` among previous; Gann swing: upward edge continues while `highs` and `lows` are higher than on the left adjacent bar, downward edge continues while `highs` and `lows` are lower than on the left adjacent bar. Inside bars (with lower `high` and
FREE

Victory Price Direction I'm glad to present you my new indicator.
This indicator includes all the best strategies that I have researched. When developing and optimizing, I used ML algorithms. The indicator is very easy to use.
Now the indicator has 3 basic strategies and the ability to customize your own strategy. I am constantly looking for better strategies.
You get: A simple and effective indicator of reversals. The indicator will help you place Take Profit correctly.

Sputnik it is a Secure Automated Software for trade Forex market and indices.
The architecture is a Fully Automatic Autonomous Robot Expert capable of
Independently analyzing the market and making trading decisions
Sputnik It is an advanced trading system. This is a fully automatic Expert Advisor. Sputnik is a plug and play system Sputnik It is a 100% automatic system, The system is self-sufficient, performing all the work. You can download the demo and test it yours

The indicator plots a curve of the difference between the values of two trading instruments (currency pairs).
The purpose of the indicator is to observe the processes of divergence and convergence of the values of two trading instruments. The results obtained can be used for trading strategies of statistical arbitrage, pair trading, correlation, and others.
Trading strategy
The indicator is attached to the chart of any trading instrument. In the input parameters, the names of trading i
FREE

新機能:Ver3.5 28通貨ペアの強弱も表示するようにしました。 監視ペアで最強、最弱の通貨ペアとなった場合、四つ葉のマークが出るように変更しました。 15分足、1時間足、4時間足単位での通貨ペアの強弱を表示するようにしました。
詳細な情報はこちらにサイトがあります。 https://toushika.top/tc-cs-plus-cfd/
注:こちらはTitanのデモ口座で動作します。 XMで使用したい場合は こちらのでセットファイル を使用してください。
機能: 一目で現在の通貨の方向性と強弱が確認できます。 15M,1H,4Hでの方向性を表示します。 15M,1H,4Hでの方向が揃った場合にドットが表示されます。 通貨の相関が揃った場合にドットが表示されます。 ※相関はピアソン相関係数を使用しています。 より詳しい情報につきましてはこちらを参照してください。 https://www.mql5.com/ja/articles/5481 通貨の強弱を表示します。 現時点でのボラリティーの状況を表示します。 過去20日/過去5日/今日のボラリティーを

The previous day's vwap is used by some traders as a support and resistance point, after all it is one of the ways to consider the fair price of that asset or that pair the day before. Possible defenses can occur in this region indicating a reversal, or triggering stops starting a new, more directional movement. It is a matter of analyzing how it will add to your operational.
To avoid manually drawing the previous day's vwaps and saving time for your analysis, use the Vwap Freeze indicator,
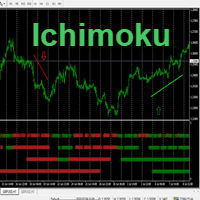
Hello This Indicator will draw Green (Up) and Red (Down) small arrows from Multi TimeFrames based in ( Ichimoku ) to help you to take decision to buy or sell or waiting If there 4 green arrows in same vertical line that's mean (Up) and If there 4 Red arrows in same vertical line that's mean (Down) and the options contain (Alert and Mobile , Mail Notifications). Please watch our video for more details https://youtu.be/MVzDbFYPw1M and these is EA for it https://www.mql5.com/en/market/product/590

SR Breakup Indicator it is an indicator based on support and resistance . It makes price breakout levels visible by opening the trader's mind to spot market opportunities.
Attention!!! This Indicator can be used in any time frame.
Suggestion of use Wait until the support and resistance lines are horizontal and closer. Do Trade (BUY): if price breakout resistance level (outside line). Do Trade (SELL): if price breakout support level (outside line). Use internal lines as Sto

WT Vwap 5 Bands
The WT Vwap Bands indicator is an indicator that combines price and volume, helping to show whether the price is within the "fair price", overbought or oversold.
The indicator code was designed for performance and has already been tested in a real trading account.
In addition to the visual inputs (color, thickness and line style), the user can define a% value that depends on the price.
The default values work with the most distant band at 1% of the price and then di

Buy and sell signals based on the Wave Setup strategy for entering a trade on the pullback after a reversal.
How does the indicator work? The indicator activates the buy and sell signal when their respective conditions are met. For an uptrend, we need a reversal up on the EMA9 followed by prices above the ascending SMA21 making a pullback and a touch on it. For a downtrend, we need a reversal down on the EMA9 followed by prices below the descending SMA21 making a pullback and a touch on it.

To calculate strength of currencies and to show in table There is 1 parameter: . Show recommended pairs: true/false -> To show top 1 of strong and weak currency Tips to trade: . To trade only with strongest vs weakest currency . When H1, M30, M15, M5 of specific currency is up or down -> consider to open BUY/SELL . It can combine: + strongest currency vs weakest currency + strongest currency vs 2nd weakest currency + 2nd strongest currency vs weakest currency
FREE

It is the very same classic Stochastic indicator, but with a little twist: NO NAME and data is shown in the sub window. It could be stupid, BUT, if you are running out of space in Micro windows like Mini Charts, where the indicator's name is totally useless, you came to the right place. And that's it! I know it seems stupid but I needed the classical version of Stochastic indicator without that annoying name on my Mini Chart, so I did it that way... The original formula is right from Metaquote's
FREE

this is a multi-functional orders all closing script
MT4 version
Feature: 1, it can close all orders of the chart symbol or all symbols. (select mode) 2, it can close all orders of buy, sell or both type. 3, it can close all orders of profit, loss, or any. 4, you can specify magic number, order comment as filters for the order closing operation. 5, it can also do partial closing by percentage to all orders.
it's strongly recommended to set a "hotkey" to this script when you use it. wish
FREE
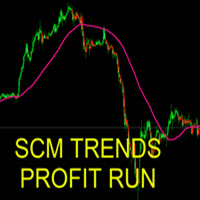
The indicator can be used in several ways. The simplest is to buy when the SCM Trends Profit Run line is painted green and sell when it is red. This indicator that allows you to detect several changes and dynamics in price that many traders can’t estimate or see without an indicator, which highlights its essence and usage.
Accordingly, traders can draw conclusions and make estimates about how the prices will change based on the information they have and then they can modify their strategy fo

The safest Martin EA实际表现可见信号 https://www.mql5.com/zh/signals/814986 The safest Martin 是一个多货币 EA,采用马丁策略,以其自有的波段算法为基础,并配以控仓技巧。只有价格到达关键位后EA才会发生交易。 The safest Martin 使用即时交易 4种货币对:EURUSD、AUDNZD、NZDUSD、USDCAD,GBPCAD。算法信号通过十年数据跑测验证,可以实现平稳盈利。 EA 在所有时间框架上都有效,不会丧失其盈利能力。然而,在 H4上观察到了最大效率。在此周期上的风险/盈利比最好。 建议使用账户余额在美元 10000 以上,且每一万美金的仓Lots建议0.01开始。
Lots 是选择固定手数后的具体数值。 H01Symbol--H05Symbol 是参与操作的7个货币对。请根据交易商特有商品表示对应改动。货币对后缀添加。

The Trend Quality Indicator (by David Sepiashvili) is intended to measure trend activity. Some benchmarks can be used to determine the strength of a trend.
In the range of values from -1 to +1 ( Ignored zone parameter) , the trend is buried beneath noise. It is preferable to stay out of this zone.
The greater the value, the less the risk of trading with a trend, and the more reliable the trading opportunity.
The range from +1 to +2, or from -1 to -2, may be treated as zone of weak tr

Support And Resistance Screener est dans un indicateur de niveau pour MetaTrader qui fournit plusieurs outils à l'intérieur d'un indicateur. Les outils disponibles sont : 1. Filtre de structure de marché. 2. Zone de repli haussier. 3. Zone de recul baissier. 4. Points pivots quotidiens 5. points pivots hebdomadaires 6. Points pivots mensuels 7. Support et résistance forts basés sur le modèle harmonique et le volume. 8. Zones au niveau de la banque. OFFRE D'UNE DURÉE LIMITÉE : L'indicateur de sup

This is an advanced multi-timeframe version of the popular Hull Moving Average (HMA) Features Two lines of the Hull indicator of different timeframes on the same chart. The HMA line of the higher timeframe defines the trend, and the HMA line of the current timeframe defines the short-term price movements. A graphical panel with HMA indicator data from all timeframes at the same time . If the HMA switched its direction on any timeframe, the panel displays a question or exclamation mark with a tex

Trend Power Indicator is an indicator which helps to identify trend direction and its power by using moving averages ZigZag pattern and correlations of tradable instruments. It provides trend power data with user-friendly interface which can be read easily and fast. This indicator by default is configured for trading of Adam Khoo's ( Piranhaprofit ) strategies. It saves mass of time for searching of tradable pairs by his strategies. It indicates when all required moving averages are align

The new indicator is a trend predictor for the current chart as well as other symbols and timeframes. Every button on the board is interactive. By default, you have 20 currency pairs in the watchlist and three timeframes (M5, H1, D1) but you can choose the periods and symbols you want to display from the menu.
If the indicator is blue, it indicates the beginning of an uptrend. If it is red, it indicates the beginning of a downtrend.
In capture # 3 (Daylight mode) I will explain each element
This cost averaging Expert advisor (EA) places additional trades in the same direction as the original (manually opened) order when the price goes against you. It can be used as a grid system or as pure martingale system (exponential increasing of lot size) or smoothed martingale (for instance linear increasing of the lot size). Due to the risk involved, this EA is more suitable for intermediate to advanced traders who are well aware of how to handle risk management and trading an already profit

Graph configuration and buy and sell signals based on Stormer's (Alexandre Wolwacz, Brazilian trader) swing, position and day trade strategy, described on his youtube channel (https://www.youtube.com/watch?v= 0QZ_NjWkwl0)
The buy and sell indications are based on 2 candle patterns ( Inside Bar [Yellow] and Reversal Closing Price [Blue and Red] ), 3 Moving Averages and 1 Stochastic .
Indicators: Inside Bar - Candle pattern indicating trend continuity, or reversal Reversal Closing Price - Ca
FREE

O Indicador CoioteChart foi construído pra facilitar desde a leitura de contexto de mercado até a micro estrutura do candle, facilitando ajustes operacionais e tomadas e decisão com alta eficácia.
Possui um controle para habilitar e desabilitar a visualização das pocs, vwap, zonas de máxima e mínima negociação, pode ser utilizado data sources de tempos gráficos para cálculos ou utilizado os ticks de agressão do time and trades, funciona com volume real e volume de ticks.
As colorações são at
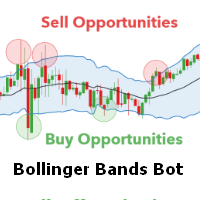
The Strategy this EA uses Bollinger Bands as indicator and Standart Deviation to determine good and safe signals; it automatically calculates Take Profit and Stop Loss based on Bollinger Bands; it is also provided with Trailing Stop Loss and Trailing Take Profit; it has a pannel to keep you informed about the EA's activities. Short Positions Inputs Lots volume for Short Positions; Trailing take profit for Short Positions; Trailing stop loss for Short Positions; Maximum number of simultaneous Sho

VolumeDeltaScanner is a volume delta monitor for multiple (up to 10) time scopes. It works by online ticks or history ticks. Indicator monitors tick volumes for buys and sells separately, and find their delta on every bar and larger scopes, then displays the volume deltas for all the scopes. Every scope is presented by its own buffer/line. The smallest scope is the current timeframe. It's required. All other scopes should be multiples of it. For example, if placed on a M5 chart, it can calculat
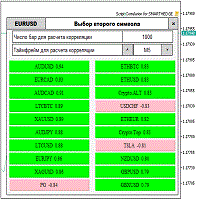
Script for quickly selecting a tool with high correlation. The script is placed on the tool to which you need to select the second correlating one. Then you can change the number of bars to calculate and the timeframe. The script iterates through all available symbols in the market overview and returns the 20 most correlated ones. You can use the selected pairs to trade with THE new SH expert Advisor
FREE

ToolBot Probabilistic Analysis - FREE An effective indicator for your negotiations
The toolbot indicator brings the calculation of candles and a probabilistic analysis so that you have more security on your own.
Also test our FREE tops and bottoms indicator: : https://www.mql5.com/pt/market/product/52385#description Also test our FREE (RSI, ATR, ADX, OBV) indicator : https://www.mql5.com/pt/market/product/53448#description
Try our EA ToolBot for free: https://www.mql
FREE

It is a Graphical and Trend indicator that brings several advantages. Eliminates noise.
Facilitates the identification of the trends. Can be used as directional force indicator. Identify lateralization: candles with close and open price closer. Identifies high volatility: candles with shadows larger than the body. Attention!!! Works on any asset and any time frame.
Easy setup Symbol: anyone Time frame: anyone Parameters: Indicator Period Recommended Period : betw

The indicator identifies two most important patterns of technical analysis - Pin Bar and Engulfing. MT4-version: https://www.mql5.com/en/market/product/53591 Settings: Mincandle size for PinBar - The minimum size of the Pin-Bar candlestick; Percentage of candle body on size - The percentage of the candle body in relation to its length; PinBar Alert - Alert when a Pin-Bar is detected; PinBar Mail - Sends an email when a Pin Bar is found; PinBar Notification - Sends a push notificati

This Indicator is based on the high's moving average and the low's moving average for trend following and/or trailing stops.
How does the indicator work? The indicator plots the uptrend dots until there is a close below the moving average of the lows. When this happens, a downtrend begins and is plotted until there is a close above the moving average of the highs. When this happens, another uptrend begins. And so it goes.
How to use it? - Trend following: You can use it as buy signals when

Do you already know Display N Bars?
Do you already know the Start tool (from Midas indicators)?
In this indicator, we unified the two tools, allowing you to define which candle will start counting, or use the automatic numbering that was already available in the previous version.
Description of the utility follows:
Display N Bars
The Display N Bars utility is a simple tool that aims to help identify candles.
If a trader tries to share the knowledge with a colleague but it i
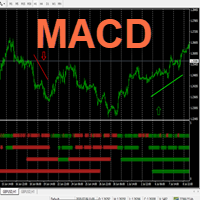
Hello This Indicator will draw Green (Up) and Red (Down) small arrows from Multi TimeFrames based in ( MACD ) to help you to take decision to buy or sell or waiting If there 4 green arrows in same vertical line that's mean (Up) and If there 4 Red arrows in same vertical line that's mean (Down) and the options contain (Alert , Mobile and Mail Notifications). Please watch our video for more details https://youtu.be/MVzDbFYPw1M and these is EA for it https://www.mql5.com/en/market/product/59092 G

This expert advisor joins 18 strategies on crosses and changes, each of them identify a gap on specific custom sessions and try to close the gap. All the parameters are in the code so you can select only the size used for each strategies the base magic number: the real magic numbers used strating from base+1 to base+18. You can specify also the "Suffix" parameters, a special char following the name of the cross in some brokers (eg: EURUSD. EURUSD# EURUSDm) You can also activate/deactivate eve
FREE

Candle de Volume Coiote O Candle de Volume Coiote é um indicador que mede a variação do volume no tempo, seu corpo é pela variação do volume anterior pelo volume atual, sua direção pelo fechamento do preço.
1. identificado um topo no indicador Candle de Volume Coiote (marcado o fechamento do preço).
2. identificado um fundo no indicador Candle de Volume Coiote (marcado o fechamento do preço).
3. fundo 3 igual fundo 2 no indicador Candle de Volume Coiote, preço no 3 é diferente de fundo 2

Candle com coloração de Volume Price Analysis (VPA) segundo as definições da Anna Coulling, é possível configurar períodos de climax e rising, fator de extreme e fator de rising.
Pode-se usar volume real ou volume de ticks. O VPA considera a variação de preço por volume do período, indicando se um movimento está recebendo ignição, está em seu climax ou se já não existe mais interesse.
TrendFollowMT is a fully automated trading system which is using large time frame to determine the trend and use small time frame to find the entry point. Once the trend changed to opposite side, the system will wait for another entry point to recover with bigger lot size. Moreover, the target profit will be moved up when more position had been opened. The aim is to cover the cost of waiting time and risk.
Free version will only trade on buy signal and locked the initial Lot size (0.01). Paid
FREE

Indicador que cria um painel para acompanhamento to total de posições abertas no ativo do gráfivo.
São apresentados os dados: Ativo do gráfico Total de posições de venda em aberto Quantidade do volume de posições de venda em aberto Total de posições de compra em aberto Quantidade do volume de posições de compra em aberto.
Painel simples mas eficiente para o equilíbrio das ordens
FREE
TrendFollowMT is a fully automated trading system which is using large time frame to determine the trend and use small time frame to find the entry point. Once the trend changed to opposite side, the system will wait for another entry point to recover with bigger lot size. Moreover, the target profit will be moved up when more position had been opened. The aim is to cover the cost of waiting time and risk.
Trend filter: ADX and zzFibo (suggest time frame: H4) Entry: RSI and Pin bar (use curren

The Price Action Finder indicator is an indicator of entry points, which is designed to search and display patterns of the Price Action system on a price chart. The indicator is equipped with a system of trend filters, as well as a system of alerts and push notifications. Manual (Be sure to read before purchasing) | Version for MT4 Advantages
1. Patterns: Pin bar, Outside bar, Inside bar, PPR, Power bar, Hanging man, Inverted hammer 2. Pattern filtering system. Removes countertrend patterns fro
EA finds the largest volume in the market and determines the level for entry. After crossing the level towards the breakdown, a market order is opened. The EA builds a two-sided grid of orders, adapting to the market. Each direction of orders works separately and has its own take-profit. Thus, the adviser covers the whole trend, starting from its start, while the adviser perfectly passes the flat market condition, trading both directions. Please see all my products: https://www.mql5.com/en/user
FREE
Hello.
CatchCandleLimitOrderOneSymbol-flat expert Advisor, for opening orders from the channel borders to the center, works on pullbacks from the support and resistance levels, from the custom channel width indicator TMA, with a fixed S/L and T / P. The EA is designed to trade off the levels when a particular trend movement, and is no doubt the continuation of the trend, the Levels are shifted automatically with the price based on the channel boundaries and the extreme price deviation for a be

Légèrement modifié pour la vitesse. les testeurs sont requis pour un nouveau conseiller, qui est intéressé, écrivez-moi par email 777basil@mail.ru
L'indicateur est calculé en fonction des changements de prix dans l'historique et est calculé mathématiquement, recalculé à chaque fois que les données sont reçues à nouveau. Il peut être utilisé sur différents délais. À partir des frontières de l'indicateur dans 70%, il y a un changement dans la direction du mouvement des prix ou de la consoli
FREE
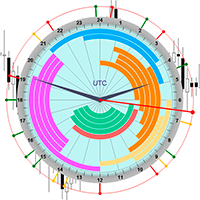
The professional browser of News and Trading Sessions is now available in MetaTrader 5.
Now all the most important market information is collected on one dial!
News located on the Time scale. Planning your working time has never been so easy and convenient ... The news scale can be switched a day, two, a week, a month forward or backward (see the details in the short video). All news updates in real time.
Thanks to the built-in filters, you can configure the display of news by importanc

The indicator is based on indicators built-in standard indicators, the indicator take into account the current indicators 30 indicators and give a signal to buy or sell, the General trend of all trends of other indicators. In the input parameters, you can configure special parameters for each indicator. the indicator is executed in the form of an oscillator and shows the General trend and the preponderance of all indicators in one or the other direction. https://youtu.be/UG2ZZEH9B_U
FREE
MT4: https://www.mql5.com/en/market/product/52715
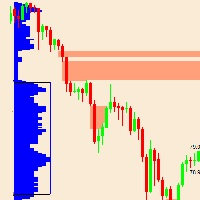
This indicator is based on market profile theory. What exactly is a singles area? Theory: Market Profile Singles : Singles or single prints or gap of the profile are placed in the inside of a profile structure, not at the upper or lower edge. They are represented with single TPOs printed on the Market profile. Singles draw our attention to places where the price moved very fast (impulse movements). They leave low volume nodes with liquidi

FXC iRSI-DivergencE MT5 Indicator
This is an advanced RSI indicator that finds trend-turn divergences on the current symbol. The indicator detects divergence between the RSI and the price movements as a strong trend-turn pattern.
Main features: Advanced divergence settings
Price based on Close, Open or High/Low prices Give Buy/Sell open signals PUSH notifications
E-mail sending Pop-up alert Customizeable Information panel Input parameters: RSI Period: The Period size of the RSI indicator.
R

This Expert advisor is advanced with Force indicator which detects the momentum change and cuts the position by using its intelligence Where it generates revenue in long term .User can change the lot size based on risk calculation which provided by our team .It differs from other EA where this suits for long term usability with decent returns ,This has to be run on EURUSD 1 hr time frame ,Minimum recommended capital is 500 dollar ,still clients can operate in low capital by changing the lot size

This indicator has the main purpose of showing the current spread of the asset in which the indicator was placed. Depending on the photos, visually and within the graph itself, it is possible to view the spread value at the current time, it is possible to change the vertical position of the text and the horizontal position, in addition to the font size and color of the text.
FREE

Excellent dashboard for market analytics. The panel helps to analyze the values of the Ichimoku indicator and its signals.
With this panel you can: watch the current signal from Ichimoku on all timeframes; watch the current signal from Ichimoku for different symbols; watch the current Ichimoku value; several types of signals for analytics.
Values in a table cell:
Value of Tenkan-Sen Value of Kijun-Sen Value of Senkou Span A Value of Senkou Span B Value of Chikou Span S
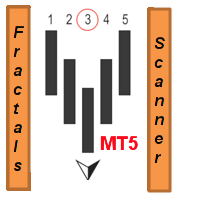
This multi time frame and multi symbol indicator identifies fractals patterns. As a bonus it can also scan for Parabolic SAR (pSAR) trend changes. Combined with your own rules and techniques, this indicator will allow you to create (or enhance) your own powerful system. Features
Can monitor all symbols visible in your Market Watch window at the same time. Apply the indicator to just one chart and instantly monitor the entire market. Can monitor every time frame, from M1 to MN, and sends you a r

KT Renko Patterns scans the Renko chart brick by brick to find some famous chart patterns that are frequently used by traders across the various financial markets. Compared to the time-based charts, patterns based trading is easier and more evident on Renko charts due to their uncluttered appearance.
KT Renko Patterns features multiple Renko patterns, and many of these patterns are extensively explained in the book titled Profitable Trading with Renko Charts by Prashant Shah. A 100% automate

Mercury MT5 it is a Secure Automated Software for trade Forex market and indices.The architecture is a Fully Automatic Autonomous Robot Expert. Mercury MT5 It is an advanced trading system. The system is ideal for consolidated market. You can download the demo and test it yourself.
Very stable growth curve as result of smart averaging techniques.
"Safety first" approach in development. Stress-tests on historical data for multiple pairs. Broker type: Low spread, f

An adaptive and under fitted trading system like no other The best settings of one symbol also work on a majority of other symbols The majority of settings within the optimization parameters test well Three versions for different types of accounts This version here is designed for MT5 hedge accounts The MT5 netting version is here: https://www.mql5.com/en/market/product/52725 The MT4 FIFO version is here: https://www.mql5.com/en/market/product/52867 Check out all 3 versions for many more testi

ToolBot Advisor Indicator (RSI, ATR, ADX, OBV) FREE An effective indicator for your negotiations
The toolbot indicator and advisor brings leading (OBV) and lagging (RSI, ATR, ADX) indicators so that you have more security in your negotiations. In addition, it informs you of possible up and down trends as well as providing you with incredible advisors who will give you information about trading opportunities.
With this indicator you will have more security and speed in your decision making
FREE

Genaral: Not martingale, not a grid; Use on EURUSD Use on M5
Signals: There is a good rational algorithm. Work of two indicators: CCI and OsMA (from 2 timeframes) (you can set a separate Timeframe for each indicator)
Stop Loss/Take Profit: There is a good money management system (there are several type for trailing stop loss); There is virtual levels of Stop Loss / Take Profit; There is smart lot (percent by risk) or fix lot
Important: EA can work on closed candles, and on current can
FREE

Moving average indicator to work with the F12 Replay simulation and replay tool.
In this way, the F12 Replay tool now supports the moving average indicator.
F12 Replay: https://www.mql5.com/pt/market/product/38313
This is a product developed by Renato Fiche Junior and available to all MetaTrader 5 users!
Partners: "Águia Traders" team ( Eagle Traders ) by Larissa Sihle #aguiatraders #larissasihle
Input Parameters
Period Shift Method
FREE

Tick channel scalper for flat markets or for markets with frequent pullbacks. The robot is set to EURAUD. Brokers with minimal spreads and commissions are recommended. For example Rannforex.com or ICMarkets.com The EA has a unique algorithm that works on ticks and does not depend on the timeframe. Opening hours are configurable. Trading is possible both at any time period and around the clock.
File for optimisations and test on Tester include in my blog - https://www.mql5.com/ru/blogs/post/

Investologic Trading robot MetaTrader5 PC platform
The EA is for the professional traders. Users MUST do some intensive test using "strategy tester" to fit user's needs and to confirm that this EA will works for you.
Trend following EA and artificial inelegance that have the ability to trade on motive waves and skip the volatile choppy market, the EA work with any symbol market or timeframe in the MT5 platform ex. FOREX, GOLD, OIL, STOCKS, INDEXES, NASDAQ, SPX500, Bitcoin & Crypto.

Description
Range Detector is an indicator that identifies ranges in the market and displays their presence on the price chart.
Recommendations
You can use this indicator to determine the flet and, accordingly, to determine the direction of opening a position or closing an opposite position.
Parameters
Maximum History Bars - maximum number of history bars for calculating the indicator. Average True Range Period - ATR indicator period (used to calculate the difference between mov

O indicador imprime a linha da média longa quando as médias media e curta estão confinadas dentro dos limites de 1 ATR (average tru range) da média longa. Após períodos de congestão os preços se movimentam fortemente em uma direção. Este indicador não fornece pontos de entrada, apenas mostra que as médias estão bastante próximas. Parâmetros: Periodmalongo: Período da média longa. Periodmamedio: Período da segunda média. Periodmamedio2:Período da terceira média. Periodmacurto: Período da média cu
FREE

Mostra a média móvel quando ADX > 20 e pinta de verde ou vermelho quando os valores de ADX estão subindo indicando tendência. Quando o ADX é menor que 20 indica movimento lateral consolidado. O indicador não define pontos de entrada, somente mostra a média colorida quando a tendência está se fortalecendo. Faz parte do grupo de indicadores do Indicador Tavim.
FREE

Description : Rainbow MT5 is a technical indicator based on Moving Average with period 34 and very easy to use. When price crosses above MA and MA changes color to green, then this is a signal to buy. When price crosses below MA and MA changes color to red, then this is a signal to sell. The Expert advisor ( Rainbow EA MT5 ) based on Rainbow MT5 indicator is now available here .
MT4 version is available here .
FREE

Phenix MT 5 - это автоматизированная торговая система, основанная на стратегии скальпинга. Данный советник оптимизирован только для валютной пары EURJPY с таймфрейм H 4. Советник использует для заключения сделок сигналы от хорошо известного индикатора M oving A verage. Для сохранения вашего депозита, в советнике реализованы несколько систем защиты . Одна из таких это StopLevel - это уровень просадки депозита при достижении которого советник перестает торговать. Рекомендуемое значение StopLevel -
Trade with your MT5 Account on a custom API-Endpoint.
1. Activate API on your Signal Site.
2. Enter your Username.
3. Enter your Account-Password.
4. Enter the API-Endpoint URL to your MT5 Account (Extras -> Options -> Experts -> Allow WebRequest).
Lot Size Settings
Auto Lot = 0 and Fixed Lot = 0 : Copy Lot Size.
Auto Lot : Option to send normalized Lot-Size depends from Free Margin on Trading-Account. Because other Traders will start with different Account Size.
For Example:

Утилита Горячие Клавиши. Работает только на неттинговых типах счетов. Позволяет совершать торговые операции без мыши. Удобно использовать для акций, фьючерсов, валютных пар, криптовалют. В совокупности со стаканом получается полноценный скальперский привод.
Реализованные команды : · покупка по рынку; · продажа по рынку; · выставление лимитного ордера на покупку с заданным отступом (может быть отрицательным) от цены Бид; · выставление лимитного ордера на прод
FREE

ARSINIUM is brand new Multi Strategy EA where you are able to define your Entry Points like a PRO! Originally it was developed as a Scalper for lower Timeframes, but we saw that the Entry Points, combined with some Filters, and other useful Options, are more than that. It works in many different Conditions and has many different Strategies you can build on your own. Test it for yourself and find out the best Strategy inside the Strategy! We offer this for 99 USD for a limited time to support

Excellent dashboard for market analytics. The panel helps to analyze the values of the RSI indicator and its signals.
With this panel you can: watch the current signal from RSI on all timeframes; watch the current signal from RSI by different symbols; watch the current RSI value; several types of signals for analytics.
Values in a table cell: RIS value.
Signal type: RSI crosses level buy out/level sell out (outside); RSI crosses level buy out/level sell out (inside);
RSI is u

Genaral: Not martingale, not a grid; Use on EURUSD Use on M5 EA was opimized only on 2020 year
Signals: There is a good rational algorithm. Work of 3 indicators: WRP, DeMarker, CCI (from 3 timeframes) (you can set a separate Timeframe for each indicator)
Stop Loss/Take Profit: There is a good money management system (there are several type for trailing stop loss); There is virtual levels of Stop Loss / Take Profit; There is smart lot (percent by risk) or fix lot
Important: EA can work
FREE

It is very easy to use the Fibrillar indicator, since the simplest is to look at the chart and act according to the indications of the colored arrows. The algorithm takes into account the measurement of prices, and this method also focuses on measuring each of the price drops (H / C, H / O, LC, LO) - which gives more detailed information, but also more averaged.
When calculating this indicator, logarithmic gains are first calculated at the closing price, which allows you to filter out the tre
Le MetaTrader Market est la seule boutique où vous pouvez télécharger un robot de trading de démonstration gratuit pour le tester et l'optimiser à l'aide de données historiques.
Lisez l’aperçu de l'application et les avis d'autres clients, téléchargez-la directement sur votre terminal et testez un robot de trading avant de l'acheter. Seul MetaTrader Market vous permet de tester gratuitement une application.
Vous manquez des opportunités de trading :
- Applications de trading gratuites
- Plus de 8 000 signaux à copier
- Actualités économiques pour explorer les marchés financiers
Inscription
Se connecter
Si vous n'avez pas de compte, veuillez vous inscrire
Autorisez l'utilisation de cookies pour vous connecter au site Web MQL5.com.
Veuillez activer les paramètres nécessaires dans votre navigateur, sinon vous ne pourrez pas vous connecter.