 MetaTrader 5
 Experts
 Indicateurs
 Scripts
 Bibliothèque
 Stockage
Rejoignez notre page de fans

Multi Timeframe Trend Dashboard Indicator - indicateur pour MetaTrader 5

- Vues:
- 50
- Note:
- Publié:
-
 Vous manquez des opportunités de trading :
- Applications de trading gratuites
- Plus de 8 000 signaux à copier
- Actualités économiques pour explorer les marchés financiers
Inscription Se connecterVous acceptez la politique du site Web et les conditions d'utilisation
Si vous n'avez pas de compte, veuillez vous inscrire -
 Besoin d'un robot ou d'un indicateur basé sur ce code ? Commandez-le sur Freelance
Aller sur Freelance
Besoin d'un robot ou d'un indicateur basé sur ce code ? Commandez-le sur Freelance
Aller sur Freelance

Tableau de bord des tendances sur plusieurs périodes
Le principe
Trader en suivant la tendance sur des périodes plus longues implique généralement de passer d’une fenêtre de graphique à l’autre, ne serait-ce que pour répondre à une seule question : ce titre suit-il réellement une tendance, et dans quelle direction, sur les périodes qui comptent pour la configuration ? Cet indicateur répond à cette question en un seul coup d’œil. Pour chaque période que vous activez — de M15 à W1 —, il crée sa propre paire indépendante de moyennes mobiles rapide et lente sur cette période, lit les dernières valeurs et affiche le résultat sous la forme d’une seule ligne codée par couleur : haussier lorsque la moyenne rapide est supérieure à la moyenne lente, baissier lorsqu’elle est inférieure, et neutre lorsqu’elles sont pratiquement égales.
La tendance de chaque intervalle de temps est calculée de manière totalement indépendante à l’aide du moteur d’indicateurs propre au terminal (gestionnaires iMA et CopyBuffer), de sorte que la ligne M15 correspond exactement à ce qu’afficherait un graphique M15 avec ces deux mêmes moyennes mobiles, la ligne H4 correspond exactement à ce qu’afficherait un graphique H4, et ainsi de suite — il n’y a ni approximation entre périodes ni rééchantillonnage synthétique.
Comment l'interpréter
- HAUSSIER (vert par défaut) — la moyenne mobile rapide est au-dessus de la moyenne mobile lente sur cette période.
- BAISSIER (rouge par défaut) — la moyenne mobile rapide est inférieure à la moyenne mobile lente sur cette période.
- NEUTRE (gris par défaut) — les deux moyennes sont pratiquement égales, ou l’historique de cette échelle de temps n’est pas encore entièrement chargé (affiché comme « N/A » jusqu’à ce qu’il le soit).
- Ordre des lignes — toujours fixe, de la période la plus courte activée à la plus longue (M15 → W1), afin que le panneau s’affiche toujours de la même manière, quelles que soient les périodes activées.
- Valeurs MA facultatives — l’activation de l’ option InpShowMAValues ajoute les valeurs exactes des cours rapide et lent à chaque ligne, pour les cas où vous souhaitez connaître les chiffres correspondant à la couleur.
Variables externes (entrées)
| Entrée | Par défaut | Objectif |
|---|---|---|
| InpShowM15 / InpShowM30 / InpShowH1 / InpShowH4 / InpShowD1 / InpShowW1 | vrai / vrai / vrai / vrai / vrai / faux | Permet de choisir les périodes qui s'affichent sous forme de lignes dans le panneau. |
| InpFastMAPeriod | 10 | Période de la moyenne mobile rapide, calculée séparément pour chaque intervalle de temps activé. |
| InpSlowMAPeriod | 30 | Période de la moyenne mobile lente, calculée séparément sur chaque intervalle de temps activé. |
| InpMAMethod | Simple | Méthode de moyenne mobile (simple, exponentielle, lissée, pondérée linéaire) appliquée à la fois à la moyenne rapide et à la moyenne lente. |
| InpAppliedPrice | Cours de clôture | Série de cours à partir de laquelle les moyennes mobiles sont calculées. |
| InpShowMAValues | false | Lorsque cette option est activée, les valeurs exactes des cours rapides/lents sont ajoutées à chaque ligne. |
| InpUpdateOnNewBarOnly | true | Si la valeur est « true », l'affichage est actualisé à chaque nouvelle barre du graphique ; si la valeur est « false », il est actualisé à chaque tick. |
| InpPanelCorner | Coin supérieur gauche | Coin du graphique auquel le panneau est ancré. |
| InpPanelXDistance / InpPanelYDistance | 12 / 18 | Décalage du panneau par rapport au coin choisi, en pixels. |
| InpFontSize | 9 | Taille de police utilisée pour chaque ligne. |
| InpBullColor / InpBearColor / InpNeutralColor | Vert citron / Rouge / Argent | Couleur des lignes pour chacun des trois états de tendance possibles. |
| InpPanelTextColor / InpPanelBgColor | Blanc / Gris foncé | Couleur du texte du titre et couleur d'arrière-plan du panneau. |
Utilisation recommandée
À associer à n’importe quel graphique d’un symbole donné ; les périodes affichées sont indépendantes de la période du graphique lui-même, car chaque ligne extrait ses propres données directement via les handles iMA() créés pour cette période spécifique. N'utilisez qu'une seule instance par configuration de graphique — il n'y a aucun intérêt à l'associer simultanément à plusieurs graphiques d'un même symbole, car chaque instance afficherait des lignes identiques.
Un croisement de moyennes mobiles rapides/lentes est, par nature, un filtre de tendance à retard ; considérez donc les indications « Haussière » / « Baissière » comme une lecture de tendance plutôt que comme un signal d’entrée en soi ; cela répond à la question « dans quelle direction cette période s’oriente-t-elle ? » plutôt qu’à « négociez maintenant ». Pour les symboles dont l’historique de cotation est très court (un instrument nouvellement coté ou un courtier ne disposant que d’un nombre limité de barres hebdomadaires/mensuelles), les lignes correspondant aux périodes plus longues peuvent afficher « N/A » jusqu’à ce qu’un nombre suffisant de barres ait été chargé — ce phénomène est normal et se résout automatiquement. Cet indicateur se contente de lire les données de cours et ne passe, ne modifie ni ne clôture jamais aucun ordre ; il peut donc être utilisé en toute sécurité sur n’importe quel type de compte.
Chaque descripteur d’indicateur créé dans OnInit() est libéré via IndicatorRelease() dans OnDeinit(), et tous les objets du graphique sont supprimés via ObjectsDeleteAll() en même temps ; ainsi, la désactivation de l’indicateur ne laisse aucune trace.
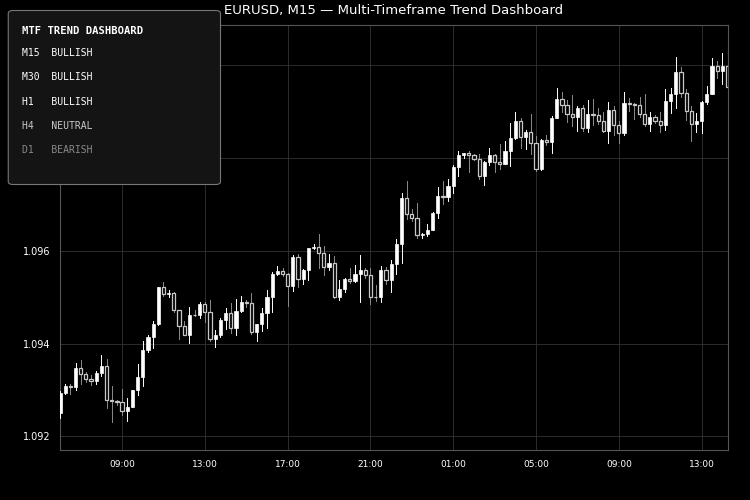
Fig. 1. Le tableau de bord des tendances sur l’EURUSD M15, affichant les périodes de M15 à D1, chacune évaluée indépendamment. Rendu en noir et blanc conformément aux directives visuelles de Code Base (750 × 500 px).
Traduit de l’anglais par MetaQuotes Ltd.
Code original : https://www.mql5.com/en/code/76438
Hurst Exponent Regime Switch Indicator
Estime l'exposant de Hurst glissant du cours à l'aide de l'analyse de la fourchette redimensionnée (R/S) et le représente sous la forme d'un oscillateur à code couleur qui indique si le marché suit actuellement une tendance, revient à la moyenne ou évolue selon un mouvement aléatoire.
Spread Monitor for Scalpers
Spread histogram in a sub-window with current/avg/max/min stats, cost per trade, and threshold alerts for scalpers.
 AAPL cfd - ORB strategy
Utilisation de la stratégie ORB sur le CFD AAPL
Liquidity Void Decay Oscillator.
Un oscillateur de sous-fenêtre qui signale les barres de déplacement à faible participation comme des « vides de liquidité » et attribue une note comprise entre 0 et 100 en fonction de la rapidité avec laquelle le cours comble chacune d'entre elles, permettant ainsi de distinguer le bruit rapidement absorbé des niveaux qui continuent de jouer un rôle de véritable support ou de résistance.