 MetaTrader 5
 Experts
 지표
지표
 스크립트
스크립트
 라이브러리
라이브러리
 보관함
보관함
당사 팬 페이지에 가입하십시오

Multi Timeframe Trend Dashboard Indicator - MetaTrader 5용 지표

- 조회수:
- 8
- 평가:
- 게시됨:
-
 이 코드를 기반으로 한 로봇이나 지표가 필요하신가요? 프리랜스로 주문하세요
프리랜스로 이동
이 코드를 기반으로 한 로봇이나 지표가 필요하신가요? 프리랜스로 주문하세요
프리랜스로 이동


다중 시간대 추세 대시보드
이 지표의 개발 배경
고시간대 추세를 활용한 거래는 대개 단 하나의 질문, 즉 ‘이 종목이 실제로 추세를 보이고 있는지, 그리고 해당 설정에 중요한 시간대 전반에서 어떤 방향으로 추세를 보이고 있는지’를 확인하기 위해 여러 차트 창 사이를 계속 전환해야 하는 번거로움을 수반합니다. 이 지표는 한눈에 그 답을 알려줍니다. 사용자가 활성화한 모든 시간대(M15부터 W1까지)에 대해, 해당 시간대별로 독립적인 고속/저속 이동평균 쌍을 생성하고, 최신 값을 읽어온 후, 그 결과를 단일 색상 코드 행으로 표시합니다: 빠른 이동평균이 느린 이동평균보다 높으면 강세, 낮으면 약세, 사실상 같으면 중립입니다.
각 시간대의 추세는 터미널 자체의 지표 엔진(iMA 핸들 및 CopyBuffer)을 사용하여 완전히 독립적으로 계산되므로, 따라서 M15 행은 동일한 두 이동평균선이 적용된 M15 차트에서 보여줄 것과 정확히 일치하며, H4 행은 H4 차트에서 보여줄 것과 정확히 일치하는 식입니다. 시간대 간 근사치 산출이나 합성 재샘플링은 전혀 포함되지 않습니다.
해석 방법
- 강세 (기본값: 녹색) — 해당 시간대에서 빠른 이동평균이 느린 이동평균보다 위에 있습니다.
- 약세 (기본값: 빨간색) — 해당 시간대에서 빠른 이동평균이 느린 이동평균보다 아래에 있습니다.
- 중립 (기본값: 회색) — 두 이동평균이 사실상 같거나, 해당 시간대의 과거 데이터가 아직 완전히 로드되지 않은 경우입니다(완전히 로드될 때까지 “N/A”로 표시됨).
- 행 순서 — 항상 활성화된 가장 낮은 시간대부터 가장 높은 시간대(M15 → W1) 순으로 고정되어 있으므로, 어떤 시간대가 활성화되어 있든 패널은 매번 동일한 방식으로 표시됩니다.
- 선택적 MA 값 — InpShowMAValues를 활성화하면 색상 뒤에 숨겨진 수치를 확인하고 싶을 때를 대비하여 각 행에 정확한 빠른/느린 가격 값이 추가됩니다.
외부 변수(입력값)
| 입력 | 기본값 | 용도 |
|---|---|---|
| InpShowM15 / InpShowM30 / InpShowH1 / InpShowH4 / InpShowD1 / InpShowW1 | true / true / true / true / true / false | 패널에 행으로 표시될 시간대를 전환합니다. |
| InpFastMAPeriod | 10 | 활성화된 모든 시간대별로 별도로 계산되는 빠른 이동 평균의 기간입니다. |
| InpSlowMAPeriod | 30 | 슬로우 이동평균의 기간으로, 활성화된 각 타임프레임에서 별도로 계산됩니다. |
| InpMAMethod | 단순 | 빠른 이동평균과 느린 이동평균 모두에 적용되는 이동평균 방법(단순, 지수, 평활화, 선형 가중). |
| InpAppliedPrice | 종가 | 이동평균을 계산하는 데 사용되는 가격 시계열. |
| InpShowMAValues | false | 이 기능을 활성화하면 각 행에 정확한 빠른/느린 가격 값이 추가됩니다. |
| InpUpdateOnNewBarOnly | true | true인 경우, 새로운 차트 막대가 나타날 때마다 한 번씩 새로 고침되며, false인 경우 매 틱마다 새로 고침됩니다. |
| InpPanelCorner | 왼쪽 상단 | 패널이 고정되는 차트의 모서리입니다. |
| InpPanelXDistance / InpPanelYDistance | 12 / 18 | 선택한 모서리로부터 패널이 오프셋된 거리(픽셀 단위). |
| InpFontSize | 9 | 모든 행에 사용되는 글꼴 크기. |
| InpBullColor / InpBearColor / InpNeutralColor | 라임 / 빨강 / 은색 | 세 가지 가능한 추세 상태 각각에 대한 행 색상. |
| InpPanelTextColor / InpPanelBgColor | 흰색 / 짙은 회색 | 제목 텍스트 색상과 패널 배경색. |
권장 사용법
어떤 심볼의 차트 하나에나 첨부할 수 있습니다. 각 행은 해당 특정 시간대를 위해 생성된 iMA() 핸들을 통해 직접 데이터를 가져오기 때문에, 표시되는 시간대는 차트 자체의 기간과 무관합니다. 차트 레이아웃당 하나의 인스턴스만 실행하십시오. 모든 인스턴스가 동일한 행을 표시하므로, 동일한 종목의 여러 차트에 한 번에 첨부하는 것은 아무런 이점이 없습니다.
패스트/슬로우 이동평균(MA) 크로스(교차)는 본질적으로 후행성 추세 필터이므로, “강세”/“약세”를 그 자체로 진입 신호라기보다는 시장 국면을 파악하는 지표로 간주하십시오. 이는 “지금 거래하라”는 신호라기보다는 “이 시간대가 어느 방향으로 기울고 있는가”에 대한 답을 제공합니다. 거래 이력이 매우 짧은 종목(신규 상장 종목이나 주간/월간 막대가 제한된 브로커의 경우)에서는 충분한 막대가 로드될 때까지 상위 시간대의 행에 “N/A”가 표시될 수 있습니다. 이는 정상적인 현상이며 자동으로 해결됩니다. 이 지표는 가격 데이터만 읽을 뿐 주문을 체결, 수정 또는 청산하지 않으므로 어떤 계좌 유형에서든 안전하게 실행할 수 있습니다.
OnInit()에서 생성된 모든 지표 핸들은 OnDeinit()의 IndicatorRelease()를 통해 해제되며, 모든 차트 객체는 동시에 ObjectsDeleteAll()을 통해 제거되므로, 지표를 분리해도 아무것도 남지 않습니다.
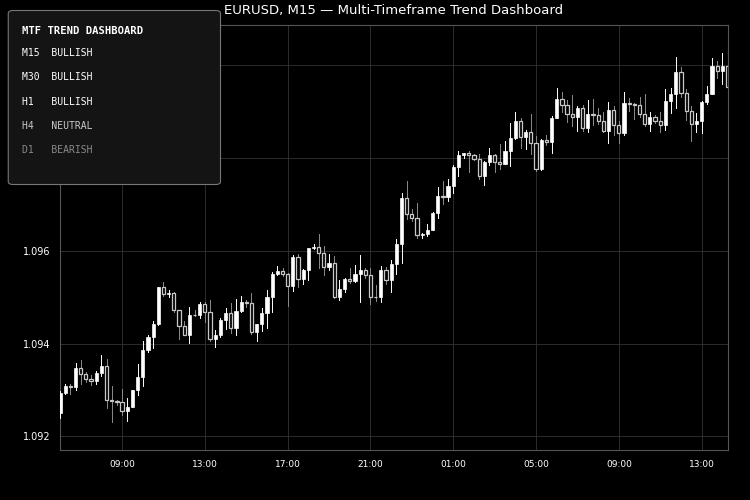
그림 1. EURUSD M15 차트의 추세 대시보드. M15부터 D1까지 각 시간대가 독립적으로 평가된 모습을 보여줍니다. 코드베이스 이미지 가이드라인(750×500 픽셀)에 따라 흑백으로 렌더링되었습니다.
MetaQuotes Ltd에서 영어로 번역함.
원본 코드: https://www.mql5.com/en/code/76438
Hurst Exponent Regime Switch Indicator
재조정 범위(R/S) 분석을 통해 가격의 이동 허스트 지수를 추정하고, 이를 색상으로 구분된 오실레이터로 표시하여 시장이 현재 추세장인지, 평균 회귀 국면인지, 아니면 랜덤 워크처럼 움직이고 있는지 여부를 알려줍니다.
Spread Monitor for Scalpers
Spread histogram in a sub-window with current/avg/max/min stats, cost per trade, and threshold alerts for scalpers.
 AAPL cfd - ORB strategy
AAPL CFD에 ORB 전략 적용하기
Liquidity Void Decay Oscillator.
거래량이 적은 변동 막대를 “유동성 공백”으로 표시하고, 각 막대가 얼마나 빨리 가격으로 채워지는지에 따라 0~100점의 점수를 매기는 서브윈도우 오실레이터로, 빠르게 흡수되는 잡음과 여전히 실질적인 지지선 또는 저항선 역할을 하는 수준을 구분해 줍니다.