Ivan Stefanov
Ivan Stefanov
4.7 (51)
  • Información
8+ años
experiencia
27
productos
68
versiones demo
0
trabajos
0
señales
0
suscriptores
Ivan Stefanov Ha publicado el producto

Oscilador de momentum avanzado que ajusta automáticamente su período según la volatilidad del mercado para ofrecer señales de sobrecompra y sobreventa más precisas. Cómo funciona El indicador utiliza un cálculo de período adaptativo que se acorta durante alta volatilidad y se alarga durante baja volatilidad. Este ajuste dinámico proporciona señales más rápidas cuando el mercado está en tendencia y reduce las señales falsas en condiciones laterales. El valor del RSI se calcula en función de este

Ivan Stefanov
Ivan Stefanov
Enigmera in action, EUR/USD 1h
Ivan Stefanov
Ivan Stefanov
The new Speculator with divided volume profile to bulls and bears
Ivan Stefanov
Ivan Stefanov
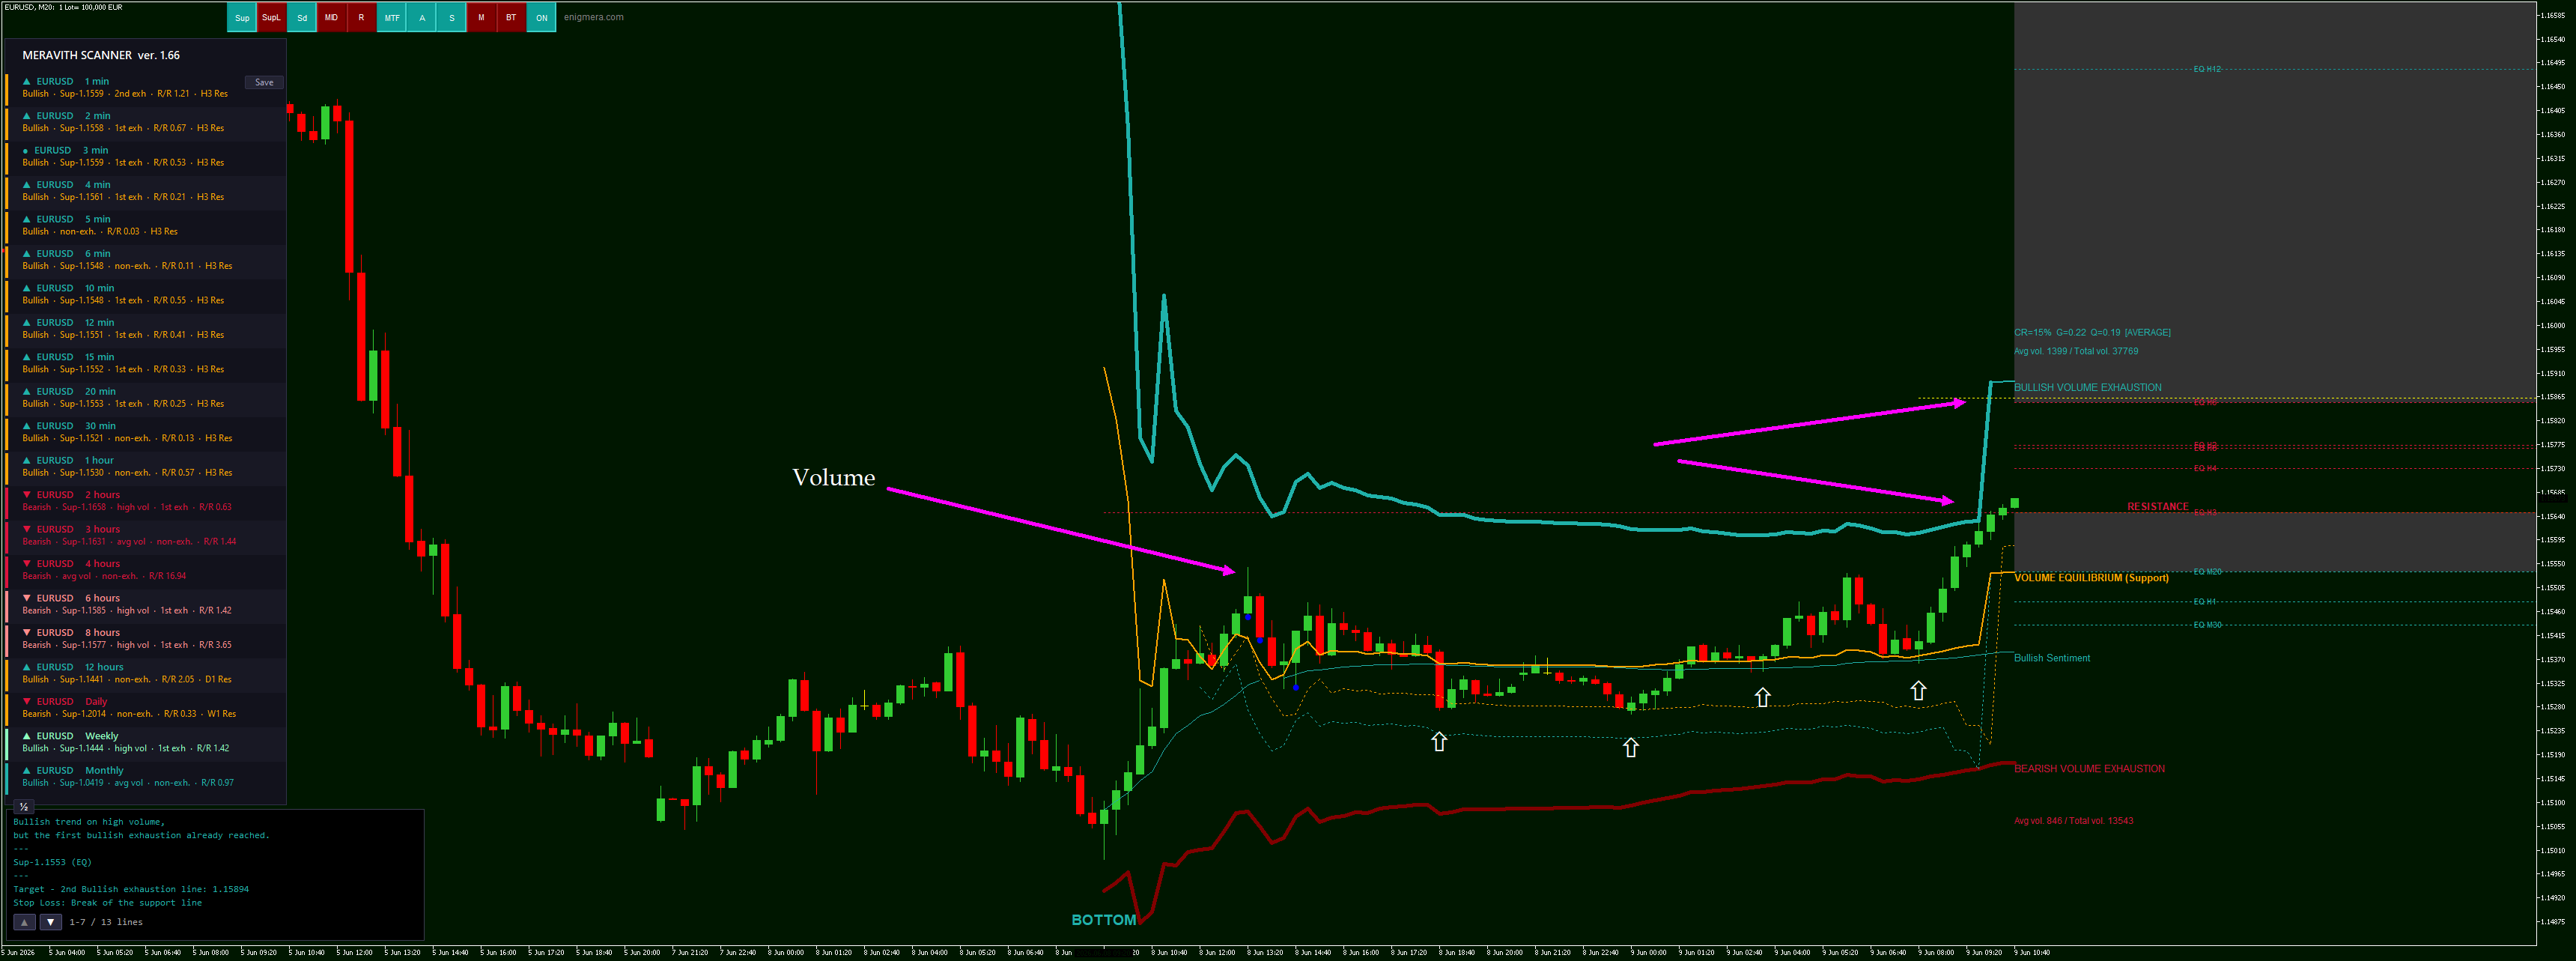
Please note that with Meravith, you can measure not only from a top or bottom, but from any point you consider important. Also observe how the new volume affects the distance indicated by the arrows.
Ivan Stefanov
Ivan Stefanov
Need a target for your trade?
Ivan Stefanov
Ivan Stefanov
Meravith trading example
Ivan Stefanov Ha publicado el producto
Comentarios: 2
400.00 USD

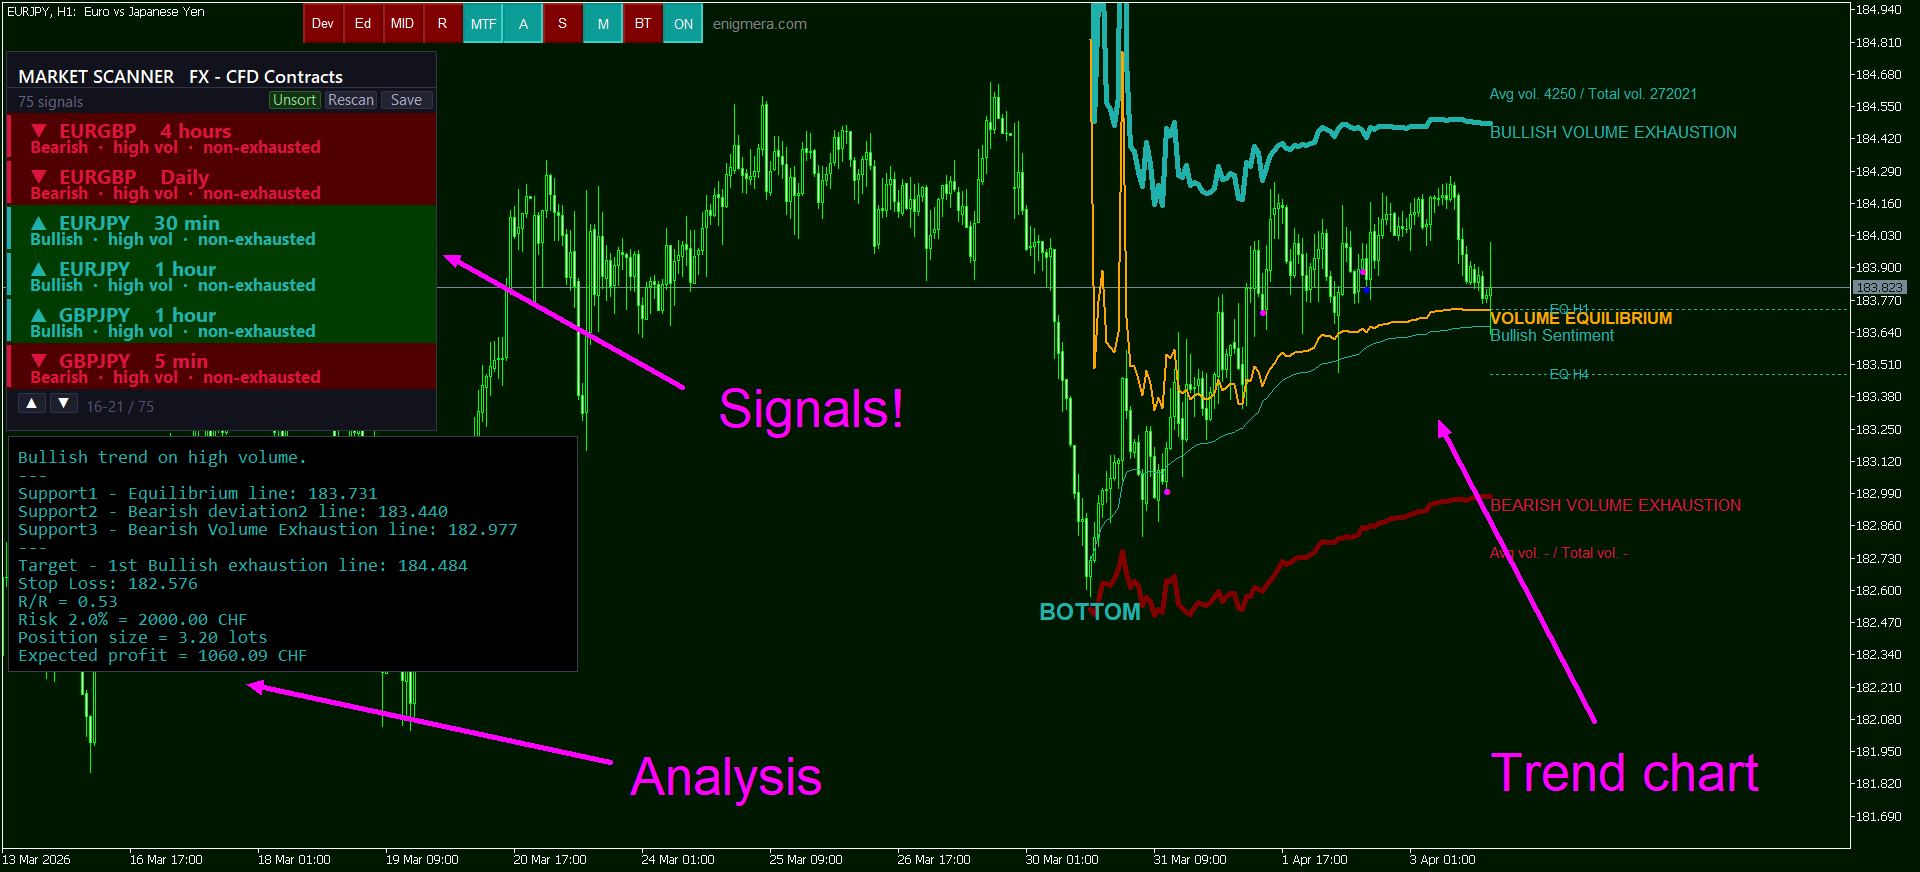
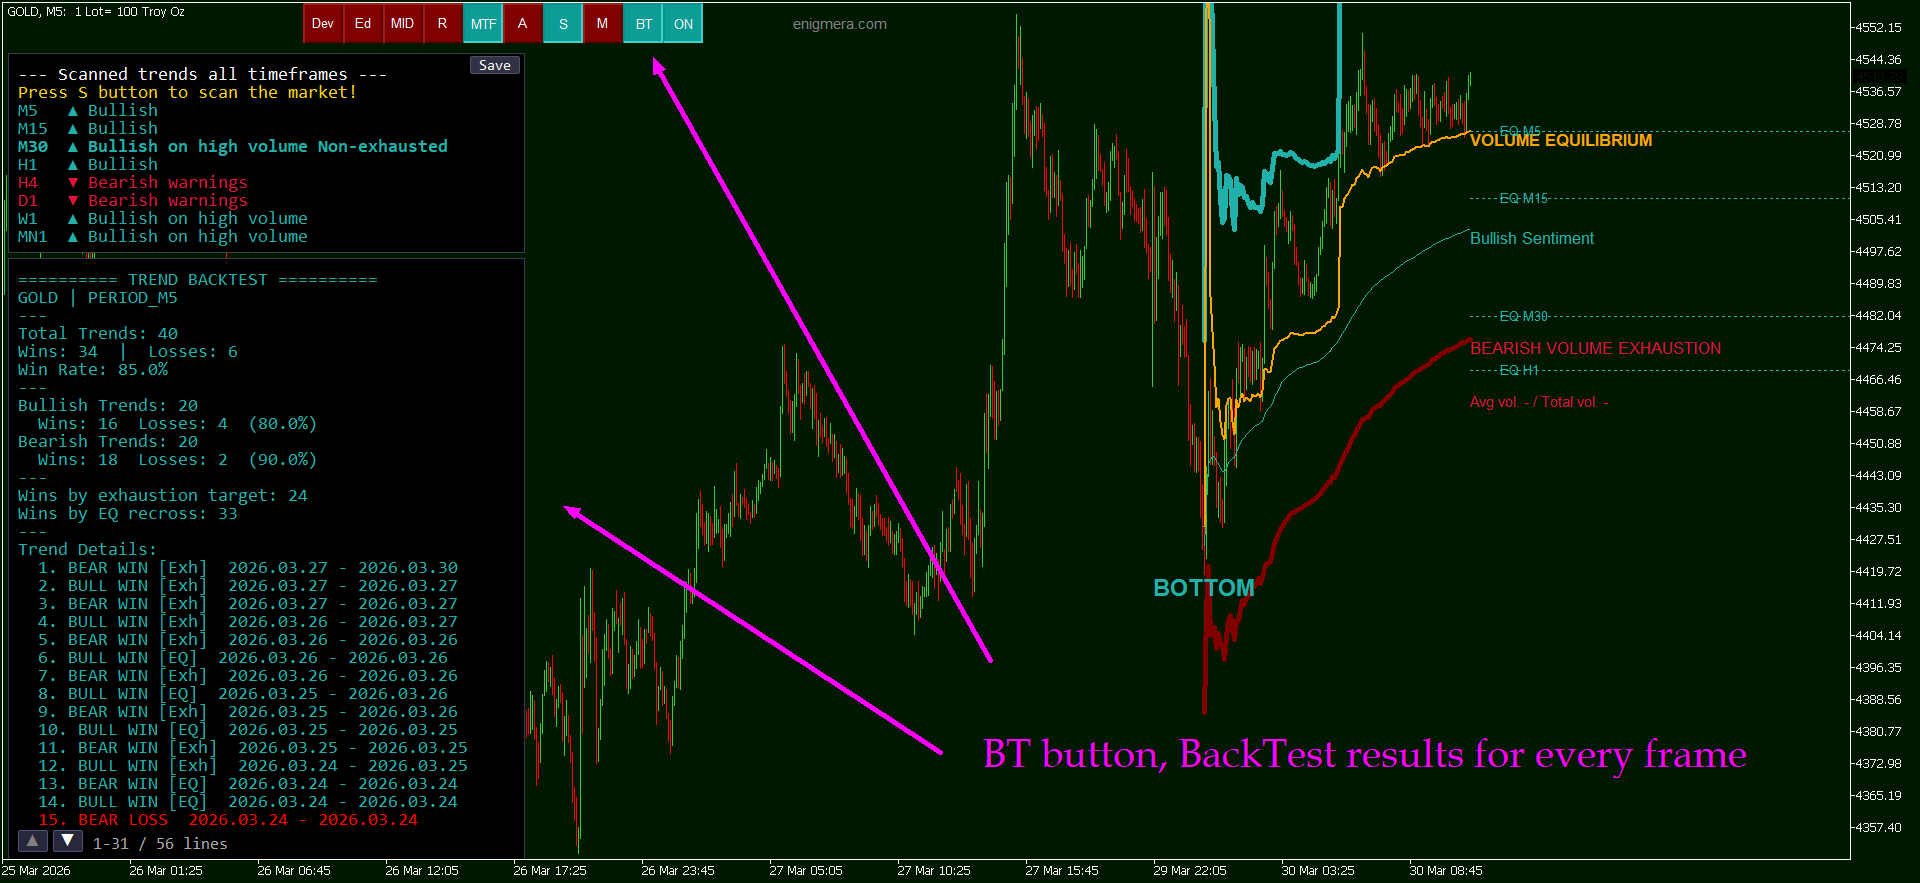
Herramienta de los market makers. Meravith: Analizará todos los marcos temporales y mostrará la tendencia actual en vigor. Destacará las zonas de liquidez (equilibrio de volumen) donde el volumen alcista y bajista es igual. Mostrará todos los niveles de liquidez de diferentes marcos temporales directamente en su gráfico. Generará y presentará análisis de mercado en formato de texto para su referencia. Calculará objetivos, niveles de soporte y puntos de stop-loss según la tendencia actual

Ivan Stefanov
Ivan Stefanov
The new Speculator version. Volume profile included as an option.

Mode 1 - the profile is calculating from the initial point of the indicator to the most current candle.
Mode 2 - the profile is calculating from top to bottom (or viceversa)
Ivan Stefanov
Ivan Stefanov
The new Meravith MT5
under way...
Wan Suryolaksono
Wan Suryolaksono 2025.08.13
It seems similar with enigmera. I hope the price can be much cheaper
Ivan Stefanov
Ivan Stefanov
Very good tricky example of this morning.
In Elliott Wave Theory, a triangle forms in wave 4 or B — never in wave 2.
It’s a pattern that confirms the trend.

Let’s look at the example above.
This is indeed a triangle, and it has broken to the upside, which means that when you see it, you should start buying immediately.
However, there’s a nuance here — volume. You can’t see the volume, and that makes it hard to know whether this triangle will actually break and only then produce a move either up or down.

This is where Transaction Speed can help determine direction.
Notice how the entire triangle is located within the accumulation zone — not just a part of it.
If volume were accumulating only in the area near the bottom of the supposed wave 4, then there would be no problem with buying. But in this case, the triangle has absolutely no significance, because it’s not the one defining the levels.

In such a scenario, the triangle can be easily invalidated and is not a reliable pattern.
Keep in mind that, very often at the end of many trends, similar situations form that look like triangles but aren’t — and when everyone expects continuation, the price makes a sharp reversal.
Actually the market will respect not the triangle, but the Transaction Speed levels i.e. the accumulated volume.