Lihong Guo / Perfil

Trend Support and Resistance Chart is a technical analysis chart, showing moving trend and reversal, support lines and resistance lines.
The Chart is easy to interpret:
1. When candle is Green, shows bullish movement, when it is Red, shows bearish movement.
2. when candle color changes, shows the trend might reverse, a reversal might happen.
3. If three or more candles form a flat bottom (or top) and candle color changes, it is a buy (or sell) signal.
4. If two candles form a flat bottom (or top) and candle color changes, it is a buy alert (or sell alert) signal.
5. Chart shows support lines and resistance lines.
6. Sound, Pop-up message, Push notification and Mail alerts after signal is confirmed. All alerts are set to OFF by default. (some alerts need to change settings in: Tools/Options)
# NO REPAINT #
no future data is used for calculation, so when one candle is finished, it will not change forever.
# NO FUTURE DATA #
Support and resistance lines are not based on zigzag calculation, no future data is used, it will not repaint.
This indicator is plotted in chart window.
https://www.mql5.com/en/market/product/34567#!tab=tab_p_overview


Trend Support and Resistance Chart is a technical analysis chart, showing moving trend and reversal, support lines and resistance lines.
The Chart is easy to interpret:
1. When candle is Green, shows bullish movement, when it is Red, shows bearish movement.
2. when candle color changes, shows the trend might reverse, a reversal might happen.
3. If three or more candles form a flat bottom (or top) and candle color changes, it is a buy (or sell) signal.
4. If two candles form a flat bottom (or top) and candle color changes, it is a buy alert (or sell alert) signal.
5. Chart shows support lines and resistance lines.
6. Sound, Pop-up message, Push notification and Mail alerts after signal is confirmed. All alerts are set to OFF by default. (some alerts need to change settings in: Tools/Options)
# NO REPAINT #
no future data is used for calculation, so when one candle is finished, it will not change forever.
# NO FUTURE DATA #
Support and resistance lines are not based on zigzag calculation, no future data is used, it will not repaint.
This indicator is plotted in chart window.
https://www.mql5.com/en/market/product/34567


Trend Reversal Chart (TR Chart) is a technical analysis chart, showing moving trend reversal and bullish, bearish trends by comparing stock momentum.
Trend Reversal Chart is easy to interpret:
1. When candle is Green, shows bullish movement, when it is Red, shows bearish movement.
2. when candle color changes, shows the trend might reverse.
3. If three or more candles form a flat bottom (or top) and candle color changes, it is a buy (or sell) signal.
3. If two candles form a flat bottom (or top) and candle color changes, it is a buy alert (or sell alert) signal.
This indocator is plotted in chart window.
https://www.mql5.com/en/market/product/34216


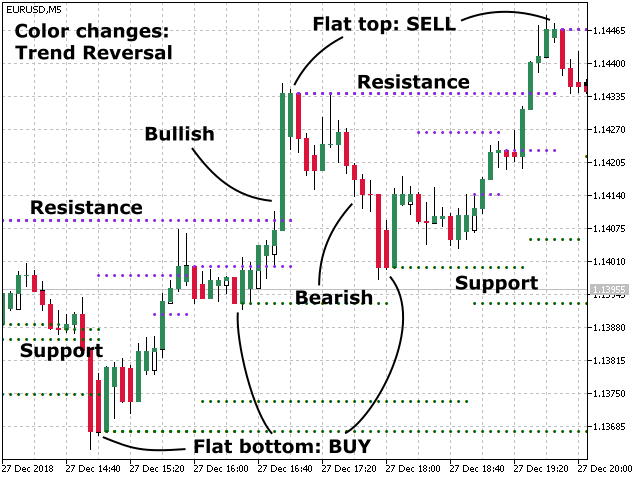
2. Is there the indicator (Trend Reversal Chart (TR Chart) for MT5?

Trend Reversal Chart (TR Chart) is a technical analysis chart, showing moving trend reversal and bullish, bearish trends by comparing stock momentum.
Trend Reversal Chart is easy to interpret:
1. When candle is Green, shows bullish movement, when it is Red, shows bearish movement.
2. when candle color changes, shows the trend might reverse.
3. If three or more candles form a flat bottom (or top) and candle color changes, it is a buy (or sell) signal.
3. If two candles form a flat bottom (or top) and candle color changes, it is a buy alert (or sell alert) signal.
This indocator is plotted in chart window.
https://www.mql5.com/en/market/product/34216


Buy Sell Strength (BSS) is a technical analysis oscillator, showing bullish (buy) and bearish (sell) strength by comparing upward and downward stock momentum movements.
The BSS is easy to interpret:
1. When BBS Histogram is Green, it is bullish, when it is Red, it is bearish.
2. BSS is considered overbought when it is closer to Top Line and oversold when it is closer to Bottom Line.
3. When it shows Buy signal near the Bottom line, it is a more reliable signal.
4. Sound, Pop-up message, Push notification and Mail alerts after signal is confirmed. All alerts are set to OFF by default. (some alerts need to change settings in: Tools/Options)
https://www.mql5.com/en/market/product/33921#


Trend Pulse (MT5) is a forex or stock technical analysis indicator, it shows prices Trend, Oscillator and Momentum. The chart shows bullish (buy) or bearish (sell) Trend Strength.
The Trend Pulse is easy to interpret:
1. When Trend Pulse candle is Green, it is bullish, when it is Red, it is bearish.
2. When Trend Pulse candle color changes, it shows the trend changes. It is a Buy or Sell signal.
https://www.mql5.com/en/market/product/37033

Trend Pulse (MT5) is a forex or stock technical analysis indicator, it shows prices Trend, Oscillator and Momentum. The chart shows bullish (buy) or bearish (sell) Trend Strength. The Trend Pulse is easy to interpret: 1. When Trend Pulse candle is Green, it is bullish, when it is Red, it is bearish. 2. When Trend Pulse candle color changes, it shows the trend changes. It is a Buy or Sell signal. # No Repaint # No Future Data is used for calculation
Trend Pulse (For MT4) is a forex or stock technical analysis indicator, it shows prices Trend, Oscillator and Momentum. The chart shows bullish (buy) or bearish (sell) Trend Pulse. The Trend Pulse is easy to interpret: 1. When Trend Pulse Histogram is above zero (Green), it is bullish, when it is below zero (Red), it is bearish. 2. When Trend Pulse Histogram crosses zero, color changes, it shows the trend changes. It is a Buy or Sell signal. # No Repaint # No Future Data is used for calculation

Momentum Signal (MS) (For MT5) is a forex or stock technical analysis indicator, it shows price Momentum, Oscillator and Trend. The chart shows bullish (buy) or bearish (sell) momentum strengths.
The Momentum Signal (MS) is easy to interpret:
1. When Momentum Signal (MS) Histogram is above zero (Green), it is bullish, when it is below zero (Red), it is bearish.
2. When the Histogram crosses zero, color changes, it shows the trend changes. It is Buy or Sell signal.
3. Sound, Pop-up message, Push notification and Mail alerts after signal is confirmed. All alerts are set to OFF by default. (some alerts need to change settings in: Tools/Options)
https://www.mql5.com/en/market/product/36872

Momentum Signal (MS) (For MT5) is a forex or stock technical analysis indicator, it shows price Momentum, Oscillator and Trend. The chart shows bullish (buy) or bearish (sell) momentum strengths. The Momentum Signal (MS) is easy to interpret: 1. When Momentum Signal (MS) Histogram is above zero (Green), it is bullish, when it is below zero (Red), it is bearish. 2. When the Histogram crosses zero, color changes, it shows the trend changes. It is Buy or Sell signal. 3. Sound, Pop-up message, Push

The BSS is easy to interpret:
1. When BBS Histogram is Green, it is bullish, when it is Red, it is bearish.
2. BSS is considered overbought when it is closer to Top Line and oversold when it is closer to Bottom Line.
3. When it shows Buy signal near the Bottom line, it is a more reliable signal.
4. Sound, Pop-up message, Push notification and Mail alerts after signal is confirmed. All alerts are set to OFF by default. (some alerts need to change settings in: Tools/Options)

Momentum Signal (MS) (For MT4) is a forex or stock technical analysis indicator, it shows prices Momentum, Oscillator and Trend. The chart shows bullish (buy) or bearish (sell) momentum strengths. The Momentum Signal (MS) is easy to interpret: 1. When Momentum Signal (MS) Histogram is above zero (Green), it is bullish, when it is below zero (Red), it is bearish. 2. When the Histogram crosses zero, color changes, it shows the trend changes. It is Buy or Sell signal. # No Repaint # No Future Data
Bullish or Bearish (BoB) is a technical analysis indicator, showing moving trend and reversal, Celling line and Floor line. The indicator is easy to interpret: 1. When the BoB line is moving upward, shows bullish movement. when it is moving downward, shows bearish movement. 2. when BoB Line up crossover Signal Line, shows the upward trend is confirmed. when BoB Line down crossover Signal line, shows the downward trend is confirmed. 3. If BoB Line crossover Signal Line near the Floor line
Bull or Bear (BoB) is a technical analysis indicator, showing moving trend and reversal, Celling line and Floor line. The indicator is easy to interpret: 1. When the BoB line is moving upward, shows bullish movement. when it is moving downward, shows bearish movement. 2. when BoB Line up crossover Signal Line, shows the upward trend is confirmed. when BoB Line down crossover Signal line, shows the downward trend is confirmed. 3. If BoB Line crossover Signal Line near the Floor line or
Heikin-Ashi Stochastic is a technical indicator, combined Heikin-Ashi and Stochastic calculations, to show price moving trend and reversal. The Heikin-Ashi technique – meaning "average bar" – can be used to spot trends and to predict future prices. Heikin-Ashi Candlesticks are based on price data from the current open-high-low-close, the current Heikin-Ashi values, and the prior Heikin-Ashi values. The stochastic oscillator is a momentum indicator used in technical analysis, to compare the
Heikin-Ashi RSI is a technical indicator, combined Heikin-Ashi and RSI calculations, to show price moving trend and reversal. The Heikin-Ashi technique – meaning "average bar" – can be used to spot trends and to predict future prices. Heikin-Ashi Candlesticks are based on price data from the current open-high-low-close, the current Heikin-Ashi values, and the prior Heikin-Ashi values. The relative strength index (RSI) is a technical indicator used in the analysis of financial markets. It is

Heikin-Ashi RSI is a technical indicator, combined Heikin-Ashi and RSI calculations, to show price moving trend and reversal. The Heikin-Ashi technique – meaning "average bar" – can be used to spot trends and to predict future prices. Heikin-Ashi Candlesticks are based on price data from the current open-high-low-close, the current Heikin-Ashi values, and the prior Heikin-Ashi values. The relative strength index (RSI) is a technical indicator used in the analysis of financial markets. It is
Trend Support and Resistance Chart is a technical analysis chart, showing moving trend and reversal, support lines and resistance lines. The Chart is easy to interpret: 1. When candle is Green, shows bullish movement, when it is Red, shows bearish movement. 2. when candle color changes, shows the trend might reverse, a reversal might happen. 3. If three or more candles form a flat bottom (or top) and candle color changes, it is a buy (or sell) signal. 4. If two candles form a flat bottom (or

Trend Reversal (TR) is a technical analysis indicator, showing moving trend reversal and bullish, bearish signals by comparing stock momentum.
The Trend Reversal is easy to interpret:
1. When candle is Green, shows bullish, when it is Red, shows bearish.
2. when candle changes to Blue, shows the trend might reverse, a buy or sell signal might appear.
3. When bullish or bearish is confirmed, a Buy or Sell signal is given.
4. Sound, Pop-up message, Push notification and email alerts after signal is confirmed. (some alerts need to change settings in: Tools/Options)
This indicator is plotted in separate window.
https://www.mql5.com/en/market/product/34189#

Trend Reversal Chart (TR Chart) is a technical analysis chart, showing moving trend reversal and bullish, bearish trends by comparing stock momentum. Trend Reversal Chart is easy to interpret: 1. When candle is Green, shows bullish movement, when it is Red, shows bearish movement. 2. when candle color changes, shows the trend might reverse. 3. If three or more candles form a flat bottom (or top) and candle color changes, it is a buy (or sell) signal. 3. If two candles form a flat bottom (or top)