|
2 años
experiencia
|
8
productos
|
0
versiones demo
|
|
0
trabajos
|
0
señales
|
0
suscriptores
|
Trading Tool Developer
en
HIZOA Product Line
HIZOA — Structure Beyond the Visible
Welcome to HIZOA.
HIZOA is focused on the development of analytical tools for traders who want to look beyond price alone.
Financial markets contain layers of information that are not always immediately visible on a standard chart. Market structure, volume behaviour, directional flow, momentum, support and resistance, changing volatility and market activity can all provide additional perspectives on what is happening beneath the surface.
Our goal is to develop tools that make this information clearer, structured and practical to observe.
WHY HIZOA?
The name HIZOA is inspired by astronomy and the HI Zone of Avoidance (HIZOA) surveys.
Large areas of the universe are difficult to observe because gas, dust and stars within our own Milky Way obscure what lies beyond. By using different observational techniques, astronomers can nevertheless detect and study structures and galaxies hidden from ordinary view.
That concept immediately connected with the philosophy behind our tools.
STRUCTURE BEYOND THE VISIBLE
Markets contain considerably more information than price alone can immediately show.
Different forms of analysis can reveal additional structure in volume, momentum, directional behaviour, volatility, market activity and the interaction between price levels.
HIZOA is not about predicting the future.
Our tools are not designed to tell traders what they must buy or sell, nor do we believe an indicator should pretend to know what the market will do next.
Instead, we focus on observation, visualization and structure.
Observe the information.
Understand the structure.
Make your own decision.
That principle remains at the core of everything we build.
The trader always remains in control.
DEVELOPMENT THROUGH RESEARCH
As HIZOA has developed, our approach to testing has evolved as well.
Visual chart testing remains important, but we wanted the ability to investigate indicator behaviour much deeper and on a considerably larger scale.
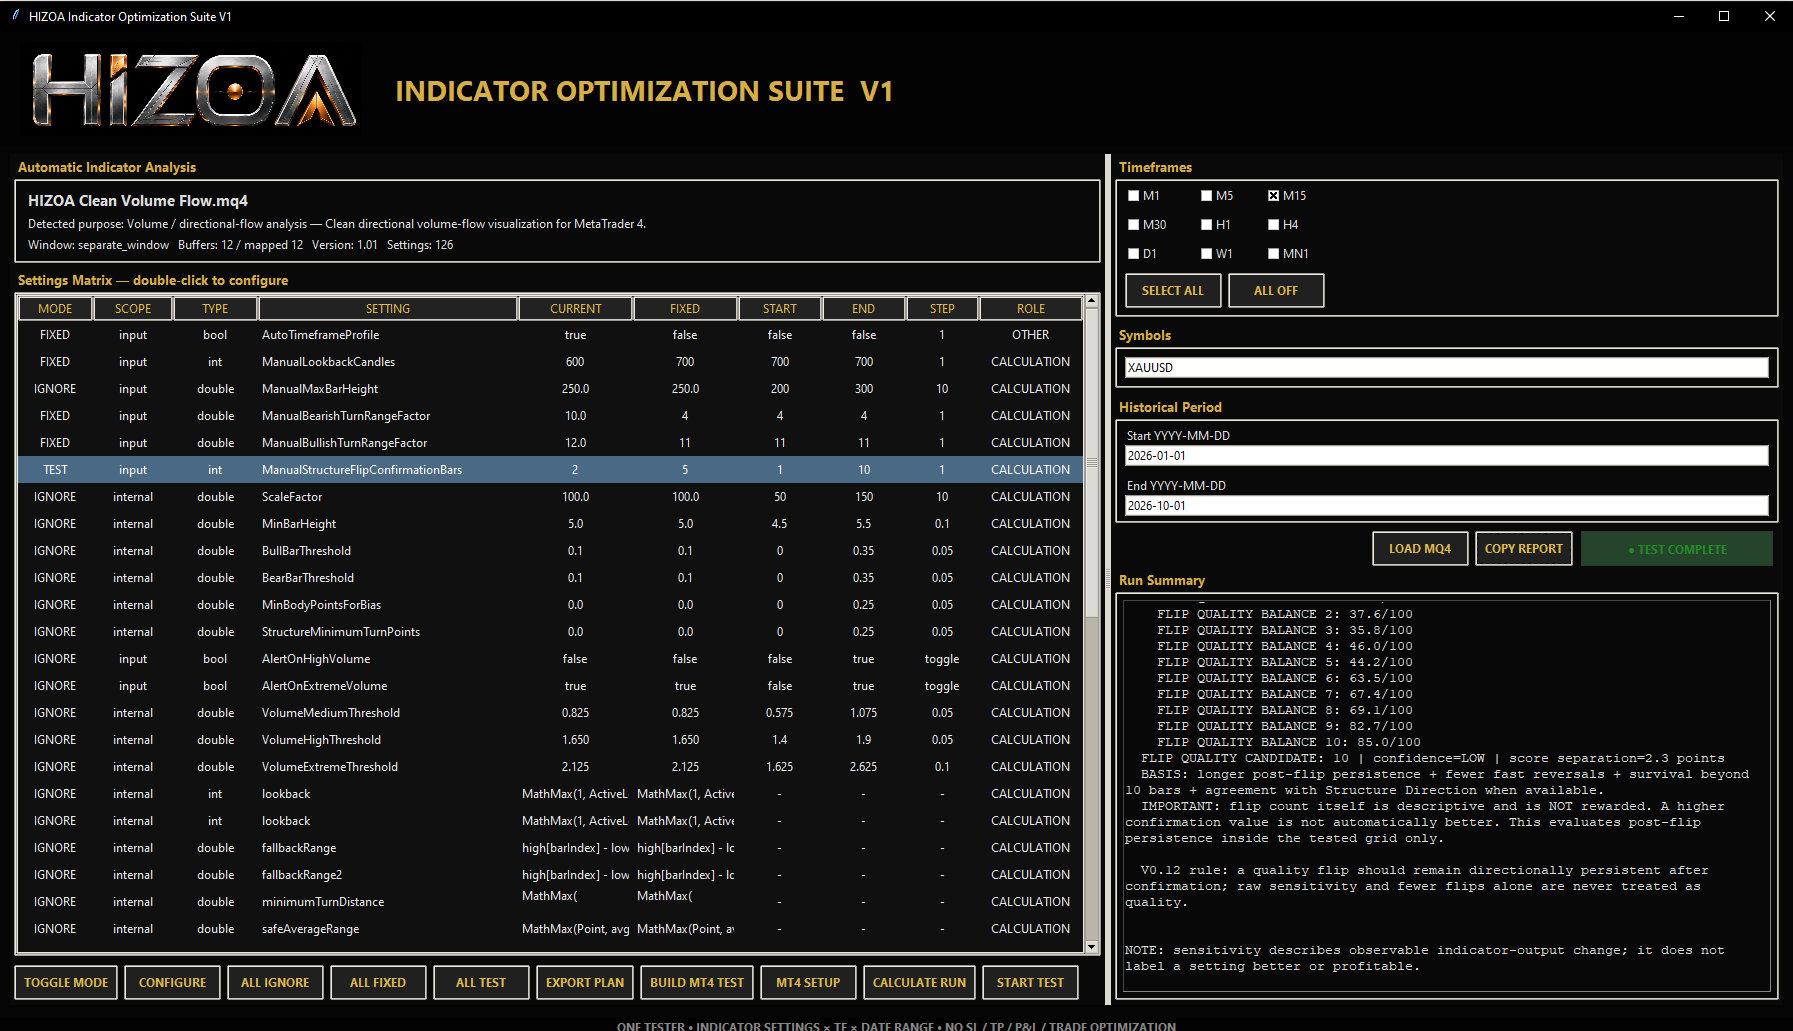
For this reason, we developed our own HIZOA Indicator Optimization Suite.
This internal research environment allows us to systematically examine how an indicator behaves across different parameter values, instruments, timeframes and historical periods.
Although the Suite itself is still under active development and testing, it has already made a significant difference in the way we can research our tools.
Instead of manually changing individual settings and evaluating a limited number of charts, we can perform thousands of targeted tests on calculation settings in a relatively short period of time.
The resulting indicator output can then be analyzed to understand what actually changes when a parameter is adjusted.
This allows us to investigate areas such as:
• Structural and directional persistence
• Confirmation behaviour
• Reversals and changing market conditions
• Parameter sensitivity and interaction
• Differences between instruments
• Differences between timeframes
• Stability across different historical periods
• Whether additional filtering genuinely improves an indicator's behaviour or simply introduces additional delay
This creates a much deeper testing process than visual observation alone.
Importantly, the HIZOA Indicator Optimization Suite is not a trading-strategy or profitability optimizer.
It does not use profit/loss, entries, exits, stop losses, take profits, lot sizes or drawdown to determine whether an indicator setting is better.
Its purpose is to understand the indicator itself and evaluate the behaviour of its calculated output.
The knowledge gained from this research can contribute to better calibrated settings, improved automatic profiles and more thoroughly tested future upgrades across HIZOA tools.
The HIZOA Indicator Optimization Suite is currently an internal development tool and is not intended for sale.
As the project continues to mature, however, we may reconsider this in the future.
STRATEGY RESEARCH — A SEPARATE DEVELOPMENT PATH
Alongside our indicator research, we are also working on another testing environment with a fundamentally different purpose.
Where the Indicator Optimization Suite focuses entirely on understanding and improving individual analytical tools, this separate project focuses on trading-strategy research.
The objective is to investigate how different HIZOA tools may work together when combined within complete trading concepts.
This environment is being developed to examine elements such as:
• Combinations of analytical tools
• Entry conditions
• Stop-loss placement
• Take-profit methods
• Trade management
• Drawdown
• Other strategy-related variables
Keeping these two research environments separate is important.
An indicator can be evaluated on whether it performs its intended analytical function consistently without making assumptions about profitability.
Strategy research asks an entirely different question: what happens when analytical information is combined with actual trading rules?
By separating those two areas, we can research both without confusing indicator quality with trading performance.
THE HIZOA ECOSYSTEM
HIZOA is not built around a single indicator or one specific method of market analysis.
It is a growing collection of independent analytical tools, with each development examining the market from a different perspective while following the same underlying philosophy.
Our research and development covers areas such as market structure and dynamic price levels, volume behaviour and directional flow, momentum and divergence, trading sessions and market activity, spread and timing information, compression and expansion, event-related market awareness and other forms of market behaviour that may provide useful context beyond price alone.
Some tools focus primarily on visualization. Others examine structural behaviour or provide practical information directly on the chart.
Each tool is developed to remain independently useful.
At the same time, different forms of analysis can complement one another, allowing the same market to be observed from multiple perspectives without requiring one HIZOA product to depend on another.
The HIZOA ecosystem will continue to evolve as new concepts are researched, tested and developed.
Not every idea or research concept will necessarily become a product.
Development is driven by whether a concept can provide clear, practical and meaningful analytical value.
FROM NOVA TO HIZOA
HIZOA originated from development that initially began under the NOVA name.
What started with individual market-analysis tools gradually developed into a much broader collection of ideas, indicators and research projects.
As that work expanded, it became clear that these developments shared the same underlying philosophy and were becoming part of something larger.
HIZOA became the identity connecting that work.
The transition from NOVA is therefore part of our development history, while HIZOA is the identity moving forward.
OUR PRINCIPLE
Markets will always contain uncertainty.
No indicator can remove that uncertainty, and no analytical tool should make promises about what the market must do next.
What we can do is continue researching, testing and developing tools that help make relevant market information easier to observe, interpret and understand.
That is what HIZOA is built around.
Provide information rather than promises.
Observe the information.
Understand the structure.
Make your own decision.
The final interpretation — and every trading decision — remains with the trader.
HIZOA
Structure Beyond the Visible
Welcome to HIZOA.
HIZOA is focused on the development of analytical tools for traders who want to look beyond price alone.
Financial markets contain layers of information that are not always immediately visible on a standard chart. Market structure, volume behaviour, directional flow, momentum, support and resistance, changing volatility and market activity can all provide additional perspectives on what is happening beneath the surface.
Our goal is to develop tools that make this information clearer, structured and practical to observe.
WHY HIZOA?
The name HIZOA is inspired by astronomy and the HI Zone of Avoidance (HIZOA) surveys.
Large areas of the universe are difficult to observe because gas, dust and stars within our own Milky Way obscure what lies beyond. By using different observational techniques, astronomers can nevertheless detect and study structures and galaxies hidden from ordinary view.
That concept immediately connected with the philosophy behind our tools.
STRUCTURE BEYOND THE VISIBLE
Markets contain considerably more information than price alone can immediately show.
Different forms of analysis can reveal additional structure in volume, momentum, directional behaviour, volatility, market activity and the interaction between price levels.
HIZOA is not about predicting the future.
Our tools are not designed to tell traders what they must buy or sell, nor do we believe an indicator should pretend to know what the market will do next.
Instead, we focus on observation, visualization and structure.
Observe the information.
Understand the structure.
Make your own decision.
That principle remains at the core of everything we build.
The trader always remains in control.
DEVELOPMENT THROUGH RESEARCH
As HIZOA has developed, our approach to testing has evolved as well.
Visual chart testing remains important, but we wanted the ability to investigate indicator behaviour much deeper and on a considerably larger scale.
For this reason, we developed our own HIZOA Indicator Optimization Suite.
This internal research environment allows us to systematically examine how an indicator behaves across different parameter values, instruments, timeframes and historical periods.
Although the Suite itself is still under active development and testing, it has already made a significant difference in the way we can research our tools.
Instead of manually changing individual settings and evaluating a limited number of charts, we can perform thousands of targeted tests on calculation settings in a relatively short period of time.
The resulting indicator output can then be analyzed to understand what actually changes when a parameter is adjusted.
This allows us to investigate areas such as:
• Structural and directional persistence
• Confirmation behaviour
• Reversals and changing market conditions
• Parameter sensitivity and interaction
• Differences between instruments
• Differences between timeframes
• Stability across different historical periods
• Whether additional filtering genuinely improves an indicator's behaviour or simply introduces additional delay
This creates a much deeper testing process than visual observation alone.
Importantly, the HIZOA Indicator Optimization Suite is not a trading-strategy or profitability optimizer.
It does not use profit/loss, entries, exits, stop losses, take profits, lot sizes or drawdown to determine whether an indicator setting is better.
Its purpose is to understand the indicator itself and evaluate the behaviour of its calculated output.
The knowledge gained from this research can contribute to better calibrated settings, improved automatic profiles and more thoroughly tested future upgrades across HIZOA tools.
The HIZOA Indicator Optimization Suite is currently an internal development tool and is not intended for sale.
As the project continues to mature, however, we may reconsider this in the future.
STRATEGY RESEARCH — A SEPARATE DEVELOPMENT PATH
Alongside our indicator research, we are also working on another testing environment with a fundamentally different purpose.
Where the Indicator Optimization Suite focuses entirely on understanding and improving individual analytical tools, this separate project focuses on trading-strategy research.
The objective is to investigate how different HIZOA tools may work together when combined within complete trading concepts.
This environment is being developed to examine elements such as:
• Combinations of analytical tools
• Entry conditions
• Stop-loss placement
• Take-profit methods
• Trade management
• Drawdown
• Other strategy-related variables
Keeping these two research environments separate is important.
An indicator can be evaluated on whether it performs its intended analytical function consistently without making assumptions about profitability.
Strategy research asks an entirely different question: what happens when analytical information is combined with actual trading rules?
By separating those two areas, we can research both without confusing indicator quality with trading performance.
THE HIZOA ECOSYSTEM
HIZOA is not built around a single indicator or one specific method of market analysis.
It is a growing collection of independent analytical tools, with each development examining the market from a different perspective while following the same underlying philosophy.
Our research and development covers areas such as market structure and dynamic price levels, volume behaviour and directional flow, momentum and divergence, trading sessions and market activity, spread and timing information, compression and expansion, event-related market awareness and other forms of market behaviour that may provide useful context beyond price alone.
Some tools focus primarily on visualization. Others examine structural behaviour or provide practical information directly on the chart.
Each tool is developed to remain independently useful.
At the same time, different forms of analysis can complement one another, allowing the same market to be observed from multiple perspectives without requiring one HIZOA product to depend on another.
The HIZOA ecosystem will continue to evolve as new concepts are researched, tested and developed.
Not every idea or research concept will necessarily become a product.
Development is driven by whether a concept can provide clear, practical and meaningful analytical value.
FROM NOVA TO HIZOA
HIZOA originated from development that initially began under the NOVA name.
What started with individual market-analysis tools gradually developed into a much broader collection of ideas, indicators and research projects.
As that work expanded, it became clear that these developments shared the same underlying philosophy and were becoming part of something larger.
HIZOA became the identity connecting that work.
The transition from NOVA is therefore part of our development history, while HIZOA is the identity moving forward.
OUR PRINCIPLE
Markets will always contain uncertainty.
No indicator can remove that uncertainty, and no analytical tool should make promises about what the market must do next.
What we can do is continue researching, testing and developing tools that help make relevant market information easier to observe, interpret and understand.
That is what HIZOA is built around.
Provide information rather than promises.
Observe the information.
Understand the structure.
Make your own decision.
The final interpretation — and every trading decision — remains with the trader.
HIZOA
Structure Beyond the Visible
Amigos
1