|
10+ años
experiencia
|
18
productos
|
39
versiones demo
|
|
6
trabajos
|
0
señales
|
0
suscriptores
|
Development: MT 4 & 5, NinjaTrader 7 & 8.
Translations from Pine.
Telegram: https://t.me/fxstill (Literature on cryptocurrencies, development and code)
YouTube: https://www.youtube.com/@FxStill
Discord: https://discord.gg/EejeSfqU
Translations from Pine.
Telegram: https://t.me/fxstill (Literature on cryptocurrencies, development and code)
YouTube: https://www.youtube.com/@FxStill
Discord: https://discord.gg/EejeSfqU


Andrei Novichkov
Ha publicado el producto
Andrei Novichkov
2025.01.23
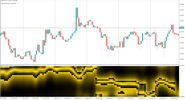
Full documentation for this complex indicator in pdf format can be downloaded from here: https://fxstill.com/indikators/indicator-market-profiles-linear-united-for-metatrader-4-5-fxstill