Roberto Alexander Quan / Vendedor
Productos publicados

Un Gap ocurre cuando el precio se mueve con "fuerza" en una direccion dada (arriba o abajo). El Gap se forma cuando, cuando se ven tres candelas consecutivas, la cola de la primera y tercera candela no se interceptan. Cuando esto ocurre, el indicador crea un rectangulo donde el Gap se encuentra. Identifica una zona donde el precio tiene el potencial de regresar (mitigación). El Gap o rectantugo es mitigado cuando el precio vuelve y cubre completamente el rectangulo. Note que tambien el indicado

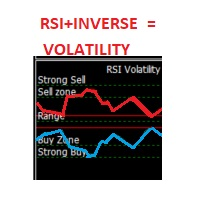
Este indicador es un oscilador que muestra el RSI (Relative Strength Index) en rojo y su gráfico inverso en verde claro. Juntos muestran la volatilidad del mercado (en su configuración por defecto). También puede cambiar para mostrar sólo el gráfico del RSI. También le ofrece la posibilidad de cambiar su periodo. de cambiar su Periodo. Las zonas de los osciladores (80,70,50,30,20) están marcadas por Venta Fuerte, Zona de Venta, Rango, Zona de Compra y Compra Fuerte respectivamente.